
8.2 KiB
Name
MACD机器人交易策略MACD-Robot-Trading-Strategy
Author
ChaoZhang
Strategy Description
 [trans]
概述
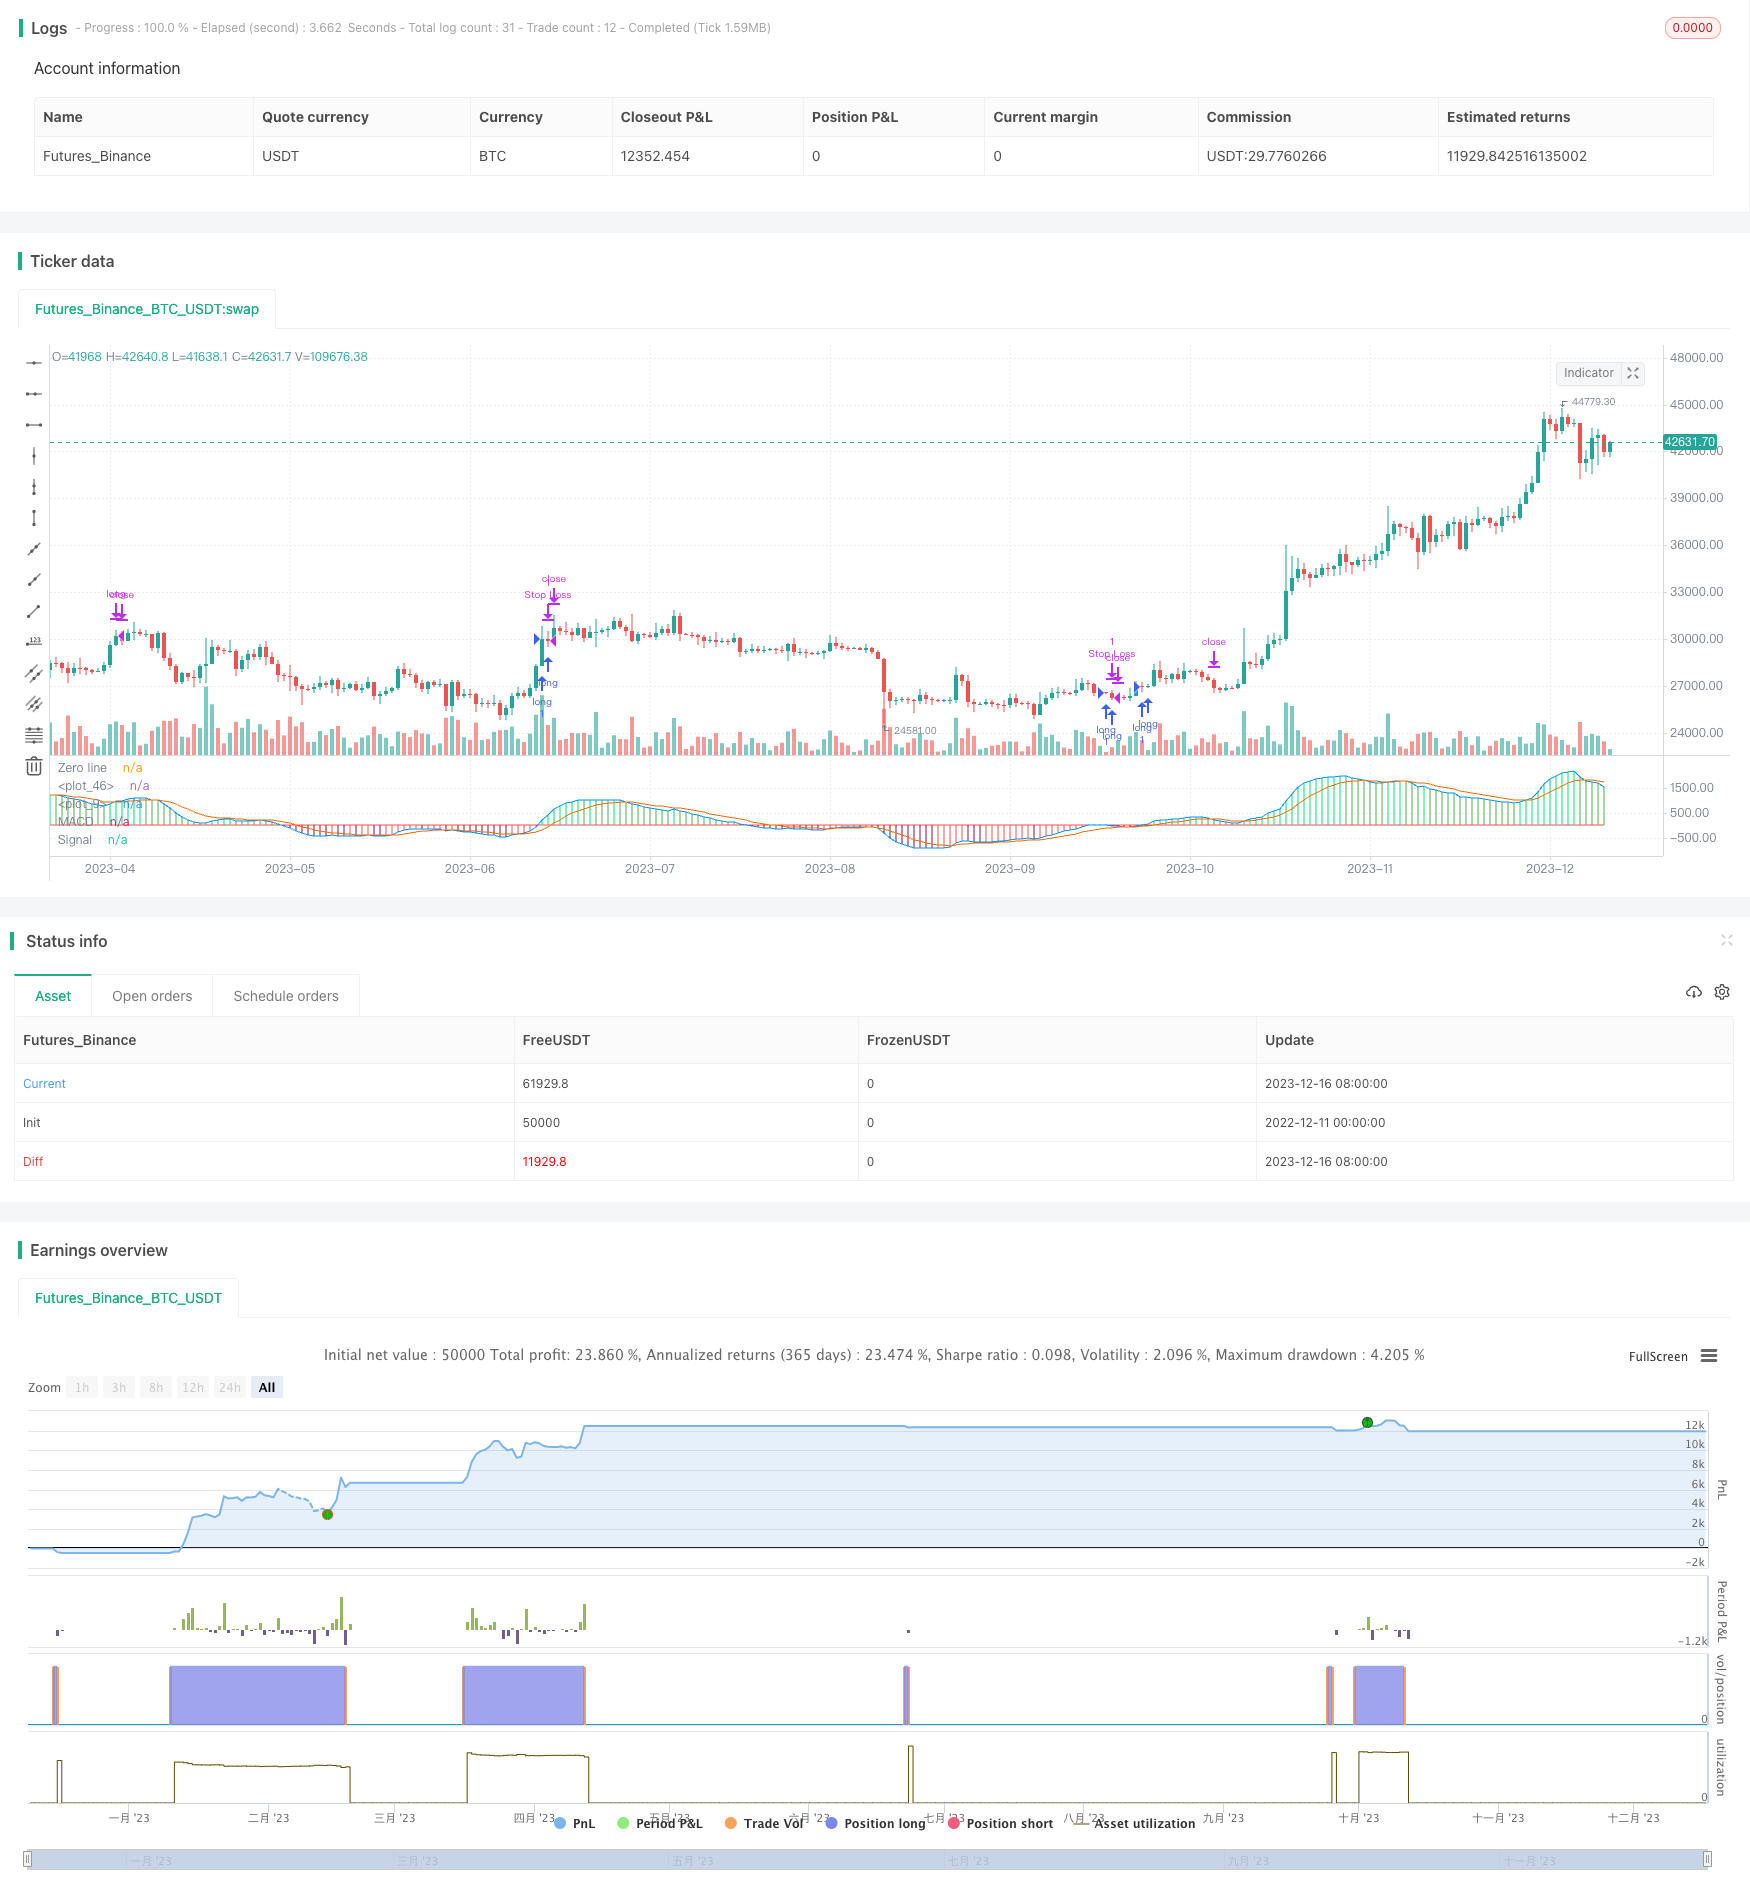
本策略名为MACD机器人交易策略。该策略通过计算MACD指标的快线和慢线的关系,判断市场买卖时机,采取追踪止损来控制风险。
策略原理
该策略主要基于MACD指标开发。MACD指标是由快线和慢线组成,快线是短期平均线,慢线是长期平均线,二者关系反映市场买卖状态。当快线上穿慢线时为买入信号,下穿为卖出信号。
本策略中,快线和慢线分别采用EMA算法计算,周期可自定义。为了提高信号质量,又加入了信号线,采用EMA算法对MACD值进行再一次平滑处理。
在判定买入时机时,不仅看快慢线金叉,还要判断MACD绝对值是否大于自定义的买入线。满足则发出买入信号,采用追踪止损来控制风险。
在判定卖出时机时,要同时满足快慢线死叉和信号线为正数的条件,则发出卖出信号,平掉仓位。
优势分析
该策略具有以下几个优势:
- 使用MACD指标判断买卖时机,可靠性较高
- 增加信号线提高信号质量
- 追踪止损有效控制风险
- 买入线可自定义调整策略灵敏度
- 条件全部基于指标计算,不受外部影响
风险分析
该策略也存在一些风险:
- MACD指标存在滞后,可能错过短线操作机会
- 止损点设置不当可能造成不必要的亏损
- Parameter Tuning需要花费大量时间测试调整
- 交易成本和滑点的影响
可通过适当调整参数、组合其他指标等方式来减少这些风险。
优化方向
该策略可从以下几个方向进行优化:
- 结合其它指标过滤信号,例如KDJ、RSI等
- 增加机器学习算法判断买卖点
- 采用动态止损代替静态止损
- 对MACD参数以及买入线进行测试优化
- 考虑交易成本的影响调整策略
总结
本策略overall来说是一个可靠性较高的趋势跟踪策略。通过MACD指标判断趋势,采取追踪止损控制风险,可以获得稳定的投资回报。NEXT STEP是进一步优化参数,组合其他指标,结合机器学习等方式提高策略profitability。
||
Overview
This strategy is called MACD Robot Trading Strategy. It determines the timing of buying and selling in the market by calculating the relationship between the MACD indicator's fast line and slow line, and adopts trailing stop loss to control risks.
Strategy Principle
This strategy is mainly developed based on the MACD indicator. The MACD indicator consists of a fast line and a slow line. The fast line is a short-term moving average and the slow line is a long-term moving average. The relationship between the two reflects the state of buying and selling in the market. When the fast line crosses above the slow line, it is a buy signal, and when it crosses below, it is a sell signal.
In this strategy, the fast line and slow line are calculated using the EMA algorithm respectively, and the periods can be customized. In order to improve the signal quality, a signal line is added, which uses the EMA algorithm to smooth the MACD value again.
When determining the timing of buying, check not only the golden cross of fast and slow lines, but also whether the absolute value of MACD is greater than the customized buy line. If yes, a buy signal is issued and trailing stop loss is used to control risks.
When determining the timing of selling, the death cross of fast and slow lines and the signal line being positive are required to be met at the same time, then a sell signal is issued to close the position.
Advantage Analysis
The strategy has the following advantages:
- Using MACD indicator to determine trading signals with high reliability
- Increasing signal line improves signal quality
- Trailing stop loss effectively controls risks
- Customizable buy line adjusts strategy sensitivity
- All conditions are based on indicator calculation, not affected by external factors
Risk Analysis
The strategy also has some risks:
- MACD indicator has lagging, may miss short-term trading opportunities
- Improper setting of stop loss point may cause unnecessary losses
- Parameter Tuning requires a lot of time for testing and adjustment
- Impact of transaction costs and slippage
These risks can be reduced by appropriately adjusting parameters, combining other indicators, etc.
Optimization Directions
The strategy can be optimized in the following directions:
- Combine with other indicators to filter signals, such as KDJ, RSI, etc.
- Add machine learning algorithms to determine entry and exit points
- Use dynamic stop loss instead of static stop loss
- Test and optimize MACD parameters and buy line
- Consider the impact of transaction costs to adjust strategy
Conclusion
Overall, this is a trend-following strategy with high reliability. By judging the trend through MACD indicator and controlling risks with trailing stop loss, stable investment returns can be obtained. NEXT STEP is to further optimize parameters, combine other indicators, and incorporate machine learning to improve strategy profitability.
[/trans]
Strategy Arguments
| Argument | Default | Description |
|---|---|---|
| v_input_1 | 12 | Fast moving average |
| v_input_2 | 26 | Slow moving average |
| v_input_3 | 12 | Fast Length |
| v_input_4 | 26 | Slow Length |
| v_input_5_close | 0 | Source: close |
| v_input_6 | 9 | Signal Smoothing |
| v_input_7 | false | Simple MA(Oscillator) |
| v_input_8 | false | Simple MA(Signal Line) |
| v_input_9 | -0.00045 | Enter Long |
| v_input_10 | 0.0001 | Close Long |
| v_input_11 | 0.05 | Stop Loss % |
Source (PineScript)
/*backtest
start: 2022-12-11 00:00:00
end: 2023-12-17 00:00:00
period: 1d
basePeriod: 1h
exchanges: [{"eid":"Futures_Binance","currency":"BTC_USDT"}]
*/

//@version=3
strategy(shorttitle = "GBPUSD MACD", title = "GBPUSD MACD")
fastMA = input(title="Fast moving average",  defval = 12, minval = 7)
slowMA = input(title="Slow moving average",  defval = 26, minval = 7)
lastColor = yellow
[currMacd,_,_] = macd(close[0], fastMA, slowMA, 9)
[prevMacd,_,_] = macd(close[1], fastMA, slowMA, 9)
plotColor = currMacd > 0 ? currMacd > prevMacd ? lime : green : currMacd < prevMacd ? maroon : red
plot(currMacd, style = histogram, color = plotColor, linewidth = 3)
plot(0, title = "Zero line", linewidth = 1, color = gray)

//MACD
// Getting inputs
fast_length = input(title="Fast Length",  defval=12)
slow_length = input(title="Slow Length",  defval=26)
src = input(title="Source", defval=close)
signal_length = input(title="Signal Smoothing",  minval = 1, maxval = 50, defval =9)
sma_source = input(title="Simple MA(Oscillator)", type=bool, defval=false)
sma_signal = input(title="Simple MA(Signal Line)", type=bool, defval=false)

// Plot colors
col_grow_above = #26A69A
col_grow_below = #FFCDD2
col_fall_above = #B2DFDB
col_fall_below = #EF5350
col_macd = #0094ff
col_signal = #ff6a00

// Calculating
fast_ma = sma_source ? sma(src, fast_length) : ema(src, fast_length)
slow_ma = sma_source ? sma(src, slow_length) : ema(src, slow_length)
macd = fast_ma - slow_ma
signal = sma_signal ? sma(macd, signal_length) : ema(macd, signal_length)
hist = macd - signal

//plot(hist, title="Histogram", style=columns, color=(hist>=0 ? (hist[1] < hist ? col_grow_above : col_fall_above) : (hist[1] < hist ? col_grow_below : col_fall_below) ), transp=0 )
plot(macd, title="MACD", color=col_macd, transp=0)
plot(signal, title="Signal", color=col_signal, transp=0)
///END OF MACD

//Long and Close Long Lines
linebuy = input(title="Enter Long", type=float, defval=-0.00045)
linesell = input(title="Close Long", type=float, defval=0.0001)

//Plot Long and Close Long Lines
plot(linebuy,color=green),plot(linesell,color=red)


//Stop Loss Input
sl_inp = input(0.05, title='Stop Loss %', type=float)/100


//Order Conditions
longCond = crossover(currMacd, linebuy)
exitLong = crossover(currMacd, signal) and signal > 0
stop_level = strategy.position_avg_price * (1 - sl_inp)


//Order Entries
strategy.entry("long", strategy.long,  when=longCond==true)
strategy.close("long", when=exitLong==true)
strategy.exit("Stop Loss", stop=stop_level)
Detail
https://www.fmz.com/strategy/435768
Last Modified
2023-12-18 17:30:15