
13 KiB
Name
MACD和RSI结合的自然交易策略-MACD-and-RSI-Combined-Natural-Trading-Strategy
Author
ChaoZhang
Strategy Description
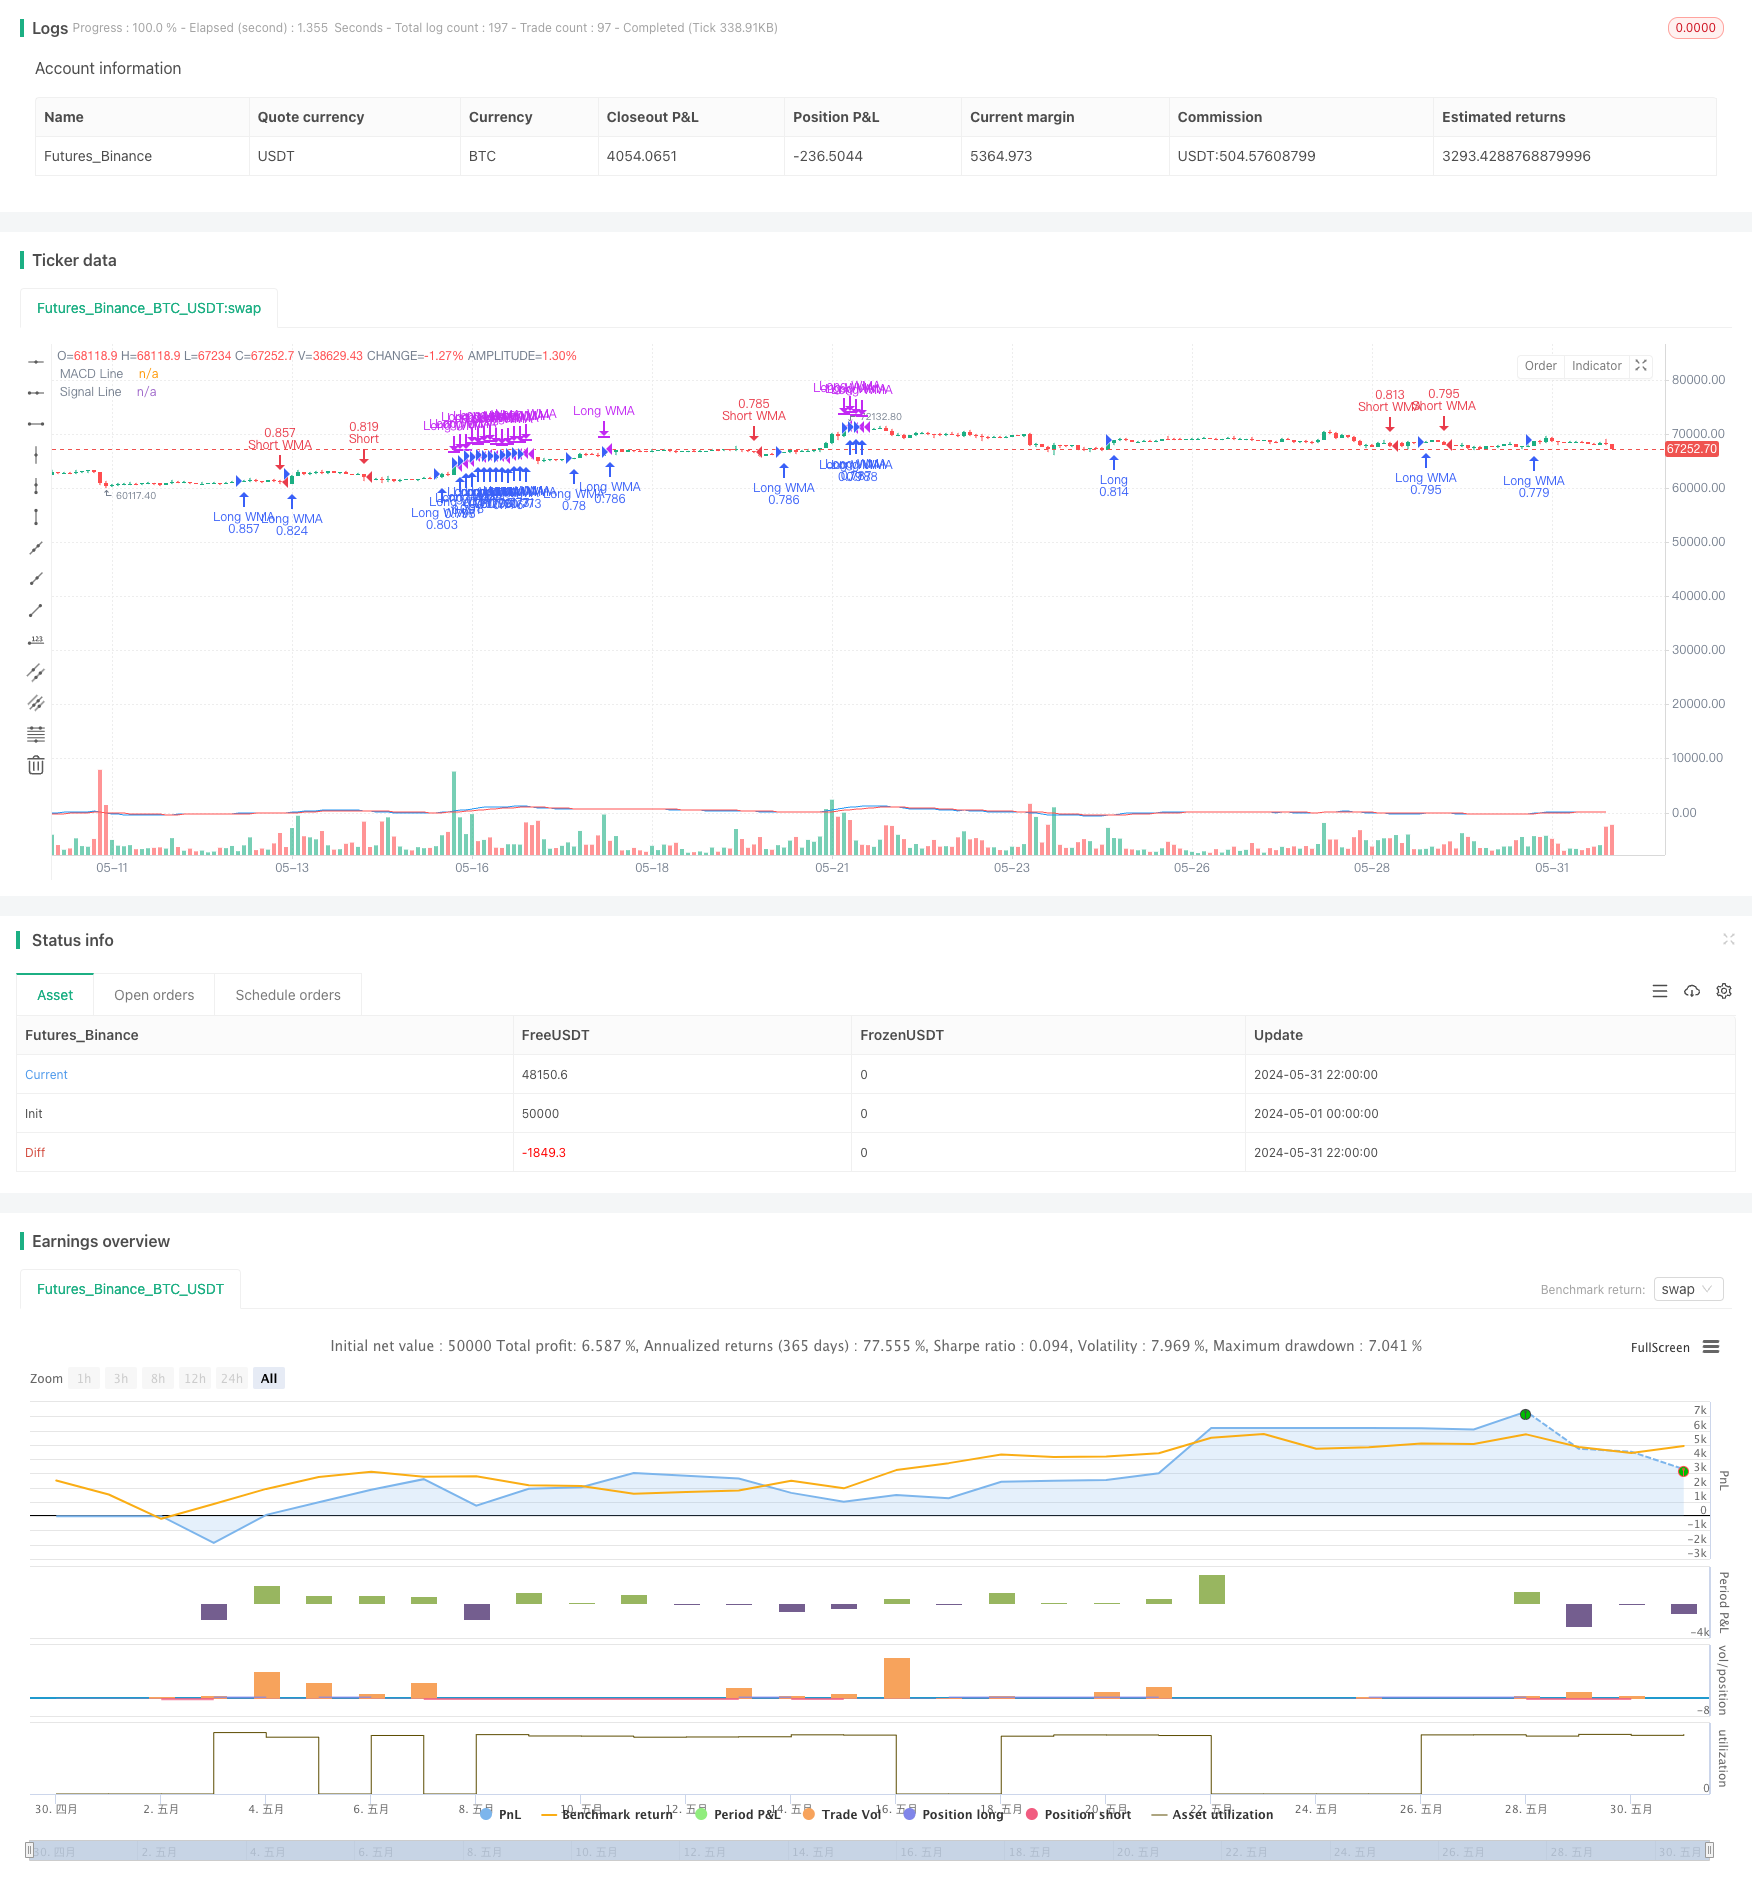
[trans]
概述
该策略结合了MACD和RSI两个技术指标,利用MACD的交叉信号和RSI的超买超卖信号来判断交易时机。同时,策略还引入了加权移动平均线(WMA)作为辅助判断,以提高策略的可靠性。策略在1小时时间框架下运行,当MACD出现金叉且RSI大于50时开多仓,当MACD出现死叉且RSI小于50时开空仓。同时,当RSI大于70时平多仓,RSI小于30时平空仓。此外,策略还设置了多个时间框架的变量,用于判断不同时间尺度下的趋势变化。
策略原理
该策略的核心是MACD和RSI两个技术指标的结合运用。MACD由快线(短期移动平均线)和慢线(长期移动平均线)的差值构成,能够反映市场的趋势变化。当快线上穿慢线时,形成金叉,表明上升趋势,反之则形成死叉,表明下跌趋势。RSI是衡量市场超买超卖状态的指标,当RSI大于70时,表明市场处于超买状态,可能面临回调风险;当RSI小于30时,表明市场处于超卖状态,可能迎来反弹机会。
该策略将MACD和RSI结合起来,利用MACD的趋势判断和RSI的超买超卖判断,可以更准确地把握交易时机。同时,策略还引入了加权移动平均线(WMA)作为辅助判断,WMA相比普通移动平均线更加重视近期价格,能够更敏感地反映价格变化。
此外,策略还设置了多个时间框架的变量(如15分钟、30分钟、1小时、2小时等),用于判断不同时间尺度下的趋势变化。这种多时间框架的分析方法,可以帮助策略更全面地把握市场趋势,提高决策的准确性。
优势分析
- 结合了MACD和RSI两个有效的技术指标,能够较好地把握市场趋势和超买超卖状态,提高交易决策的准确性。
- 引入了加权移动平均线(WMA)作为辅助判断,WMA更加重视近期价格,能够更敏感地反映价格变化,提高策略的适应性。
- 设置了多个时间框架的变量,实现了多时间框架的联合分析,可以更全面地把握市场趋势,提高决策的可靠性。
- 在1小时的时间框架下运行,交易频率适中,可以较好地平衡交易成本和收益。
- 设置了明确的开仓和平仓条件,如MACD金叉死叉、RSI超买超卖等,易于理解和实施。
风险分析
- MACD和RSI都是滞后指标,在市场快速变化时,可能出现指标信号与价格脱节的情况,导致错误信号。
- 策略在单一时间框架(1小时)下运行,可能无法充分捕捉到不同时间尺度下的趋势变化,存在一定的局限性。
- 策略缺乏对风险的控制措施,如止损和仓位管理等,在市场剧烈波动时,可能面临较大的回撤风险。
- 策略的参数设置(如MACD的快慢线周期、RSI的时间周期等)可能需要根据不同的市场状况进行调整,参数的选择存在一定的主观性和不确定性。
优化方向
- 引入更多的技术指标,如布林带、ATR等,构建更加稳健的交易信号,提高策略的可靠性。
- 优化策略的时间框架选择,如增加日线等更高级别的时间框架,以更好地把握大趋势,同时在低级别时间框架(如15分钟、5分钟等)设置具体的入场点,提高策略的精准度。
- 加入风险控制措施,如设置合理的止损位,对持仓头寸进行限制,以控制回撤风险。
- 对策略的参数进行优化,可以使用机器学习等方法,根据历史数据自动寻找最优参数组合,减少主观判断的影响。
- 考虑引入市场情绪等其他因素,如交易量、持仓量等,以更全面地把握市场状态,提高策略的适应性。
总结
该策略通过结合MACD和RSI两个有效的技术指标,同时引入WMA作为辅助判断,在1小时时间框架下进行交易决策。策略逻辑清晰,易于理解和实施,能够较好地把握市场趋势和超买超卖状态,具有一定的可行性。但是,策略也存在一些局限性和风险,如滞后性、单一时间框架、缺乏风险控制等。未来可以从引入更多指标、优化时间框架、加强风险控制、参数优化等方面对策略进行改进,以提高其稳健性和盈利能力。总的来说,该策略为量化交易提供了一种思路,但还需要在实践中不断优化和完善。
||
Overview
This strategy combines two technical indicators, MACD and RSI, using MACD crossover signals and RSI overbought/oversold signals to determine trading timing. Meanwhile, the strategy also introduces the Weighted Moving Average (WMA) as an auxiliary judgment to improve the reliability of the strategy. The strategy runs on a 1-hour timeframe, opening long positions when MACD forms a golden cross and RSI is above 50, and opening short positions when MACD forms a death cross and RSI is below 50. At the same time, it closes long positions when RSI is above 70 and closes short positions when RSI is below 30. In addition, the strategy sets variables for multiple timeframes to judge trend changes at different time scales.
Strategy Principles
The core of this strategy is the combined use of two technical indicators, MACD and RSI. MACD is composed of the difference between the fast line (short-term moving average) and the slow line (long-term moving average), which can reflect market trend changes. When the fast line crosses above the slow line, it forms a golden cross, indicating an upward trend; conversely, it forms a death cross, indicating a downward trend. RSI is an indicator that measures the overbought and oversold state of the market. When RSI is above 70, it indicates that the market is overbought and may face a pullback risk; when RSI is below 30, it indicates that the market is oversold and may usher in a rebound opportunity.
This strategy combines MACD and RSI, using MACD's trend judgment and RSI's overbought/oversold judgment to more accurately grasp trading timing. At the same time, the strategy also introduces the Weighted Moving Average (WMA) as an auxiliary judgment. WMA places more emphasis on recent prices compared to ordinary moving averages, and can more sensitively reflect price changes.
In addition, the strategy sets variables for multiple timeframes (such as 15 minutes, 30 minutes, 1 hour, 2 hours, etc.) to judge trend changes at different time scales. This multi-timeframe analysis method can help the strategy grasp market trends more comprehensively and improve the accuracy of decision-making.
Advantage Analysis
- It combines two effective technical indicators, MACD and RSI, which can better grasp market trends and overbought/oversold conditions, improving the accuracy of trading decisions.
- It introduces the Weighted Moving Average (WMA) as an auxiliary judgment. WMA places more emphasis on recent prices and can more sensitively reflect price changes, improving the adaptability of the strategy.
- It sets variables for multiple timeframes, realizing joint analysis of multiple timeframes, which can more comprehensively grasp market trends and improve the reliability of decisions.
- It runs on a 1-hour timeframe, with a moderate trading frequency, which can better balance trading costs and returns.
- It sets clear opening and closing conditions, such as MACD golden cross/death cross, RSI overbought/oversold, etc., which are easy to understand and implement.
Risk Analysis
- Both MACD and RSI are lagging indicators. When the market changes rapidly, there may be a disconnect between indicator signals and prices, leading to false signals.
- The strategy runs on a single timeframe (1 hour), which may not fully capture trend changes at different time scales, and has certain limitations.
- The strategy lacks risk control measures, such as stop-loss and position management, which may face greater drawdown risks when the market fluctuates violently.
- The parameter settings of the strategy (such as the fast and slow line periods of MACD, the time period of RSI, etc.) may need to be adjusted according to different market conditions. The selection of parameters has certain subjectivity and uncertainty.
Optimization Direction
- Introduce more technical indicators, such as Bollinger Bands, ATR, etc., to build more robust trading signals and improve the reliability of the strategy.
- Optimize the selection of the strategy's timeframes, such as adding higher-level timeframes like daily charts to better grasp the big trend, while setting specific entry points on lower-level timeframes (such as 15 minutes, 5 minutes, etc.) to improve the precision of the strategy.
- Add risk control measures, such as setting reasonable stop-loss positions and limiting the size of positions, to control drawdown risks.
- Optimize the parameters of the strategy. Machine learning and other methods can be used to automatically find the optimal parameter combination based on historical data, reducing the impact of subjective judgment.
- Consider introducing other factors such as market sentiment, trading volume, open interest, etc., to more comprehensively grasp the market state and improve the adaptability of the strategy.
Summary
This strategy combines two effective technical indicators, MACD and RSI, while introducing WMA as an auxiliary judgment to make trading decisions on a 1-hour timeframe. The strategy logic is clear, easy to understand and implement, and can better grasp market trends and overbought/oversold conditions, with certain feasibility. However, the strategy also has some limitations and risks, such as lag, single timeframe, lack of risk control, etc. In the future, the strategy can be improved in terms of introducing more indicators, optimizing timeframes, strengthening risk control, parameter optimization, etc., to enhance its robustness and profitability. Overall, this strategy provides a way of thinking for quantitative trading, but still needs to be continuously optimized and refined in practice. [/trans]
Source (PineScript)
/*backtest
start: 2024-05-01 00:00:00
end: 2024-05-31 23:59:59
period: 2h
basePeriod: 15m
exchanges: [{"eid":"Futures_Binance","currency":"BTC_USDT"}]
*/

//@version=5
strategy("Improved MACD and RSI Trading Strategy", overlay=true, initial_capital=10000, commission_type=strategy.commission.percent, commission_value=0.01, default_qty_type=strategy.percent_of_equity, default_qty_value=100)

// MACD 設置
fast_length = input(12, title="MACD Fast Length")
slow_length = input(26, title="MACD Slow Length")
signal_smoothing = input(9, title="MACD Signal Smoothing")

// RSI 設置
input_rsi_length = input.int(14, title="RSI Length")
input_rsi_source = input(close, "RSI Source")

RSI = ta.rsi(input_rsi_source, input_rsi_length)

// 計算MACD和信號線
[macdLine, signalLine, _] = ta.macd(close, fast_length, slow_length, signal_smoothing)

// 自然交易理論:利用MACD和RSI的結合
ma(source, length, type) =>
    switch type
        "SMA" => ta.sma(source, length)
        "EMA" => ta.ema(source, length)
        "SMMA (RMA)" => ta.rma(source, length)
        "WMA" => ta.wma(source, length)
        "VWMA" => ta.vwma(source, length)

maTypeInput = input.string("SMA", title="Moving Average Type", options=["SMA", "EMA", "SMMA (RMA)", "WMA", "VWMA"], group="MA Settings")
maLengthInput = input.int(14, title="Moving Average Length", group="MA Settings")

macdMA = ma(macdLine, maLengthInput, maTypeInput)

// 設置交易信號
longCondition = ta.crossover(macdLine, signalLine) and macdLine > macdMA and RSI < 70
shortCondition = ta.crossunder(macdLine, signalLine) and macdLine < macdMA and RSI > 30

// 定義時間框架
tf_15m = ta.change(RSI, 15) > 0 ? 1 : 0
tf_30m = ta.change(RSI, 30) > 0 ? 1 : 0
tf_1h = ta.change(RSI, 60) > 0 ? 1 : 0
tf_2h = ta.change(RSI, 120) > 0 ? 1 : 0
tf_4h = ta.change(RSI, 240) > 0 ? 1 : 0
tf_6h = ta.change(RSI, 360) > 0 ? 1 : 0
tf_8h = ta.change(RSI, 480) > 0 ? 1 : 0
tf_12h = ta.change(RSI, 720) > 0 ? 1 : 0
tf_1d = ta.change(RSI, 1440) > 0 ? 1 : 0

// 設置開倉、平倉和空倉條件
if (longCondition and tf_1h and RSI > 50)
    strategy.entry("Long", strategy.long)
if (shortCondition and tf_1h and RSI < 50)
    strategy.entry("Short", strategy.short)

if (tf_1h and RSI > 70)
    strategy.close("Long")
if (tf_1h and RSI < 30)
    strategy.close("Short")

// 加入其他策略
// 定義加權平均價格
wma(source, length) =>
    wma = 0.0
    sum = 0.0
    sum_wts = 0.0
    for i = 0 to length - 1
        wts = (length - i) * (length - i)
        sum := sum + source[i] * wts
        sum_wts := sum_wts + wts
    wma := sum / sum_wts

wmaLength = input.int(20, title="WMA Length", group="Other Strategies")
wmaValue = wma(close, wmaLength)

// 設置交易信號
longWMACondition = close > wmaValue
shortWMACondition = close < wmaValue

if (longWMACondition and tf_1h and RSI > 50)
    strategy.entry("Long WMA", strategy.long)
if (shortWMACondition and tf_1h and RSI < 50)
    strategy.entry("Short WMA", strategy.short)

if (tf_1h and RSI > 70)
    strategy.close("Long WMA")
if (tf_1h and RSI < 30)
    strategy.close("Short WMA")

// 繪製MACD和RSI
plot(macdLine, color=color.blue, title="MACD Line")
plot(signalLine, color=color.red, title="Signal Line")
Detail
https://www.fmz.com/strategy/453287
Last Modified
2024-06-03 17:22:03