
9.3 KiB
Name
MACD双转换零滞后交易策略-基于短期趋势捕捉的高频交易-Zero-Lag-MACD-Dual-Crossover-Trading-Strategy-High-Frequency-Trading-Based-on-Short-Term-Trend-Capture
Author
ChaoZhang
Strategy Description
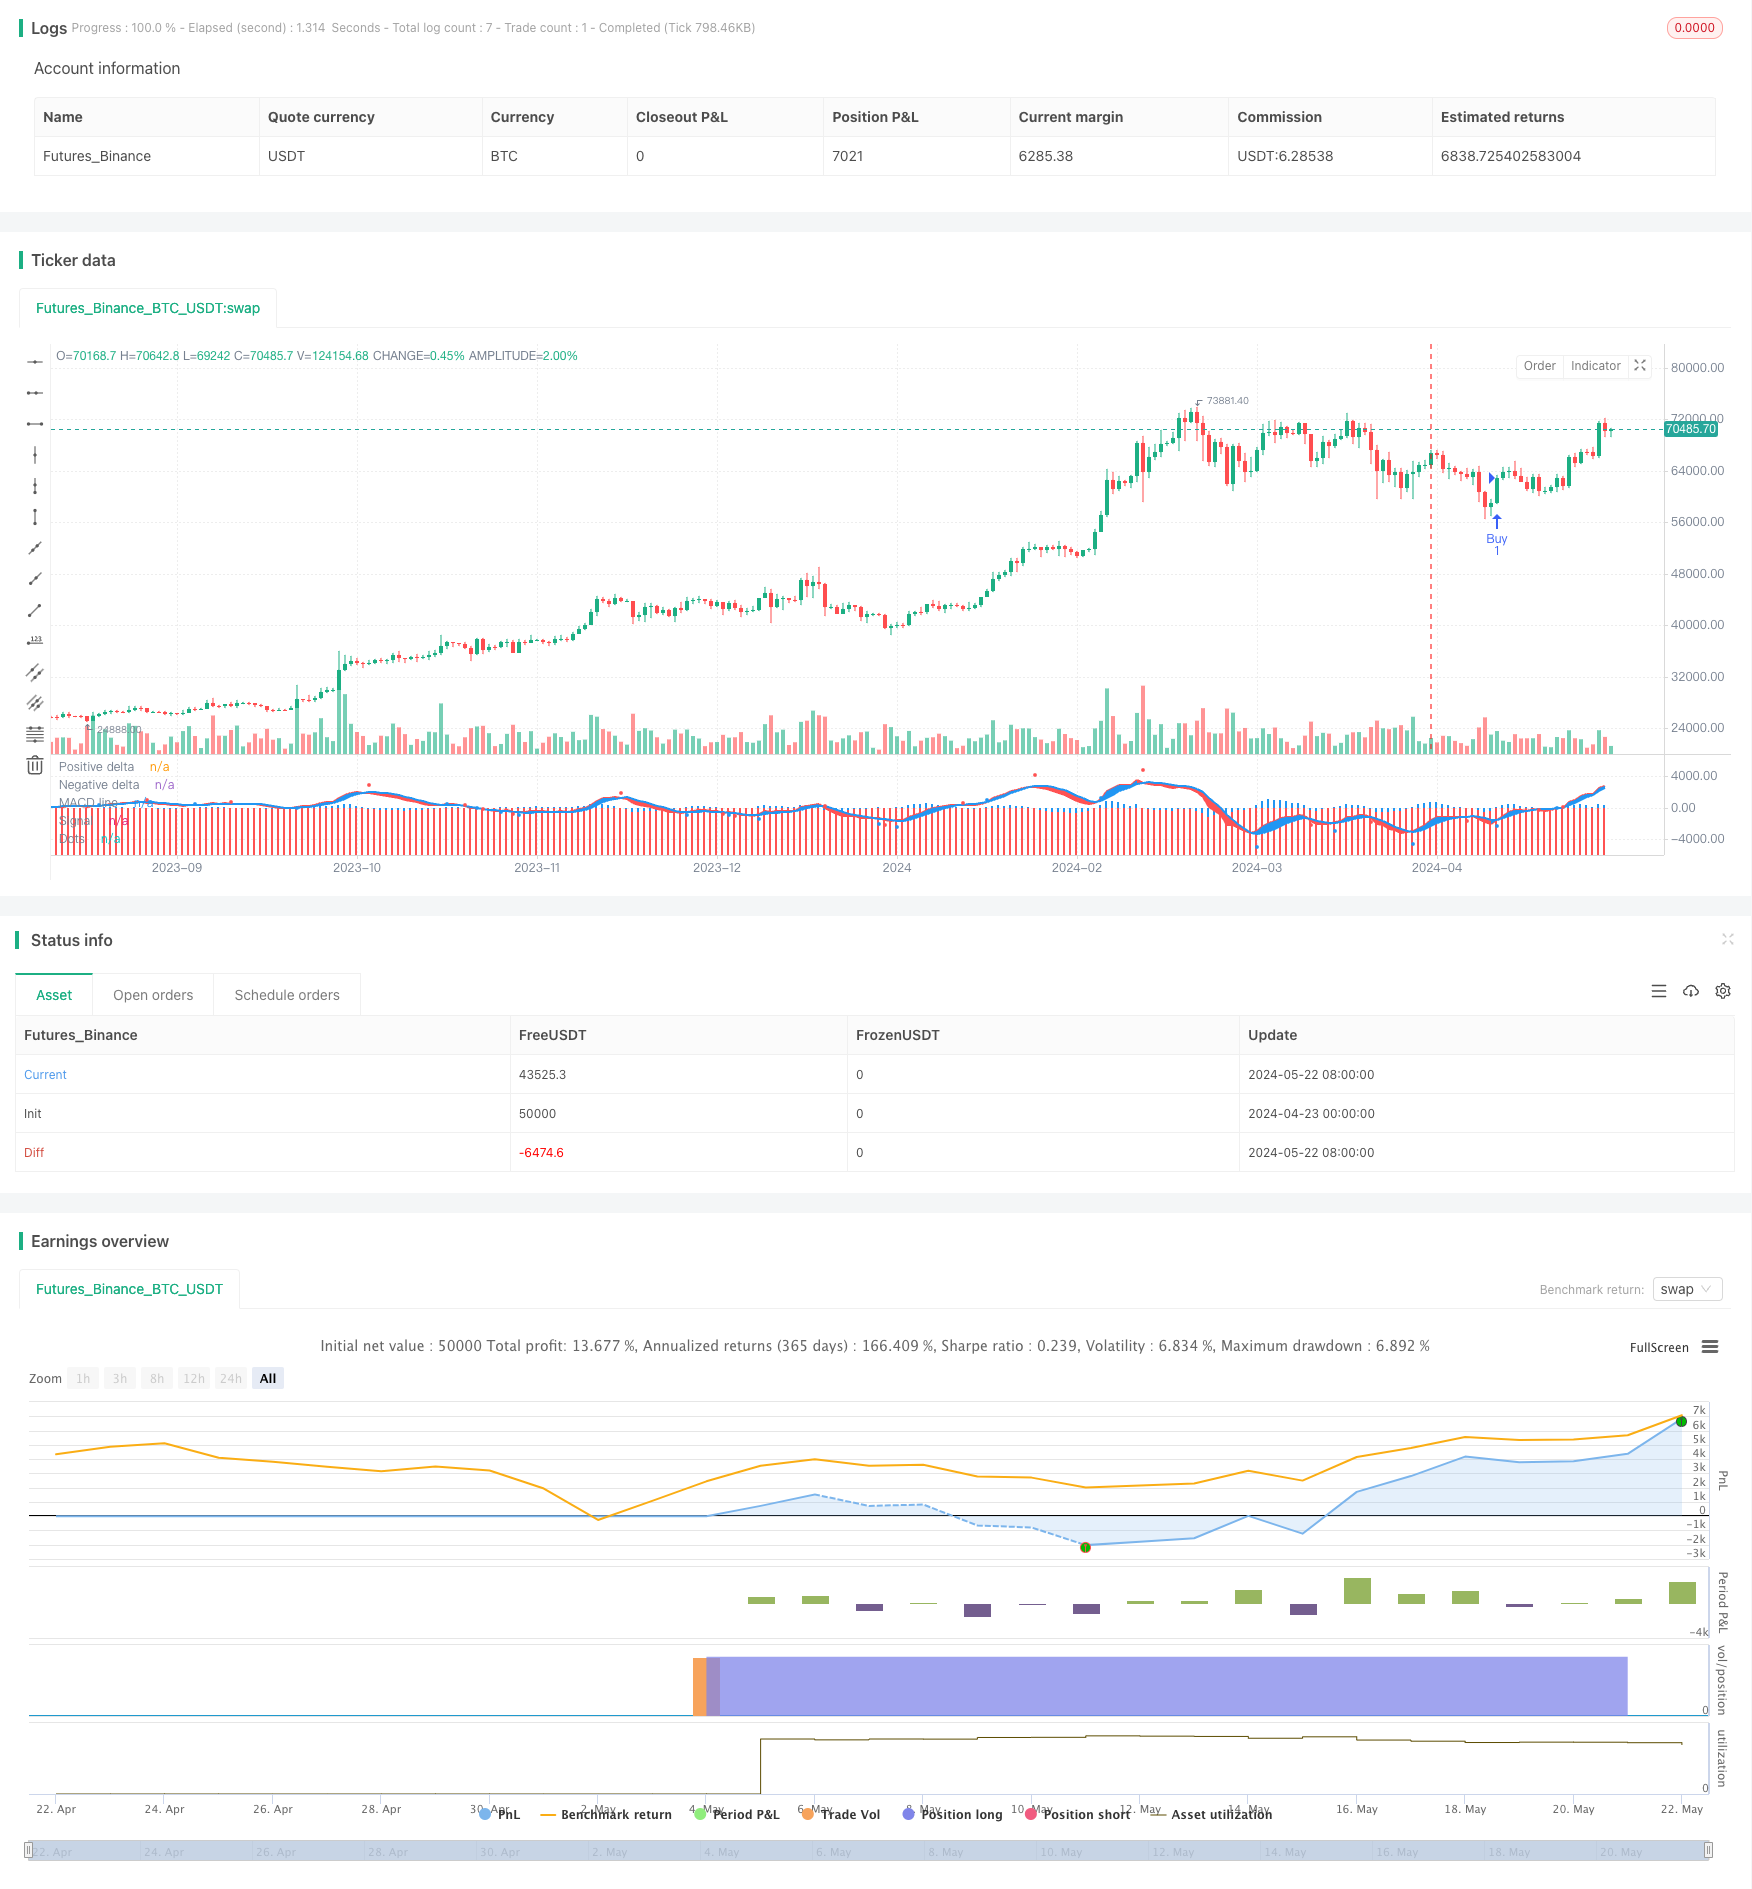
[trans]
概述
该策略基于MACD(移动平均线聚散)指标的零滞后版本,通过快速响应价格变化,捕捉短期趋势,实现高频交易。策略使用两条不同周期的移动平均线(快线和慢线)构建MACD指标,并引入零滞后算法,消除指标与价格的延迟,提高信号的及时性。同时,使用信号线与MACD线的交叉作为买卖信号,并设置警报,方便交易者及时把握交易机会。
策略原理
- 计算快线(默认12周期)和慢线(默认26周期)的EMA(指数移动平均线)或SMA(简单移动平均线)。
- 使用零滞后算法对快线和慢线进行二次平滑,消除指标与价格的延迟。
- MACD线由零滞后快线与零滞后慢线的差值构成。
- 信号线由MACD线的EMA(默认9周期)或SMA构成。
- MACD柱状图由MACD线与信号线的差值构成,用蓝色表示正值,红色表示负值。
- 当MACD线从下向上穿过信号线,且穿越点位于零轴以下时,产生买入信号(蓝点)。
- 当MACD线从上向下穿过信号线,且穿越点位于零轴以上时,产生卖出信号(红点)。
- 策略根据买卖信号自动下单,并触发相应的警报。
优势分析
- 零滞后算法有效消除了指标与价格的延迟,提高了信号的及时性和准确性。
- 双重移动平均线的设计可以更好地捕捉市场趋势,适应不同的市场环境。
- MACD柱状图直观反映了多空力量对比,辅助交易决策。
- 自动下单和警报功能方便交易者及时把握交易机会,提高交易效率。
风险分析
- 在震荡市场中,频繁的交叉信号可能导致过度交易和损失。
- 参数设置不当可能导致信号失真,影响策略表现。
- 策略依赖历史数据进行计算,对突发事件和黑天鹅事件的适应性较差。
优化方向
- 引入趋势确认指标,如ADX等,过滤震荡市场中的虚假信号。
- 对参数进行优化,找到最佳的快慢线周期和信号线周期组合,提高策略稳定性。
- 结合其他技术指标或基本面因素,构建多因子模型,提高策略的风险调整后收益。
- 引入止损和止盈机制,控制单笔交易风险。
总结
MACD双转换零滞后交易策略通过快速响应价格变化,捕捉短期趋势,实现高频交易。零滞后算法和双重移动平均线的设计提高了信号的及时性和准确性。策略具有一定的优势,如信号直观、操作便捷等,但同时也存在过度交易、参数敏感等风险。未来可以通过引入趋势确认指标、参数优化、多因子模型等方式对策略进行优化,提高策略的稳健性和收益水平。
||
Overview
This strategy is based on the zero-lag version of the MACD (Moving Average Convergence Divergence) indicator, which captures short-term trends by quickly responding to price changes, enabling high-frequency trading. The strategy uses two moving averages with different periods (fast and slow lines) to construct the MACD indicator and introduces a zero-lag algorithm to eliminate the delay between the indicator and the price, improving the timeliness of signals. Additionally, the crossover of the signal line and the MACD line is used as buy and sell signals, and alerts are set up to help traders seize trading opportunities in a timely manner.
Strategy Principle
- Calculate the EMA (Exponential Moving Average) or SMA (Simple Moving Average) of the fast line (default 12 periods) and slow line (default 26 periods).
- Use the zero-lag algorithm to double-smooth the fast and slow lines, eliminating the delay between the indicator and the price.
- The MACD line is formed by the difference between the zero-lag fast line and the zero-lag slow line.
- The signal line is formed by the EMA (default 9 periods) or SMA of the MACD line.
- The MACD histogram is formed by the difference between the MACD line and the signal line, with blue representing positive values and red representing negative values.
- When the MACD line crosses the signal line from below and the crossover point is below the zero axis, a buy signal (blue dot) is generated.
- When the MACD line crosses the signal line from above and the crossover point is above the zero axis, a sell signal (red dot) is generated.
- The strategy automatically places orders based on the buy and sell signals and triggers corresponding alerts.
Advantage Analysis
- The zero-lag algorithm effectively eliminates the delay between the indicator and the price, improving the timeliness and accuracy of signals.
- The design of dual moving averages can better capture market trends and adapt to different market environments.
- The MACD histogram intuitively reflects the comparison of bullish and bearish forces, assisting in trading decisions.
- The automatic order placement and alert functions make it convenient for traders to seize trading opportunities in a timely manner, improving trading efficiency.
Risk Analysis
- In volatile markets, frequent crossover signals may lead to overtrading and losses.
- Improper parameter settings may cause signal distortion and affect strategy performance.
- The strategy relies on historical data for calculations and has poor adaptability to sudden events and black swan events.
Optimization Direction
- Introduce trend confirmation indicators, such as ADX, to filter out false signals in volatile markets.
- Optimize parameters to find the best combination of fast and slow line periods and signal line periods, improving strategy stability.
- Combine other technical indicators or fundamental factors to construct a multi-factor model, improving risk-adjusted returns of the strategy.
- Introduce stop-loss and take-profit mechanisms to control single-trade risk.
Summary
The MACD Dual Crossover Zero Lag Trading Strategy achieves high-frequency trading by quickly responding to price changes and capturing short-term trends. The zero-lag algorithm and dual moving average design improve the timeliness and accuracy of signals. The strategy has certain advantages, such as intuitive signals and convenient operation, but also faces risks such as overtrading and parameter sensitivity. In the future, the strategy can be optimized by introducing trend confirmation indicators, parameter optimization, multi-factor models, etc., to improve the robustness and profitability of the strategy. [/trans]
Source (PineScript)
/*backtest
start: 2024-04-23 00:00:00
end: 2024-05-23 00:00:00
period: 1d
basePeriod: 1h
exchanges: [{"eid":"Futures_Binance","currency":"BTC_USDT"}]
*/

//@version=4
strategy("BNM INTRADAY SETUP MACD 3M - Version 1.2", shorttitle="Zero Lag MACD Enhanced 1.2")
source = close

fastLength = input(12, title="Fast MM period", minval=1)
slowLength = input(26,title="Slow MM period", minval=1)
signalLength =input(9,title="Signal MM period", minval=1)
useEma = input(true, title="Use EMA (otherwise SMA)")
useOldAlgo = input(false, title="Use Glaz algo (otherwise 'real' original zero lag)")
showDots = input(true, title="Show symbols to indicate crossing")
dotsDistance = input(1.5, title="Symbols distance factor", minval=0.1)

// Fast line
ma1 = useEma ? ema(source, fastLength) : sma(source, fastLength)
ma2 = useEma ? ema(ma1, fastLength) : sma(ma1, fastLength)
zerolagEMA = ((2 * ma1) - ma2)

// Slow line
mas1 = useEma ? ema(source, slowLength) : sma(source, slowLength)
mas2 = useEma ? ema(mas1, slowLength) : sma(mas1, slowLength)
zerolagslowMA = ((2 * mas1) - mas2)

// MACD line
ZeroLagMACD = zerolagEMA - zerolagslowMA

// Signal line
emasig1 = ema(ZeroLagMACD, signalLength)
emasig2 = ema(emasig1, signalLength)
signal = useOldAlgo ? sma(ZeroLagMACD, signalLength) : (2 * emasig1) - emasig2

hist = ZeroLagMACD - signal

upHist = (hist > 0) ? hist : 0
downHist = (hist <= 0) ? hist : 0

p1 = plot(upHist, color=color.blue, transp=40, style=plot.style_columns, title='Positive delta')
p2 = plot(downHist, color=color.red, transp=40, style=plot.style_columns, title='Negative delta')

zeroLine = plot(ZeroLagMACD, color=color.red, transp=0, linewidth=2, title='MACD line')
signalLine = plot(signal, color=color.blue, transp=0, linewidth=2, title='Signal')

ribbonDiff = hist > 0 ? color.blue : color.red
fill(zeroLine, signalLine, color=ribbonDiff)

circleYPosition = signal * dotsDistance
ribbonDiff2 = hist > 0 ? color.blue : color.red

// Generate dots for cross signals
plot(showDots and cross(ZeroLagMACD, signal) ? circleYPosition : na, style=plot.style_circles, linewidth=4, color=ribbonDiff2, title='Dots')

// Alerts for buy and sell signals
buySignal = cross(ZeroLagMACD, signal) and (ribbonDiff2 == color.blue) and (ZeroLagMACD < 0)
sellSignal = cross(ZeroLagMACD, signal) and (ribbonDiff2 == color.red) and (ZeroLagMACD > 0)

// Use 'strategy.entry' for placing orders in strategy context
if (buySignal)
    strategy.entry("Buy", strategy.long)
    alert("Buy Signal: Blue dot below zero line", alert.freq_once_per_bar_close)

if (sellSignal)
    strategy.entry("Sell", strategy.short)
    alert("Sell Signal: Red dot above zero line", alert.freq_once_per_bar_close)
Detail
https://www.fmz.com/strategy/452365
Last Modified
2024-05-24 18:14:37