
6.1 KiB
Name
MACD动量策略MACD-Momentum-Strategy
Author
ChaoZhang
Strategy Description
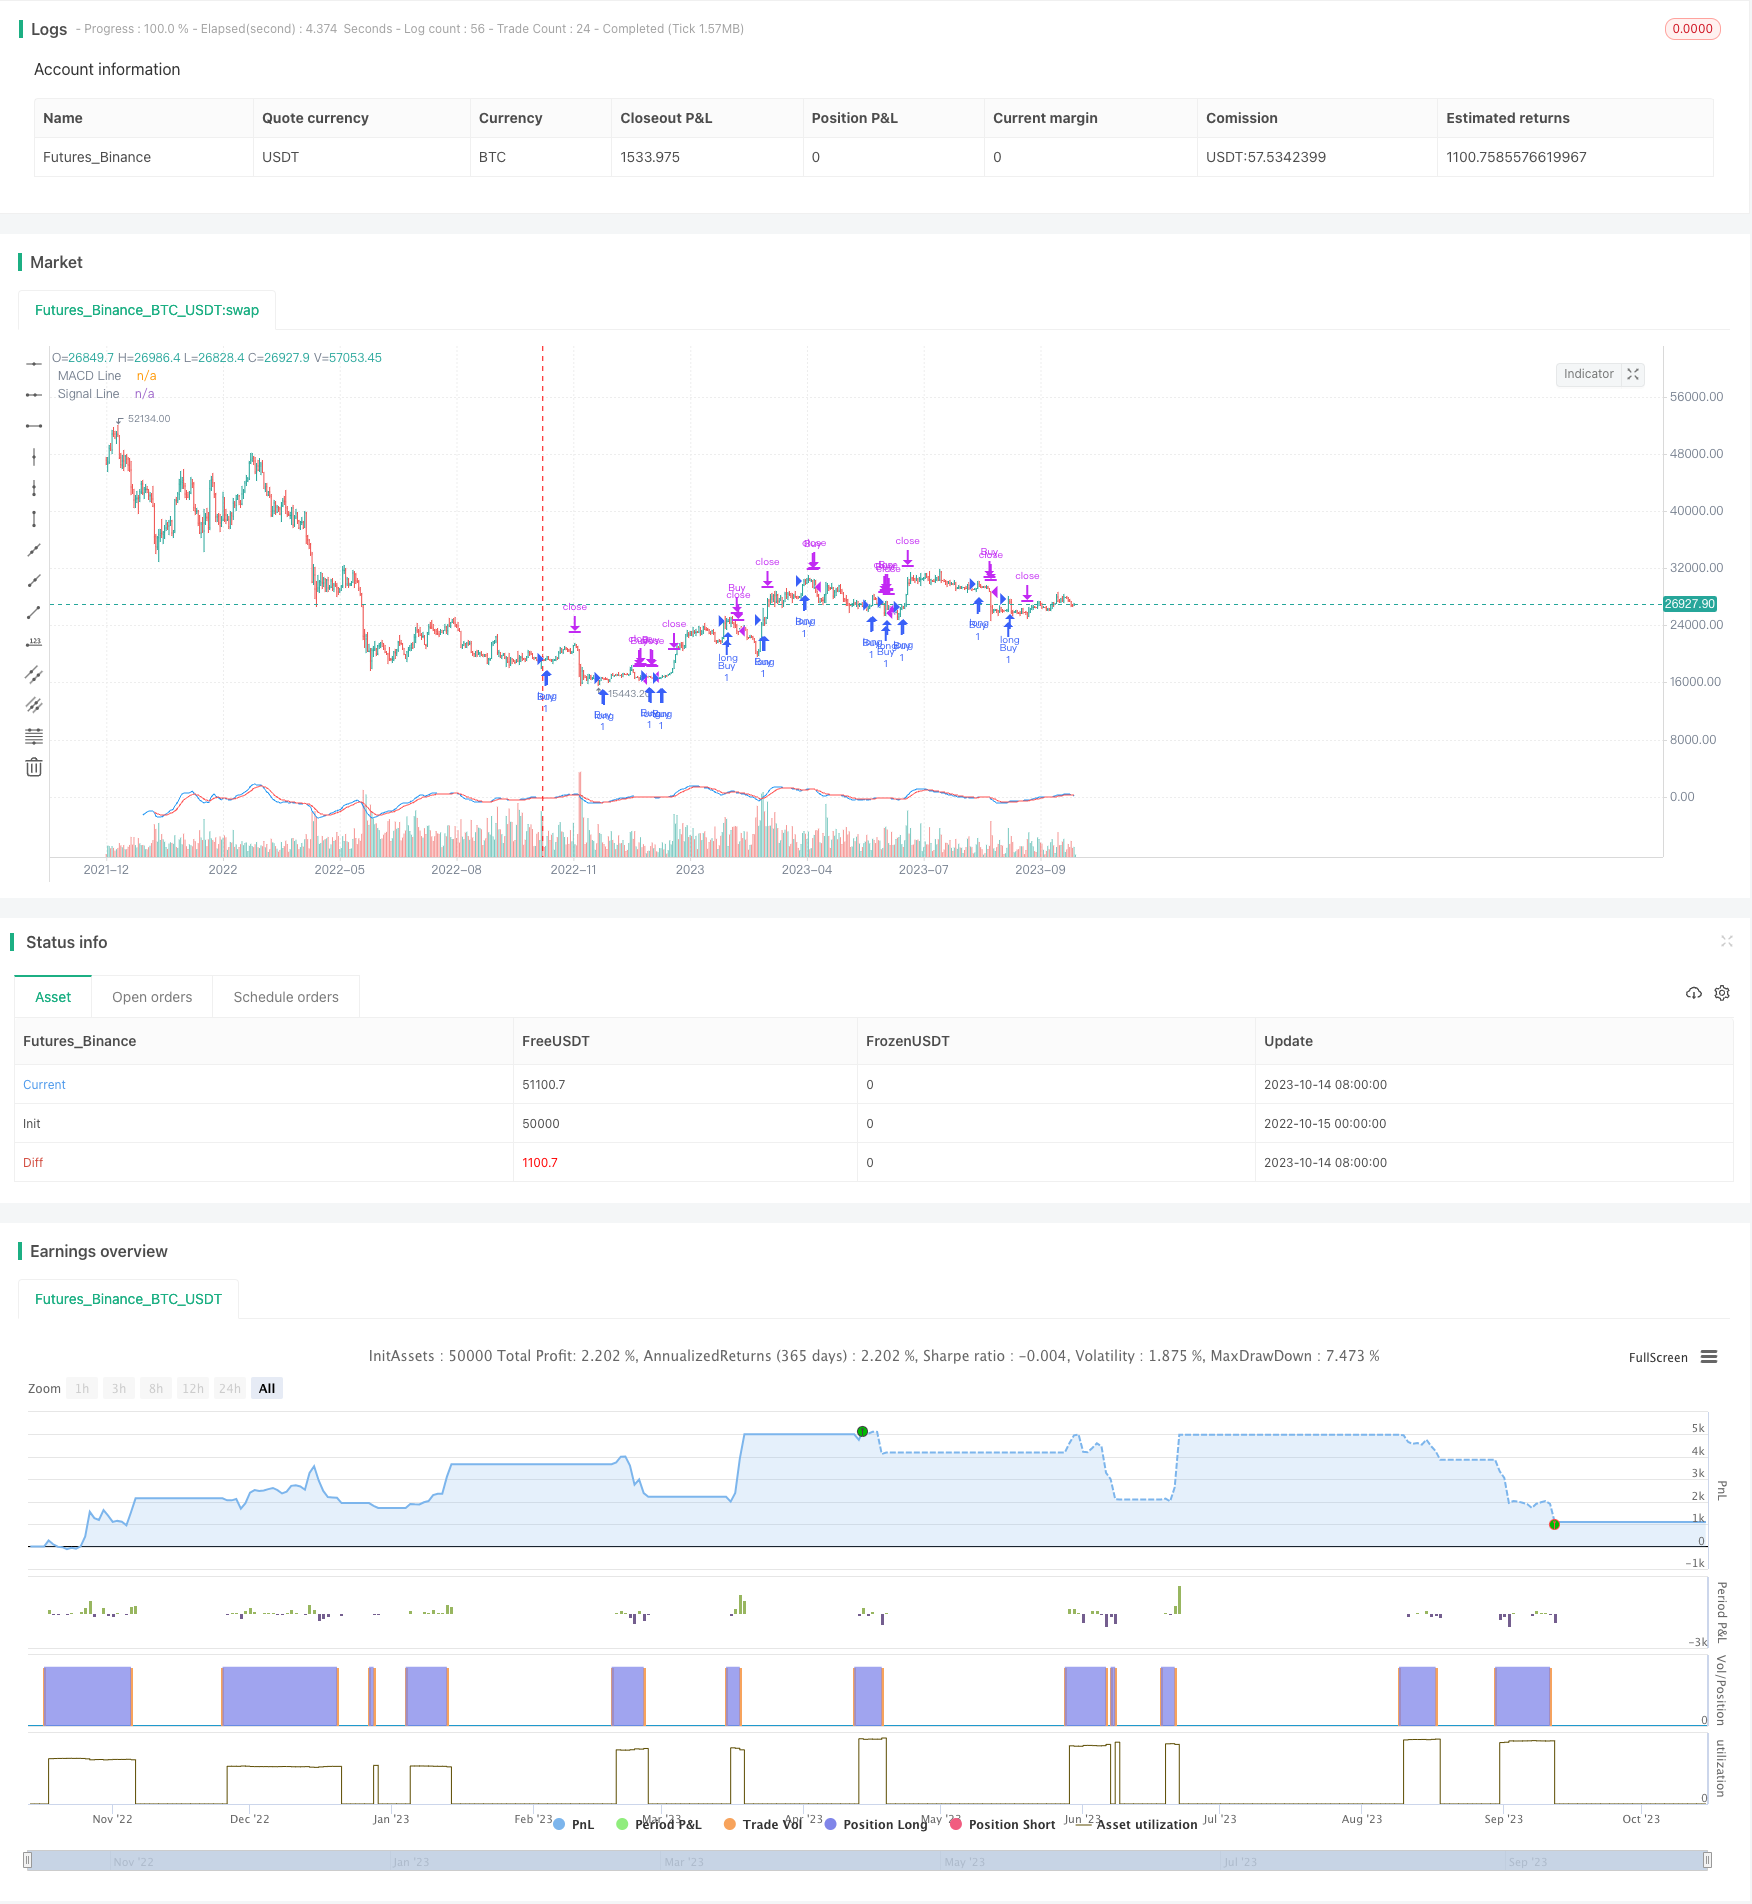
[trans]
概述
MACD动量策略是一个基于MACD指标的短期追踪趋势策略。它利用MACD线和信号线的金叉和死叉来判断价格趋势的变化,以捕捉短期价格动量。该策略的优点是操作简单,可以有效跟踪短期趋势;缺点是容易造成过度交易。总体来说,MACD动量策略适用于追求短线获利的活跃交易者。
策略原理
该策略使用MACD指标的MACD线和信号线,以及最高价和最低价来制定入场、止损、止盈标准。
具体来说,当MACD线上穿信号线时产生 golden cross,视为买入信号,做多;当MACD线下穿信号线时产生 dead cross,视为卖出信号,平仓。
止损标准设定为最近一个bar的最低价,止盈标准设定为最近3个bar的最高价。
优势分析
- 利用MACD指标判断短期价格动能,可以有效捕捉短线趋势
- 采用金叉和死叉来发出交易信号,简单易懂
- 设置止损和止盈标准有利于风险控制
- 无需其他指标或过滤器,策略简单清晰
风险分析
- MACD指标容易产生误信号,可能导致过度交易
- 短期操作易受突发事件影响,存在一定的非理性风险
- 止损范围较大,可能导致损失放大
- 只追踪短期趋势,长期盈利能力有限
可以通过调整MACD参数、添加过滤条件、缩小止损范围等方法来优化和改进。
优化方向
- 调整MACD参数,寻找更合适的组合
- 增加过滤条件,避免误信号,如布林线、K线形态等
- 优化止损机制,例如追踪止损、分批止损
- 增加趋势判断,避免逆势交易
- 结合其他指标,如RSI、KD等形成组合策略
- 调整仓位管理,优化资金利用效率
总结
MACD动量策略是一个简单的短期追踪趋势策略。它利用MACD指标判断价格动能变化,快速捕捉短线行情,适合追求短期获利的活跃交易者。该策略优点是简单易操作,但也存在过度交易和止损放大风险。通过参数优化、增加过滤器、改进仓位管理等手段,可以强化该策略,进一步控制风险提高盈利空间。总体来说,MACD动量策略提供了一个基本的短期趋势跟踪思路,是量化交易的一个很好的入门策略选择。
||
Overview
The MACD Momentum Strategy is a short-term trend tracking strategy based on the MACD indicator. It utilizes MACD line and signal line crossovers to determine trend changes and capture short-term price momentum. The advantages of this strategy are its simple operation and effectiveness in tracking short-term trends. The disadvantages are frequent trading and overoptimization. Overall, the MACD Momentum Strategy suits active traders looking for short-term profits.
Strategy Logic
The strategy employs the MACD line, signal line of the MACD indicator, as well as highest and lowest prices to formulate entry, stop loss and take profit criteria.
Specifically, when the MACD line crosses above the signal line, a golden cross is formed, indicating a buy signal to go long. When the MACD line crosses below the signal line, a dead cross is formed, indicating a sell signal to close position.
The stop loss is set at the lowest price of the most recent bar, and take profit is set at the highest price of the recent 3 bars.
Advantage Analysis
- Utilize MACD indicator to judge short-term price momentum, effectively catching short-term trends
- Using golden cross and dead cross to generate trade signals, simple and intuitive
- Stop loss and take profit settings help control risks
- No need for other indicators or filters, simple and clear strategy
Risk Analysis
- MACD indicator prone to generating false signals, may cause overtrading
- Short-term operations susceptible to unexpected events, some irrational risks
- Wide stop loss range may amplify losses
- Only catching short-term trends, limited long-term profitability
Optimization methods include adjusting MACD parameters, adding filters, reducing stop loss range.
Optimization Directions
- Adjust MACD parameters to find optimal settings
- Add filters to avoid false signals, e.g. Bollinger Bands, candlestick patterns
- Optimize stop loss mechanisms, e.g. trailing stop loss, staggered stop loss
- Add trend judgment to avoid counter trend trades
- Combine other indicators like RSI, KD to form combo strategies
- Adjust position sizing to optimize capital utilization
Summary
The MACD Momentum Strategy is a simple short-term trend tracking strategy. It uses MACD indicator to determine price momentum changes and quickly captures short-term trends, suitable for active traders seeking short-term profits. The advantages are its simplicity and intuitive operations, but it also carries risks of overtrading and amplified losses from wide stop loss. The strategy can be enhanced through parameter tuning, adding filters, improving position sizing to further control risks and expand profitability. Overall, the MACD Momentum Strategy provides a basic short-term trend following framework and is a great starting point for algorithmic trading.
[/trans]
Source (PineScript)
/*backtest
start: 2022-10-15 00:00:00
end: 2023-10-15 00:00:00
period: 1d
basePeriod: 1h
exchanges: [{"eid":"Futures_Binance","currency":"BTC_USDT"}]
*/

//@version=5
strategy("MACD Momentum Strategy", overlay=true)

// MACD settings
[macdLine, signalLine, _] = ta.macd(close, 12, 26, 9)

// Entry criteria
enterLong = ta.crossover(macdLine, signalLine)

// Exit criteria
exitLong = ta.crossunder(macdLine, signalLine)

// Calculate stop-loss and take-profit levels
stopLossLevel = ta.lowest(low, 1)
takeProfitLevel = ta.highest(high, 3)

// Execute the strategy
if (enterLong)
    strategy.entry("Buy", strategy.long)

if (exitLong)
    strategy.close("Buy")

strategy.exit("Take Profit/Stop Loss", "Buy", loss=stopLossLevel, profit=takeProfitLevel)

// Plot the MACD and signal line
plot(macdLine, color=color.blue, title="MACD Line")
plot(signalLine, color=color.red, title="Signal Line")
Detail
https://www.fmz.com/strategy/429385
Last Modified
2023-10-16 15:57:34