
10 KiB
Name
MACD与RR比率日内限制收敛策略-MACD-Convergence-Strategy-with-RR-Daily-Limits-and-Tighter-Stop-Loss
Author
ChaoZhang
Strategy Description
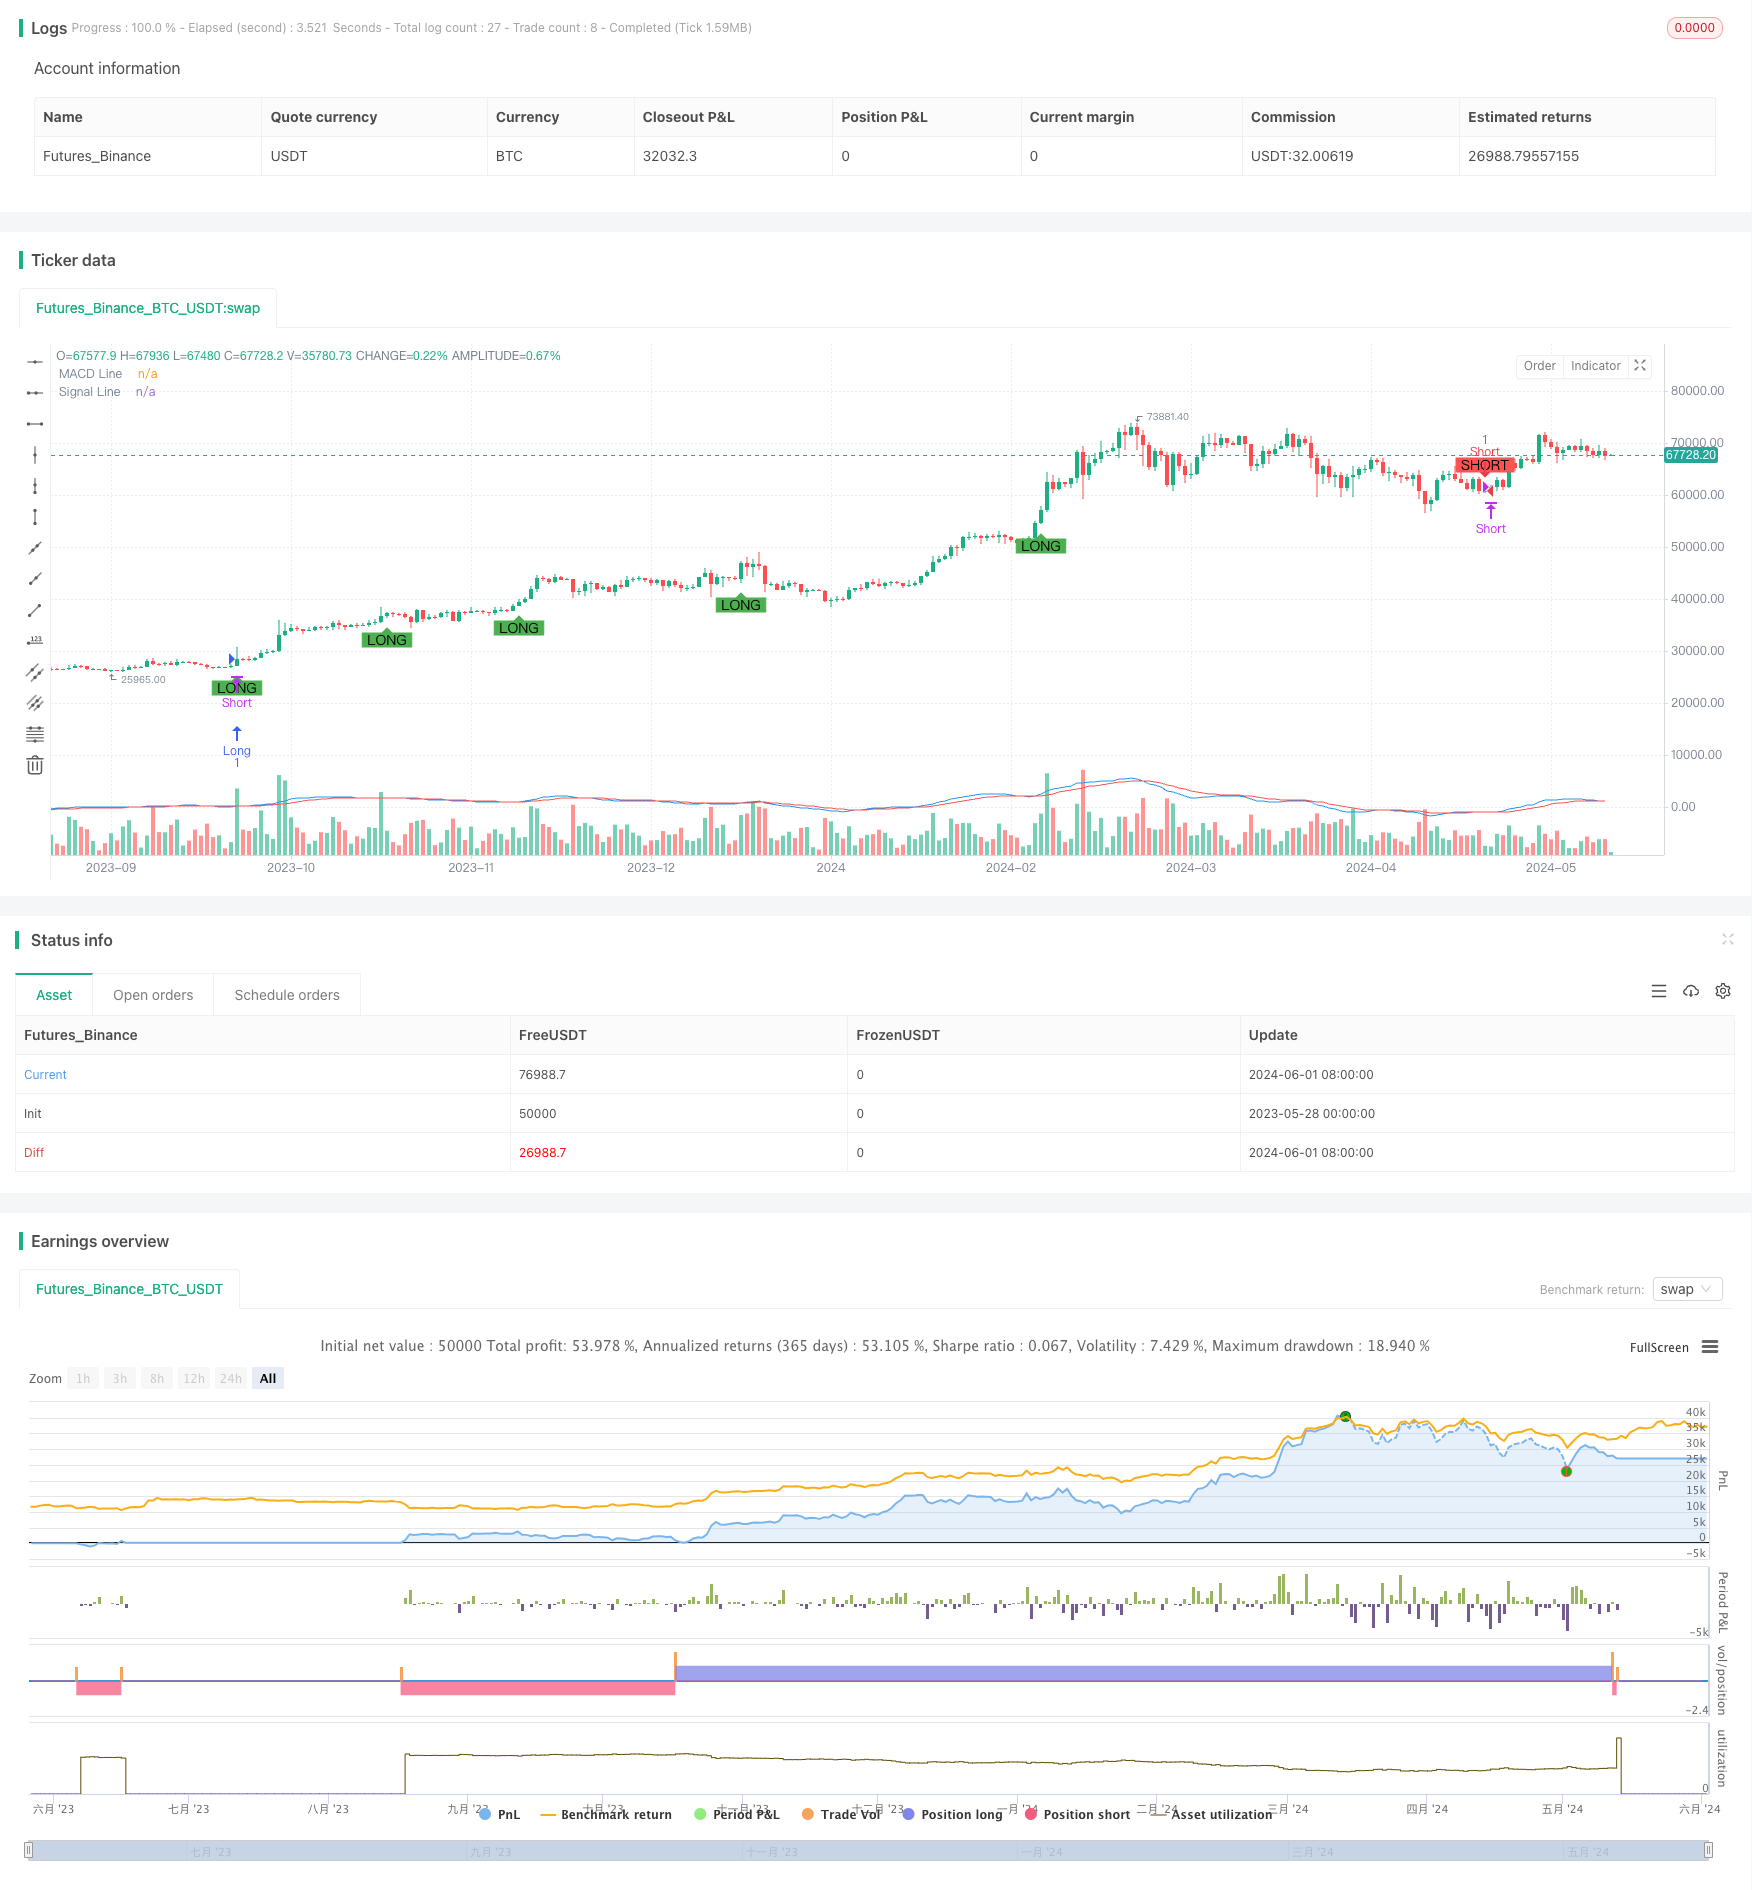
[trans]
概述
该策略基于MACD指标的收敛与发散来判断交易信号。当MACD线与信号线出现交叉,且MACD线的值大于1.5或小于-1.5时,分别产生做多和做空信号。同时,策略设置了固定的止盈止损点位,并引入了风险回报比(R:R)的概念。此外,该策略还采用了日内最大亏损和最大盈利限制,以及更严格的移动止损措施,以更好地控制风险。
策略原理
- 计算MACD指标的MACD线和信号线。
- 判断MACD线与信号线的交叉情况,同时考虑MACD线的值是否超过一定阈值(1.5和-1.5)。
- 当出现做多信号时,开仓做多,设置止盈价格为当前最高价+600个最小变动单位,止损价格为当前最低价-100个最小变动单位。
- 当出现做空信号时,开仓做空,设置止盈价格为当前最低价-600个最小变动单位,止损价格为当前最高价+100个最小变动单位。
- 引入移动止损逻辑,当价格相对开仓价格上涨(多头)或下跌(空头)超过300个最小变动单位时,将止损价格移动到开仓价格+(收盘价-开仓价格-300)(多头)或开仓价格-(开仓价格-收盘价格-300)(空头)。
- 设置日内最大亏损和最大盈利限制,当当日亏损达到600个最小变动单位或盈利达到1800个最小变动单位时,平掉所有仓位。
优势分析
- 结合MACD指标与价格阈值条件,有效过滤掉部分噪声信号。
- 固定风险回报比(R:R),每笔交易风险收益可控。
- 移动止损逻辑可以在趋势形成后保护利润,减少回撤。
- 日内最大亏损和盈利限制有助于控制单日风险敞口,避免过度亏损或盈利后回撤。
风险分析
- MACD指标存在滞后性,可能出现信号延迟或错误信号。
- 固定止盈止损点位可能无法适应不同市场状况,在震荡行情中可能频繁触发止损。
- 移动止损逻辑在趋势反转时可能无法及时止损,导致利润回吐。
- 日内最大亏损和盈利限制可能导致策略在单日行情趋势明确时过早平仓,错失潜在利润。
优化方向
- 考虑使用多时间框架的MACD指标来确认信号,提高信号准确性。
- 根据市场波动性动态调整止盈止损点位,以适应不同市场状况。
- 优化移动止损逻辑,如根据ATR指标来设置移动止损距离,更好地适应价格波动。
- 对日内最大亏损和盈利限制进行参数优化,找到合适的限制值,在控制风险的同时尽量捕捉趋势行情。
总结
该策略通过MACD指标的收敛与发散来判断交易信号,同时引入了风险回报比、移动止损和日内限制等风险控制措施。虽然策略在一定程度上能够捕捉趋势行情并控制风险,但仍存在一些优化和改进的空间。未来可以考虑从信号确认、止盈止损、移动止损和日内限制等维度进行优化,以期获得更稳健和可观的回报。
||
Overview
This strategy uses the convergence and divergence of the MACD indicator to generate trading signals. When the MACD line crosses the signal line, and the value of the MACD line is greater than 1.5 or less than -1.5, it generates long and short signals, respectively. The strategy sets fixed take-profit and stop-loss levels and introduces the concept of risk-reward ratio (R:R). Additionally, it employs daily maximum loss and profit limits and a tighter trailing stop-loss to better control risks.
Strategy Principle
- Calculate the MACD line and signal line of the MACD indicator.
- Determine the crossover situations between the MACD line and signal line, while considering whether the value of the MACD line exceeds certain thresholds (1.5 and -1.5).
- When a long signal appears, open a long position with a take-profit price of the current highest price + 600 minimum tick units and a stop-loss price of the current lowest price - 100 minimum tick units.
- When a short signal appears, open a short position with a take-profit price of the current lowest price - 600 minimum tick units and a stop-loss price of the current highest price + 100 minimum tick units.
- Introduce a trailing stop-loss logic: when the price rises (long position) or falls (short position) more than 300 minimum tick units relative to the entry price, move the stop-loss price to the entry price + (close price - entry price - 300) for long positions or entry price - (entry price - close price - 300) for short positions.
- Set daily maximum loss and profit limits: when the daily loss reaches 600 minimum tick units or the profit reaches 1800 minimum tick units, close all positions.
Advantage Analysis
- Combining the MACD indicator with price threshold conditions effectively filters out some noise signals.
- Fixed risk-reward ratio (R:R) makes the risk and reward of each trade controllable.
- The trailing stop-loss logic protects profits after a trend forms and reduces drawdowns.
- Daily maximum loss and profit limits help control daily risk exposure and avoid excessive losses or profits followed by drawdowns.
Risk Analysis
- The MACD indicator has a lag effect, which may result in delayed or false signals.
- Fixed take-profit and stop-loss levels may not adapt to different market conditions and could be frequently triggered in choppy markets.
- The trailing stop-loss logic may fail to stop losses in time during trend reversals, leading to profit givebacks.
- Daily maximum loss and profit limits may cause the strategy to close positions prematurely when the daily trend is clear, missing potential profits.
Optimization Direction
- Consider using multi-timeframe MACD indicators to confirm signals and improve signal accuracy.
- Dynamically adjust take-profit and stop-loss levels based on market volatility to adapt to different market conditions.
- Optimize the trailing stop-loss logic, such as setting the trailing stop-loss distance based on the ATR indicator for better adaptation to price fluctuations.
- Optimize the parameters of daily maximum loss and profit limits to find appropriate limit values that control risks while capturing trend movements as much as possible.
Summary
This strategy uses the convergence and divergence of the MACD indicator to generate trading signals while introducing risk control measures such as risk-reward ratio, trailing stop-loss, and daily limits. Although the strategy can capture trend movements and control risks to some extent, there is still room for optimization and improvement. In the future, optimization can be considered from aspects such as signal confirmation, take-profit and stop-loss levels, trailing stop-loss, and daily limits to obtain more robust and considerable returns. [/trans]
Source (PineScript)
/*backtest
start: 2023-05-28 00:00:00
end: 2024-06-02 00:00:00
period: 1d
basePeriod: 1h
exchanges: [{"eid":"Futures_Binance","currency":"BTC_USDT"}]
*/

// This Pine Script™ code is subject to the terms of the Mozilla Public License 2.0 at https://mozilla.org/MPL/2.0/
// © DD173838

//@version=5
strategy("MACD Convergence Strategy with R:R, Daily Limits, and Tighter Stop Loss", overlay=true, default_qty_type=strategy.fixed, default_qty_value=1)

// MACD settings
fastLength = input.int(12, title="Fast Length", minval=1)
slowLength = input.int(26, title="Slow Length", minval=1)
signalSmoothing = input.int(9, title="Signal Smoothing", minval=1)
source = input(close, title="Source")

// Calculate MACD
[macdLine, signalLine, _] = ta.macd(source, fastLength, slowLength, signalSmoothing)

// Plot MACD and signal line
plot(macdLine, title="MACD Line", color=color.blue)
plot(signalLine, title="Signal Line", color=color.red)

// Define convergence conditions
macdConvergenceUp = ta.crossover(macdLine, signalLine) and macdLine > 1.5
macdConvergenceDown = ta.crossunder(macdLine, signalLine) and macdLine < -1.5

// Define take profit and stop loss


takeProfit = 600
stopLoss = 100

// Plot buy and sell signals on the chart
plotshape(series=macdConvergenceDown, title="Short Signal", location=location.abovebar, color=color.red, style=shape.labeldown, text="SHORT")
plotshape(series=macdConvergenceUp, title="Long Signal", location=location.belowbar, color=color.green, style=shape.labelup, text="LONG")

// Execute short and long orders with defined take profit and stop loss
if (macdConvergenceDown)
    strategy.entry("Short", strategy.short, qty=1, stop=high + (stopLoss / syminfo.mintick), limit=low - (takeProfit / syminfo.mintick))

if (macdConvergenceUp)
    strategy.entry("Long", strategy.long, qty=1, stop=low - (stopLoss / syminfo.mintick), limit=high + (takeProfit / syminfo.mintick))

// Trailing stop logic
var float entryPrice = na
var float trailingStopPrice = na

if (strategy.position_size != 0)
    entryPrice := strategy.opentrades.entry_price(0)

if (strategy.position_size > 0)  // For long positions
    if (close - entryPrice > 300)
        trailingStopPrice := entryPrice + (close - entryPrice - 300)

if (strategy.position_size < 0)  // For short positions
    if (entryPrice - close > 300)
        trailingStopPrice := entryPrice - (entryPrice - close - 300)

if (strategy.position_size > 0 and not na(trailingStopPrice) and close < trailingStopPrice)
    strategy.close("Long", comment="Trailing Stop")

if (strategy.position_size < 0 and not na(trailingStopPrice) and close > trailingStopPrice)
    strategy.close("Short", comment="Trailing Stop")

// Daily drawdown and profit limits
var float startOfDayEquity = na
if (na(startOfDayEquity) or ta.change(time('D')) != 0)
    startOfDayEquity := strategy.equity

maxDailyLoss = 600
maxDailyProfit = 1800
currentDailyPL = strategy.equity - startOfDayEquity

if (currentDailyPL <= -maxDailyLoss)
    strategy.close_all(comment="Max Daily Loss Reached")

if (currentDailyPL >= maxDailyProfit)
    strategy.close_all(comment="Max Daily Profit Reached")
Detail
https://www.fmz.com/strategy/453278
Last Modified
2024-06-03 16:47:56