
9.7 KiB
Name
Ichimoku云图量化策略Ichimoku-Cloud-Quant-Strategy
Author
ChaoZhang
Strategy Description
 [trans]
概述
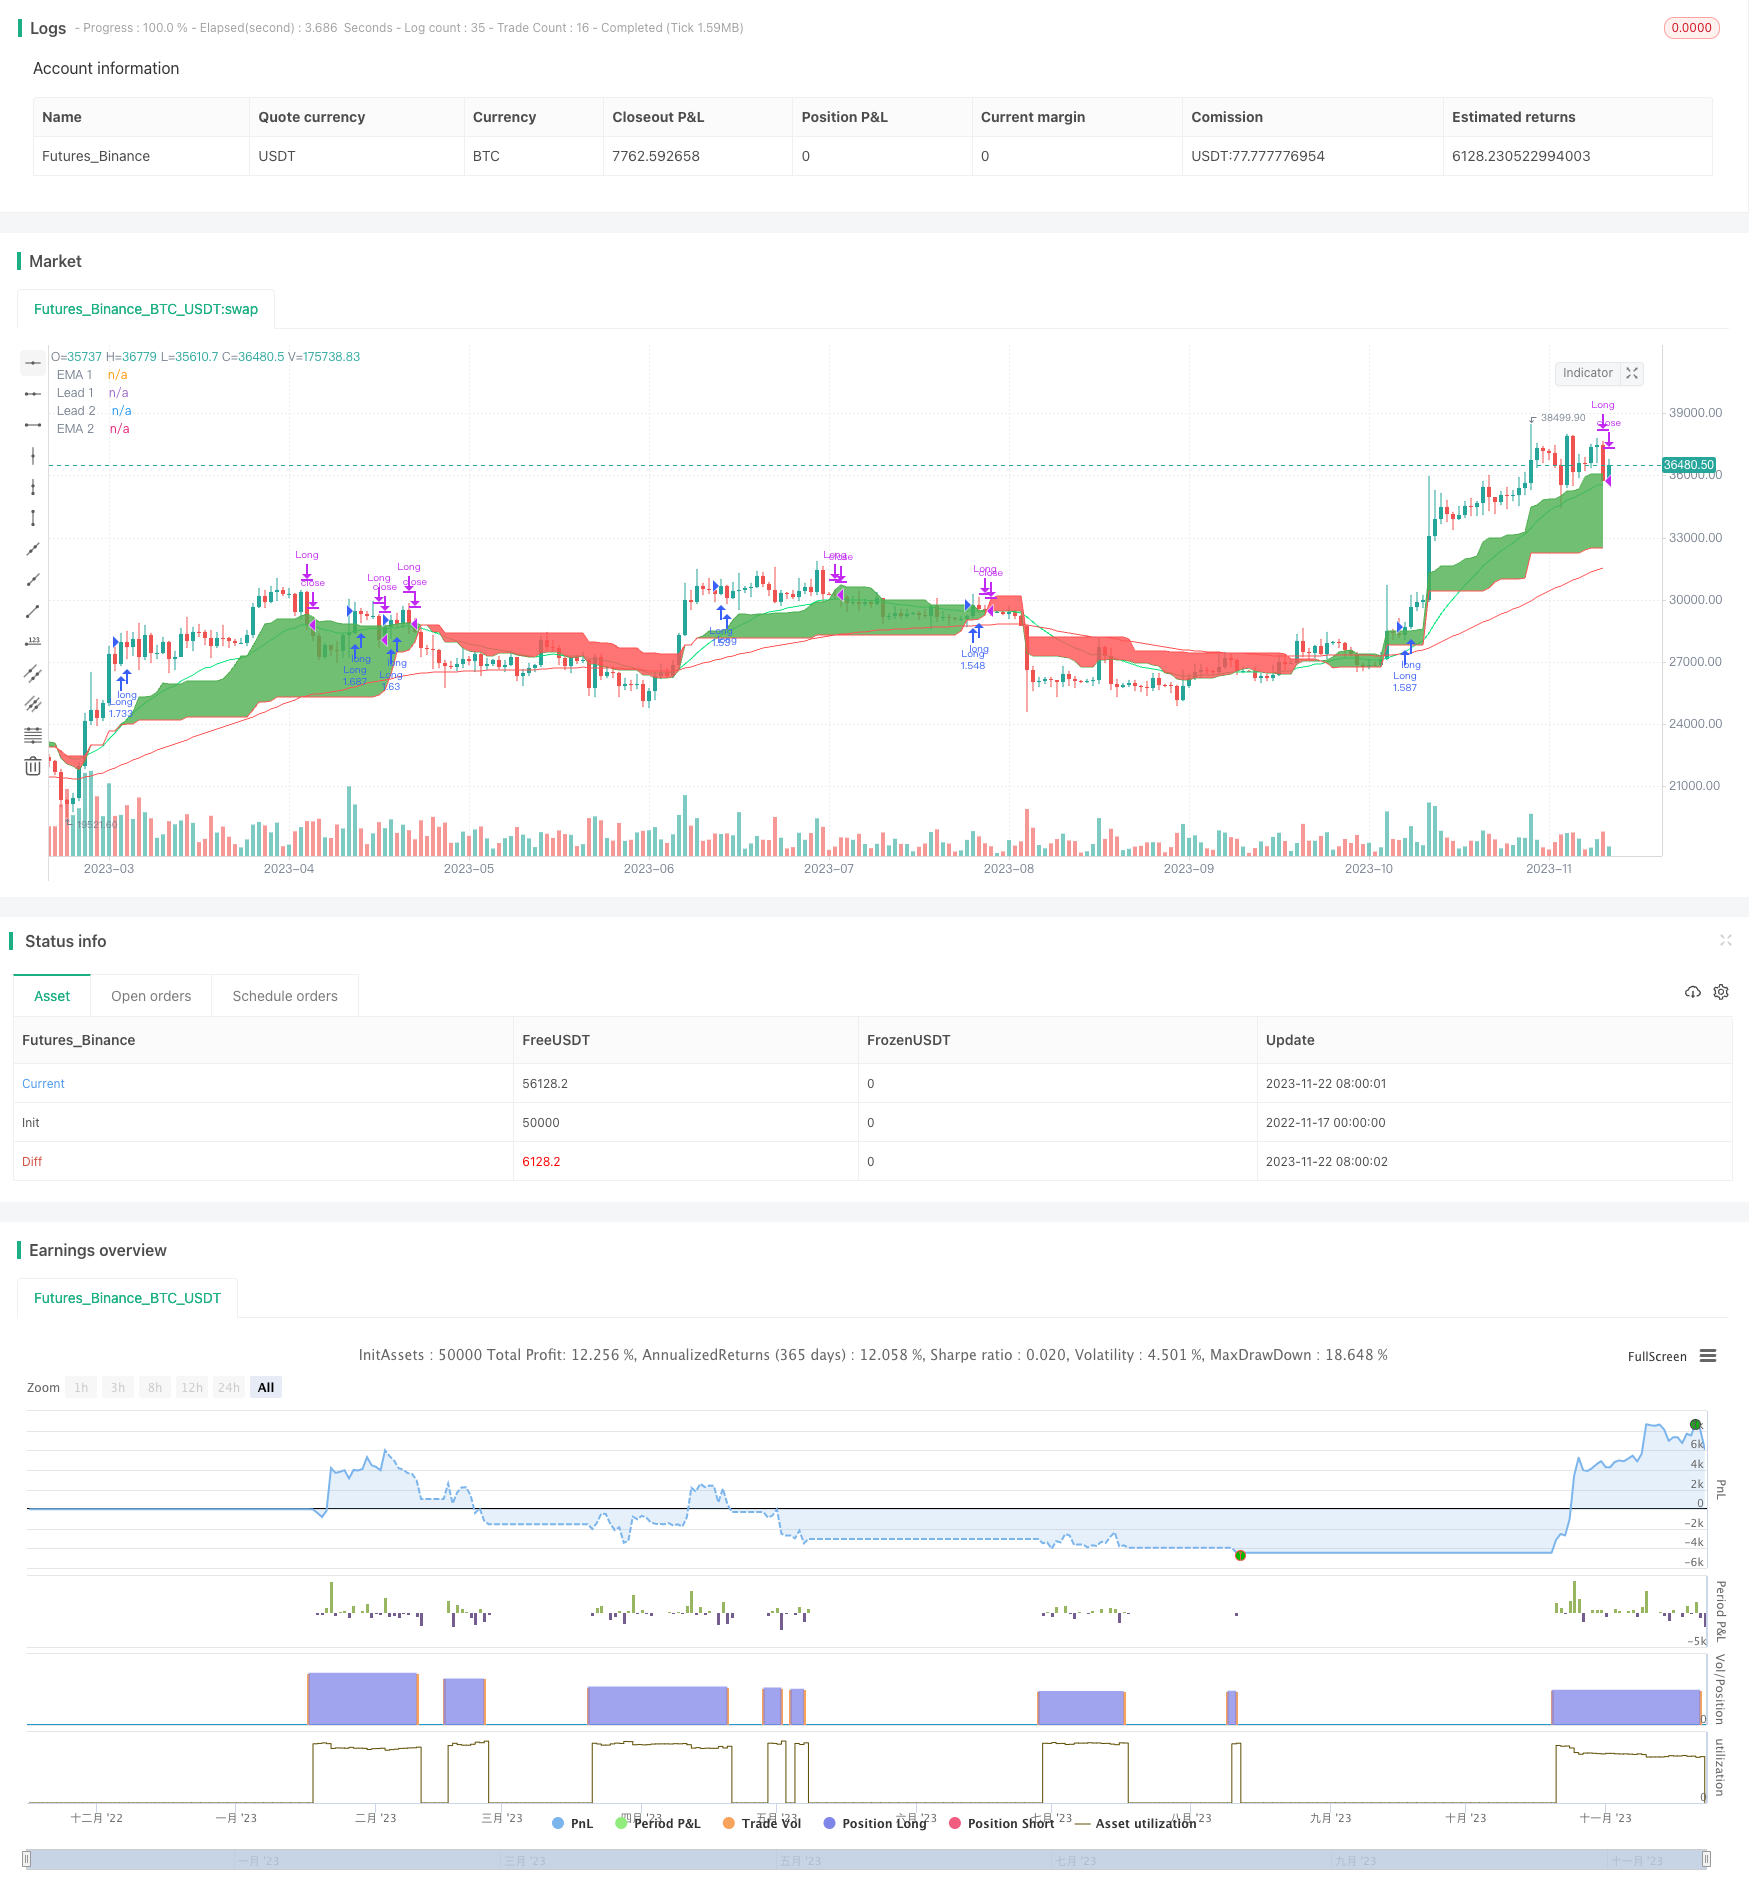
这是一个仅做多的Ichimoku云图量化策略。策略通过Ichimoku指标判断趋势方向,配合K线形态、移动平均线和 Stochastic RSI 指标过滤信号,在趋势向上时选择较好的入场点做多。
策略原理
该策略主要判断标准如下:
- Ichimoku先导线1上穿先导线2,表示趋势转多
- K线收盘价上穿先导线1,符合追踪趋势的条件
- K线为阳线,趋势向上
- 启用移动平均线时,要求快线上穿慢线
- 启用Stochastic RSI时,要求K线上穿D线
当以上条件同时满足时,策略会开仓做多;当价格跌破先导线1时,策略会平仓离场。
该策略主要利用Ichimoku云图判断主趋势方向,再结合辅助指标过滤信号,在趋势向上时选择较好点位入场。
策略优势
- 利用Ichimoku云图判断主趋势,回测表明其判断准确率很高
- 结合多种辅助指标过滤入场点位,可显著提高获利率
- 仅做多策略,适用于判断为多头行情的币种
- 参数优化空间大,可调整指标参数进一步优化
策略风险
- Ichimoku云图判断失败的概率存在,可能误判趋势方向
- 行情突变时止损点可能被突破,导致亏损扩大
- 针对多头行情设计,不适合行情暗藏转势迹象的币种
- 参数设置不当可能导致过于激进入场或过于保守
对策:
- 结合更多指标判断趋势,提高判断准确率
- 设置合理止损点,严格控制单笔亏损
- 根据不同币种行情选择适用策略
- 仔细测试与优化参数,使策略更稳定
策略优化方向
- 优化辅助指标参数设置,进一步提高策略稳定性
- 增加止损机制,例如追踪止损、指数移动平均线止损等
- 增加仓位管理,例如固定仓位、仓位平均等
- 针对具体币种进行参数调整优化
总结
该Ichimoku云图量化策略通过判断趋势方向,实现高胜率且风险可控的仅多头做单策略。策略优势明显,在多头行情中效果突出。下一步可从指标优化、止损机制、仓位管理等方面进行改进,使策略更加完善稳定。 ||
Overview
This is a long-only Ichimoku cloud quant strategy. The strategy judges the trend direction through the Ichimoku indicator, combined with K-line patterns, moving averages and the Stochastic RSI indicator to filter signals and go long at better entry points when the trend goes up.
Strategy Principle
The main judgment criteria of the strategy are:
- Ichimoku lead line 1 crosses above lead line 2, indicating an upward trend
- K-line close price crosses above lead line 1, meeting the condition to follow the trend
- K-line is a green candle, the trend goes up
- When moving averages are enabled, fast MA crosses above slow MA
- When Stochastic RSI is enabled, %K line crosses above %D line
When all the above conditions are met at the same time, the strategy will open long positions. When the price drops below lead line 1, the strategy will close positions.
The strategy mainly uses the Ichimoku cloud to determine the main trend direction, combined with auxiliary indicators to filter signals and go long at better points when the trend goes up.
Advantages of the Strategy
- Use Ichimoku cloud to determine main trend, backtest shows high accuracy
- Combined with multiple auxiliary indicators to filter entry points, can significantly improve profit rate
- Long-only strategy, suitable for currencies judged to be in a bull market
- Large space for parameter optimization, can adjust indicator parameters for further optimization
Risks of the Strategy
- There is a probability of Ichimoku cloud judging the trend wrongly
- Stop loss point may be broken during sudden market changes, leading to enlarged losses
- Designed for bull markets, not suitable for currencies with hidden signs of trend reversal
- Improper parameter settings may lead to over-aggressive entries or over-conservative actions
Countermeasures:
- Combine more indicators to judge the trend, improve accuracy
- Set reasonable stop loss points to strictly control single loss
- Select suitable strategies according to market conditions of different currencies
- Carefully test and optimize parameters to make the strategy more stable
Directions for Strategy Optimization
- Optimize parameter settings of auxiliary indicators to further improve stability
- Add stop loss mechanisms such as trailing stop loss, exponential moving average stop loss, etc.
- Add position management like fixed position sizing, position averaging, etc.
- Make parameter adjustments and optimizations for specific currencies
Summary
This Ichimoku cloud quant strategy achieves a high win rate yet risk-controllable only-long strategy by judging trend directions. The advantages of the strategy are obvious and it shows outstanding performance in bull markets. The next step is to improve aspects like indicator optimization, stop loss mechanism, position management to make the strategy more comprehensive and stable.
[/trans]
Strategy Arguments
| Argument | Default | Description |
|---|---|---|
| v_input_1 | true | FromMonth |
| v_input_2 | true | FromDay |
| v_input_3 | 2017 | FromYear |
| v_input_4 | true | ToMonth |
| v_input_5 | true | ToDay |
| v_input_6 | 9999 | ToYear |
| v_input_7 | true | Enable EMA? |
| v_input_8 | false | Enable Stochastik RSI? |
| v_input_9 | 24 | EMA 1 |
| v_input_10 | 90 | EMA 2 |
| v_input_11 | 3 | RSI K Line |
| v_input_12 | 3 | RSI D Line |
| v_input_13 | 14 | RSI Length |
| v_input_14 | 14 | Stochastik Length |
| v_input_15_close | 0 | RSI Source: close |
| v_input_16 | 9 | Ichi Conversion Line Length |
| v_input_17 | 26 | Ichi Base Line Length |
| v_input_18 | 52 | Ichi Lagging Span 2 Length |
| v_input_19 | true | Ichi Displacement |
Source (PineScript)
/*backtest
start: 2022-11-17 00:00:00
end: 2023-11-23 00:00:00
period: 1d
basePeriod: 1h
exchanges: [{"eid":"Futures_Binance","currency":"BTC_USDT"}]
*/

//@version=4

strategy(title="Ichimoku only Long Strategy", shorttitle="Ichimoku only Long", overlay = true, pyramiding = 0, calc_on_order_fills = false, commission_type =  strategy.commission.percent, commission_value = 0, default_qty_type = strategy.percent_of_equity, default_qty_value = 100, initial_capital=10000, currency=currency.USD)

// Time Range
FromMonth=input(defval=1,title="FromMonth",minval=1,maxval=12)
FromDay=input(defval=1,title="FromDay",minval=1,maxval=31)
FromYear=input(defval=2017,title="FromYear",minval=2017)
ToMonth=input(defval=1,title="ToMonth",minval=1,maxval=12)
ToDay=input(defval=1,title="ToDay",minval=1,maxval=31)
ToYear=input(defval=9999,title="ToYear",minval=2017)
start=timestamp(FromYear,FromMonth,FromDay,00,00)
finish=timestamp(ToYear,ToMonth,ToDay,23,59)
window()=>true
// See if this bar's time happened on/after start date
afterStartDate = time >= start and time<=finish?true:false

//Enable RSI
enableema = input(true, title="Enable EMA?")
enablestochrsi = input(false, title="Enable Stochastik RSI?")

//EMA
emasrc = close,
len1 = input(24, minval=1, title="EMA 1")
len2 = input(90, minval=1, title="EMA 2")

ema1 = ema(emasrc, len1)
ema2 = ema(emasrc, len2)

col1 = color.lime
col2 = color.red

//EMA Plots
plot(ema1, title="EMA 1", linewidth=1, color=col1)
plot(ema2, title="EMA 2", linewidth=1, color=col2)

//STOCH RSI
smoothK = input(3, minval=1, title="RSI K Line")
smoothD = input(3, minval=1, title="RSI D Line")
lengthRSI = input(14, minval=1, title="RSI Length")
lengthStoch = input(14, minval=1, title="Stochastik Length")
src = input(close, title="RSI Source")

rsi1 = rsi(src, lengthRSI)
k = sma(stoch(rsi1, rsi1, rsi1, lengthStoch), smoothK)
d = sma(k, smoothD)

//Ichimoku
conversionPeriods = input(9, minval=1, title="Ichi Conversion Line Length")
basePeriods = input(26, minval=1, title="Ichi Base Line Length")
laggingSpan2Periods = input(52, minval=1, title="Ichi Lagging Span 2 Length")
displacement = input(1, minval=0, title="Ichi Displacement")
donchian(len) => avg(lowest(len), highest(len))
conversionLine = donchian(conversionPeriods)
baseLine = donchian(basePeriods)
leadLine1 = avg(conversionLine, baseLine)
leadLine2 = donchian(laggingSpan2Periods)
p1 = plot(leadLine1, offset = displacement - 1, color=color.green,
	 title="Lead 1")
p2 = plot(leadLine2, offset = displacement - 1, color=color.red,
	 title="Lead 2")
fill(p1, p2, color = leadLine1 > leadLine2 ? color.green : color.red)


//Long Condition
crossup = k[0] > d[0] and k[1] <= d[1]
ichigreenabovered = leadLine1 > leadLine2
ichimokulong = close > leadLine1
greencandle =  close > open
redcandle = close < open
emacond = ema1 > ema2
longcondition = ichigreenabovered and ichimokulong and greencandle

//Exit Condition
ichimokuexit = close < leadLine1

exitcondition = ichimokuexit and redcandle

//Entrys

if (enablestochrsi == false) and (enableema == false) and (longcondition) and (afterStartDate) and (strategy.opentrades < 1)
    strategy.entry("Long", strategy.long)

if (enablestochrsi == true) and (enableema == false) and (longcondition) and (crossup) and (afterStartDate) and (strategy.opentrades < 1)
    strategy.entry("Long", strategy.long)

if (enableema == true) and (enablestochrsi == false) and (longcondition) and (emacond) and (afterStartDate) and (strategy.opentrades < 1)
    strategy.entry("Long", strategy.long)

if (enableema == true) and (enablestochrsi == true) and (longcondition) and (emacond) and (crossup) and (afterStartDate) and (strategy.opentrades < 1)
    strategy.entry("Long", strategy.long)


//Exits
if (afterStartDate)
    strategy.close(id = "Long", when = exitcondition)
Detail
https://www.fmz.com/strategy/433068
Last Modified
2023-11-24 10:15:15