
16 KiB
Name
Fibonacci-Extension-and-Retracement-Channel-Breakout-Strategy-斐波那契延展回撤通道突破策略
Author
ChaoZhang
Strategy Description
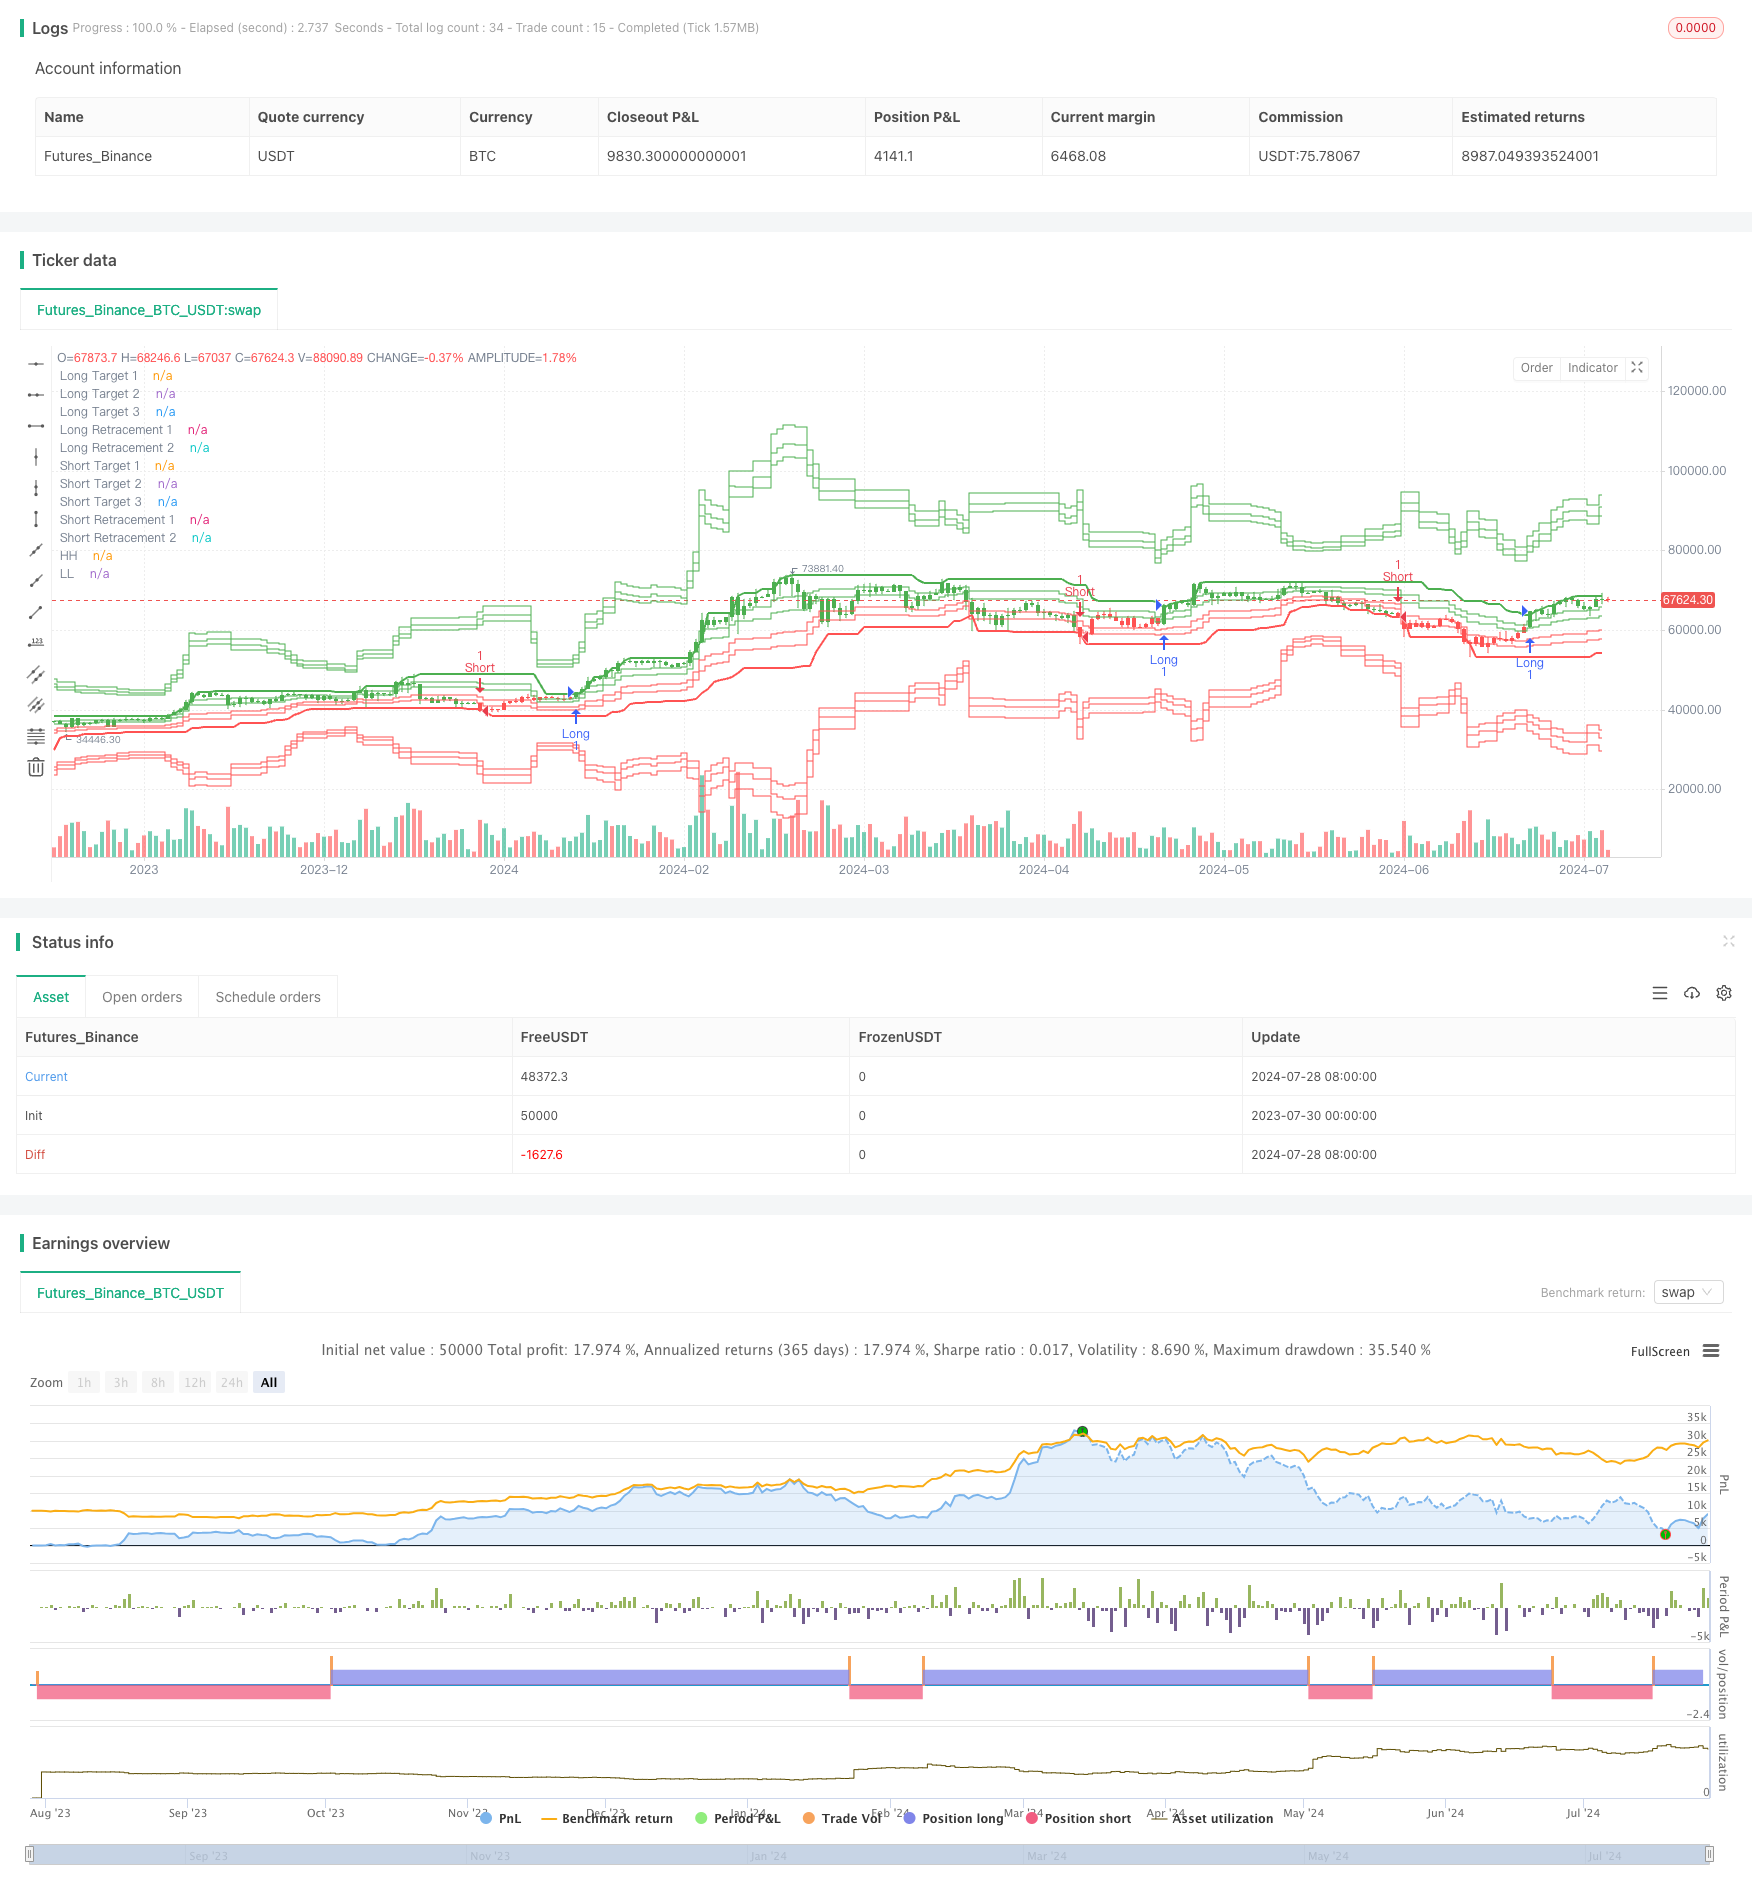
[trans]
概述
斐波那契延展回撤通道突破策略是一种基于技术分析的高级交易系统,结合了最高高点/最低低点(HH/LL)通道和斐波那契延展/回撤水平。该策略旨在识别强劲的趋势突破机会,同时利用斐波那契水平进行精确的目标价设定和风险管理。通过整合这些强大的技术指标,该策略为交易者提供了一个全面的框架,用于捕捉高概率的市场走势并优化风险回报比。
策略原理
该策略的核心原理基于以下几个关键元素:
-
HH/LL通道:使用指定周期(默认为20个周期)内的最高高点(HH)和最低低点(LL)来构建动态的价格通道。这个通道反映了近期的价格范围和市场波动性。
-
突破信号:当价格突破HH或LL时,系统生成交易信号。向上突破HH触发做多信号,向下突破LL触发做空信号。
-
斐波那契延展和回撤水平:基于HH和LL计算多个斐波那契水平,包括:
- 延展水平:127.2%, 141.4%, 161.8%
- 回撤水平:23.6%, 38.2%
这些水平用作潜在的目标价和支撑/阻力区域。
-
动态调整:策略会持续更新HH/LL通道和斐波那契水平,以适应不断变化的市场条件。
-
视觉辅助:使用颜色编码的价格柱和图形标签来增强信号的可视化效果,便于快速决策。
策略优势
-
趋势捕捉能力:通过结合HH/LL突破和斐波那契水平,该策略能够有效识别并跟踪强劲的市场趋势。
-
精确的目标设定:斐波那契延展水平提供了科学的利润目标,有助于最大化盈利潜力。
-
风险管理:回撤水平可用作止损点,为交易提供明确的风险控制参数。
-
适应性强:动态调整的HH/LL通道使策略能够适应不同的市场环境和波动性。
-
多维度分析:结合价格行为、趋势和数学比例,提供全面的市场洞察。
-
视觉清晰:直观的图形表示和颜色编码使得信号识别和决策过程更加高效。
-
灵活性:可以根据个人偏好和市场特性调整参数,如周期长度和斐波那契水平。
策略风险
-
假突破:在横盘市场中可能产生误导性信号,导致频繁的假突破交易。
-
滞后性:基于历史数据的HH/LL可能在快速变化的市场中反应不够及时。
-
过度依赖:仅依赖技术指标而忽视基本面分析可能导致重大市场事件带来的意外风险。
-
参数敏感性:不当的参数设置可能导致过多或过少的交易信号。
-
回撤风险:在强势趋势中,价格可能在达到延展目标前经历显著回撤。
-
执行滑点:在波动性大的市场中,实际执行价格可能与信号价格存在较大偏差。
-
过度交易:自动化系统可能导致过度交易,增加交易成本并稀释整体收益。
策略优化方向
-
整合多时间框架分析:结合更长和更短的时间周期来确认趋势强度和潜在反转点。
-
加入成交量指标:将成交量分析纳入信号确认过程,提高突破有效性的判断。
-
引入动量指标:如RSI或MACD,用于过滤弱势信号并确认趋势强度。
-
优化进场时机:考虑在回撤到关键斐波那契水平时进场,而不是直接在突破点入场。
-
动态止损:实现基于ATR或百分比变动的跟踪止损,以更好地保护利润。
-
风险管理增强:实现基于账户规模的仓位大小自动调整,以及每笔交易和每日最大损失限制。
-
市场状态过滤器:开发一个算法来识别市场状态(趋势/盘整),并相应地调整策略参数。
-
机器学习优化:使用机器学习算法来动态优化策略参数,适应不同的市场周期。
-
情绪指标整合:考虑加入市场情绪指标,如VIX,以增强市场时机选择。
-
回测和前向测试:进行广泛的历史回测和实时前向测试,以验证策略在不同市场条件下的稳健性。
总结
斐波那契延展回撤通道突破策略代表了一种先进的技术分析方法,通过结合HH/LL通道和斐波那契原理,为交易者提供了一个强大的框架来识别高概率的交易机会。该策略的优势在于其对趋势的敏感性、精确的目标设定能力和内置的风险管理机制。然而,用户需要意识到潜在的风险,如假突破和过度依赖技术指标的局限性。
通过持续优化和整合补充性分析工具,如多时间框架分析、成交量确认和动态风险管理,该策略有潜力成为一个全面而有效的交易系统。关键是要保持策略的适应性,不断根据市场条件调整参数,并始终将风险管理放在首位。
对于寻求在技术分析基础上构建系统化交易方法的交易者来说,这个策略提供了一个坚实的起点。通过深入理解其原理,审慎管理其风险,并不断探索优化方向,交易者可以利用这个策略在复杂多变的金融市场中寻找一致性的优势。
||
Overview
The Fibonacci Extension and Retracement Channel Breakout Strategy is an advanced trading system based on technical analysis, combining the Highest High/Lowest Low (HH/LL) channel with Fibonacci extension and retracement levels. This strategy aims to identify strong trend breakout opportunities while utilizing Fibonacci levels for precise target setting and risk management. By integrating these powerful technical indicators, the strategy provides traders with a comprehensive framework for capturing high-probability market movements and optimizing risk-reward ratios.
Strategy Principles
The core principles of this strategy are based on the following key elements:
-
HH/LL Channel: Uses the Highest High (HH) and Lowest Low (LL) within a specified period (default 20 periods) to construct a dynamic price channel. This channel reflects the recent price range and market volatility.
-
Breakout Signals: The system generates trading signals when price breaks out of the HH or LL. A breakout above HH triggers a long signal, while a breakdown below LL triggers a short signal.
-
Fibonacci Extension and Retracement Levels: Multiple Fibonacci levels are calculated based on the HH and LL, including:
- Extension levels: 127.2%, 141.4%, 161.8%
- Retracement levels: 23.6%, 38.2%
These levels serve as potential price targets and support/resistance zones.
-
Dynamic Adjustment: The strategy continuously updates the HH/LL channel and Fibonacci levels to adapt to changing market conditions.
-
Visual Aids: Uses color-coded price bars and graphical labels to enhance signal visualization for quick decision-making.
Strategy Advantages
-
Trend Capture Ability: By combining HH/LL breakouts with Fibonacci levels, the strategy effectively identifies and tracks strong market trends.
-
Precise Target Setting: Fibonacci extension levels provide scientific profit targets, helping to maximize profit potential.
-
Risk Management: Retracement levels can be used as stop-loss points, providing clear risk control parameters for trades.
-
High Adaptability: The dynamically adjusting HH/LL channel allows the strategy to adapt to different market environments and volatility.
-
Multi-dimensional Analysis: Combines price action, trend, and mathematical ratios to provide comprehensive market insights.
-
Visual Clarity: Intuitive graphical representation and color coding make signal identification and decision-making processes more efficient.
-
Flexibility: Parameters can be adjusted based on personal preferences and market characteristics, such as period length and Fibonacci levels.
Strategy Risks
-
False Breakouts: May generate misleading signals in ranging markets, leading to frequent false breakout trades.
-
Lagging Nature: HH/LL based on historical data may not react quickly enough in rapidly changing markets.
-
Over-reliance: Depending solely on technical indicators while ignoring fundamental analysis may lead to unexpected risks from major market events.
-
Parameter Sensitivity: Improper parameter settings may result in too many or too few trading signals.
-
Retracement Risk: In strong trends, price may experience significant retracements before reaching extension targets.
-
Execution Slippage: In highly volatile markets, actual execution prices may deviate significantly from signal prices.
-
Overtrading: Automated systems may lead to overtrading, increasing transaction costs and diluting overall returns.
Strategy Optimization Directions
-
Integrate Multi-timeframe Analysis: Incorporate longer and shorter time periods to confirm trend strength and potential reversal points.
-
Add Volume Indicators: Incorporate volume analysis into the signal confirmation process to improve breakout validity assessment.
-
Introduce Momentum Indicators: Such as RSI or MACD, to filter weak signals and confirm trend strength.
-
Optimize Entry Timing: Consider entering on retracements to key Fibonacci levels rather than directly at breakout points.
-
Dynamic Stop-loss: Implement trailing stops based on ATR or percentage moves to better protect profits.
-
Enhanced Risk Management: Implement automatic position sizing based on account size, as well as maximum loss limits per trade and per day.
-
Market State Filter: Develop an algorithm to identify market states (trending/ranging) and adjust strategy parameters accordingly.
-
Machine Learning Optimization: Use machine learning algorithms to dynamically optimize strategy parameters, adapting to different market cycles.
-
Sentiment Indicator Integration: Consider adding market sentiment indicators, such as VIX, to enhance market timing.
-
Backtesting and Forward Testing: Conduct extensive historical backtests and real-time forward tests to validate strategy robustness under different market conditions.
Conclusion
The Fibonacci Extension and Retracement Channel Breakout Strategy represents an advanced technical analysis approach, offering traders a powerful framework for identifying high-probability trading opportunities by combining HH/LL channels with Fibonacci principles. The strategy's strengths lie in its sensitivity to trends, precise target-setting capabilities, and built-in risk management mechanisms. However, users need to be aware of potential risks such as false breakouts and the limitations of over-reliance on technical indicators.
Through continuous optimization and integration of complementary analytical tools, such as multi-timeframe analysis, volume confirmation, and dynamic risk management, this strategy has the potential to become a comprehensive and effective trading system. The key is to maintain the strategy's adaptability, continuously adjusting parameters based on market conditions, and always prioritizing risk management.
For traders seeking to build a systematic trading approach based on technical analysis, this strategy provides a solid starting point. By deeply understanding its principles, prudently managing its risks, and continuously exploring optimization directions, traders can use this strategy to seek consistent advantages in the complex and ever-changing financial markets.
[/trans]
Source (PineScript)
/*backtest
start: 2023-07-30 00:00:00
end: 2024-07-29 00:00:00
period: 1d
basePeriod: 1h
exchanges: [{"eid":"Futures_Binance","currency":"BTC_USDT"}]
*/

//@version=5
strategy('Highest High and Lowest Low Channel Strategy', overlay=true)

length = input(20)
reverse = input(false, title='Trade reverse')
hh = ta.highest(high, length)
ll = ta.lowest(low, length)

// Cálculo dos preços-alvo com Fibonacci
fib_retracement1 = 0.236
fib_retracement2 = 0.382
fib_retracement3 = 0.618
fib_extension1 = 1.272
fib_extension2 = 1.414
fib_extension3 = 1.618

// Níveis de Fibonacci para Long
fib_long_entry = hh
fib_long_target1 = hh + (hh - ll) * fib_extension1
fib_long_target2 = hh + (hh - ll) * fib_extension2
fib_long_target3 = hh + (hh - ll) * fib_extension3
fib_long_target4 = hh - (hh - ll) * fib_retracement1
fib_long_target5 = hh - (hh - ll) * fib_retracement2

// Níveis de Fibonacci para Short
fib_short_entry = ll
fib_short_target1 = ll - (hh - ll) * fib_extension1
fib_short_target2 = ll - (hh - ll) * fib_extension2
fib_short_target3 = ll - (hh - ll) * fib_extension3
fib_short_target4 = ll + (hh - ll) * fib_retracement1
fib_short_target5 = ll + (hh - ll) * fib_retracement2

// Lógica de Entrada
pos = 0.0
iff_1 = close < ll[1] ? -1 : nz(pos[1], 0)
pos := close > hh[1] ? 1 : iff_1
iff_2 = reverse and pos == -1 ? 1 : pos
possig = reverse and pos == 1 ? -1 : iff_2

// Entrada de Estratégia
if possig == 1
    strategy.entry('Long', strategy.long)
if possig == -1
    strategy.entry('Short', strategy.short)

// Cor da Barra
barcolor(possig == -1 ? color.red : possig == 1 ? color.green : color.blue)

// Plotagem do HH e LL
plot(hh[1], color=color.new(color.green, 0), title='HH', linewidth=2)
plot(ll[1], color=color.new(color.red, 0), title='LL', linewidth=2)

// Plotagem dos preços-alvo Fibonacci no gráfico
plot(fib_long_target1, color=color.new(color.green, 0), title='Long Target 1', linewidth=1, style=plot.style_stepline)
plot(fib_long_target2, color=color.new(color.green, 0), title='Long Target 2', linewidth=1, style=plot.style_stepline)
plot(fib_long_target3, color=color.new(color.green, 0), title='Long Target 3', linewidth=1, style=plot.style_stepline)
plot(fib_long_target4, color=color.new(color.green, 0), title='Long Retracement 1', linewidth=1, style=plot.style_stepline)
plot(fib_long_target5, color=color.new(color.green, 0), title='Long Retracement 2', linewidth=1, style=plot.style_stepline)

plot(fib_short_target1, color=color.new(color.red, 0), title='Short Target 1', linewidth=1, style=plot.style_stepline)
plot(fib_short_target2, color=color.new(color.red, 0), title='Short Target 2', linewidth=1, style=plot.style_stepline)
plot(fib_short_target3, color=color.new(color.red, 0), title='Short Target 3', linewidth=1, style=plot.style_stepline)
plot(fib_short_target4, color=color.new(color.red, 0), title='Short Retracement 1', linewidth=1, style=plot.style_stepline)
plot(fib_short_target5, color=color.new(color.red, 0), title='Short Retracement 2', linewidth=1, style=plot.style_stepline)

// Labels para Long
label.new(bar_index, hh, "Long", color=color.green, textcolor=color.white, style=label.style_label_down, size=size.normal)
label.new(bar_index, fib_long_target1, "Long Target 1", color=color.green, textcolor=color.white, style=label.style_label_down, size=size.small)
label.new(bar_index, fib_long_target2, "Long Target 2", color=color.green, textcolor=color.white, style=label.style_label_down, size=size.small)
label.new(bar_index, fib_long_target3, "Long Target 3", color=color.green, textcolor=color.white, style=label.style_label_down, size=size.small)
label.new(bar_index, fib_long_target4, "Long Retracement 1", color=color.green, textcolor=color.white, style=label.style_label_down, size=size.small)
label.new(bar_index, fib_long_target5, "Long Retracement 2", color=color.green, textcolor=color.white, style=label.style_label_down, size=size.small)

// Labels para Short
label.new(bar_index, ll, "Short", color=color.red, textcolor=color.white, style=label.style_label_up, size=size.normal)
label.new(bar_index, fib_short_target1, "Short Target 1", color=color.red, textcolor=color.white, style=label.style_label_up, size=size.small)
label.new(bar_index, fib_short_target2, "Short Target 2", color=color.red, textcolor=color.white, style=label.style_label_up, size=size.small)
label.new(bar_index, fib_short_target3, "Short Target 3", color=color.red, textcolor=color.white, style=label.style_label_up, size=size.small)
label.new(bar_index, fib_short_target4, "Short Retracement 1", color=color.red, textcolor=color.white, style=label.style_label_up, size=size.small)
label.new(bar_index, fib_short_target5, "Short Retracement 2", color=color.red, textcolor=color.white, style=label.style_label_up, size=size.small)
Detail
https://www.fmz.com/strategy/458185
Last Modified
2024-07-30 16:37:41