
10 KiB
Name
EMARSITA多重指标交易策略-EMA-RSI-TA-Multi-Indicator-Trading-Strategy
Author
ChaoZhang
Strategy Description
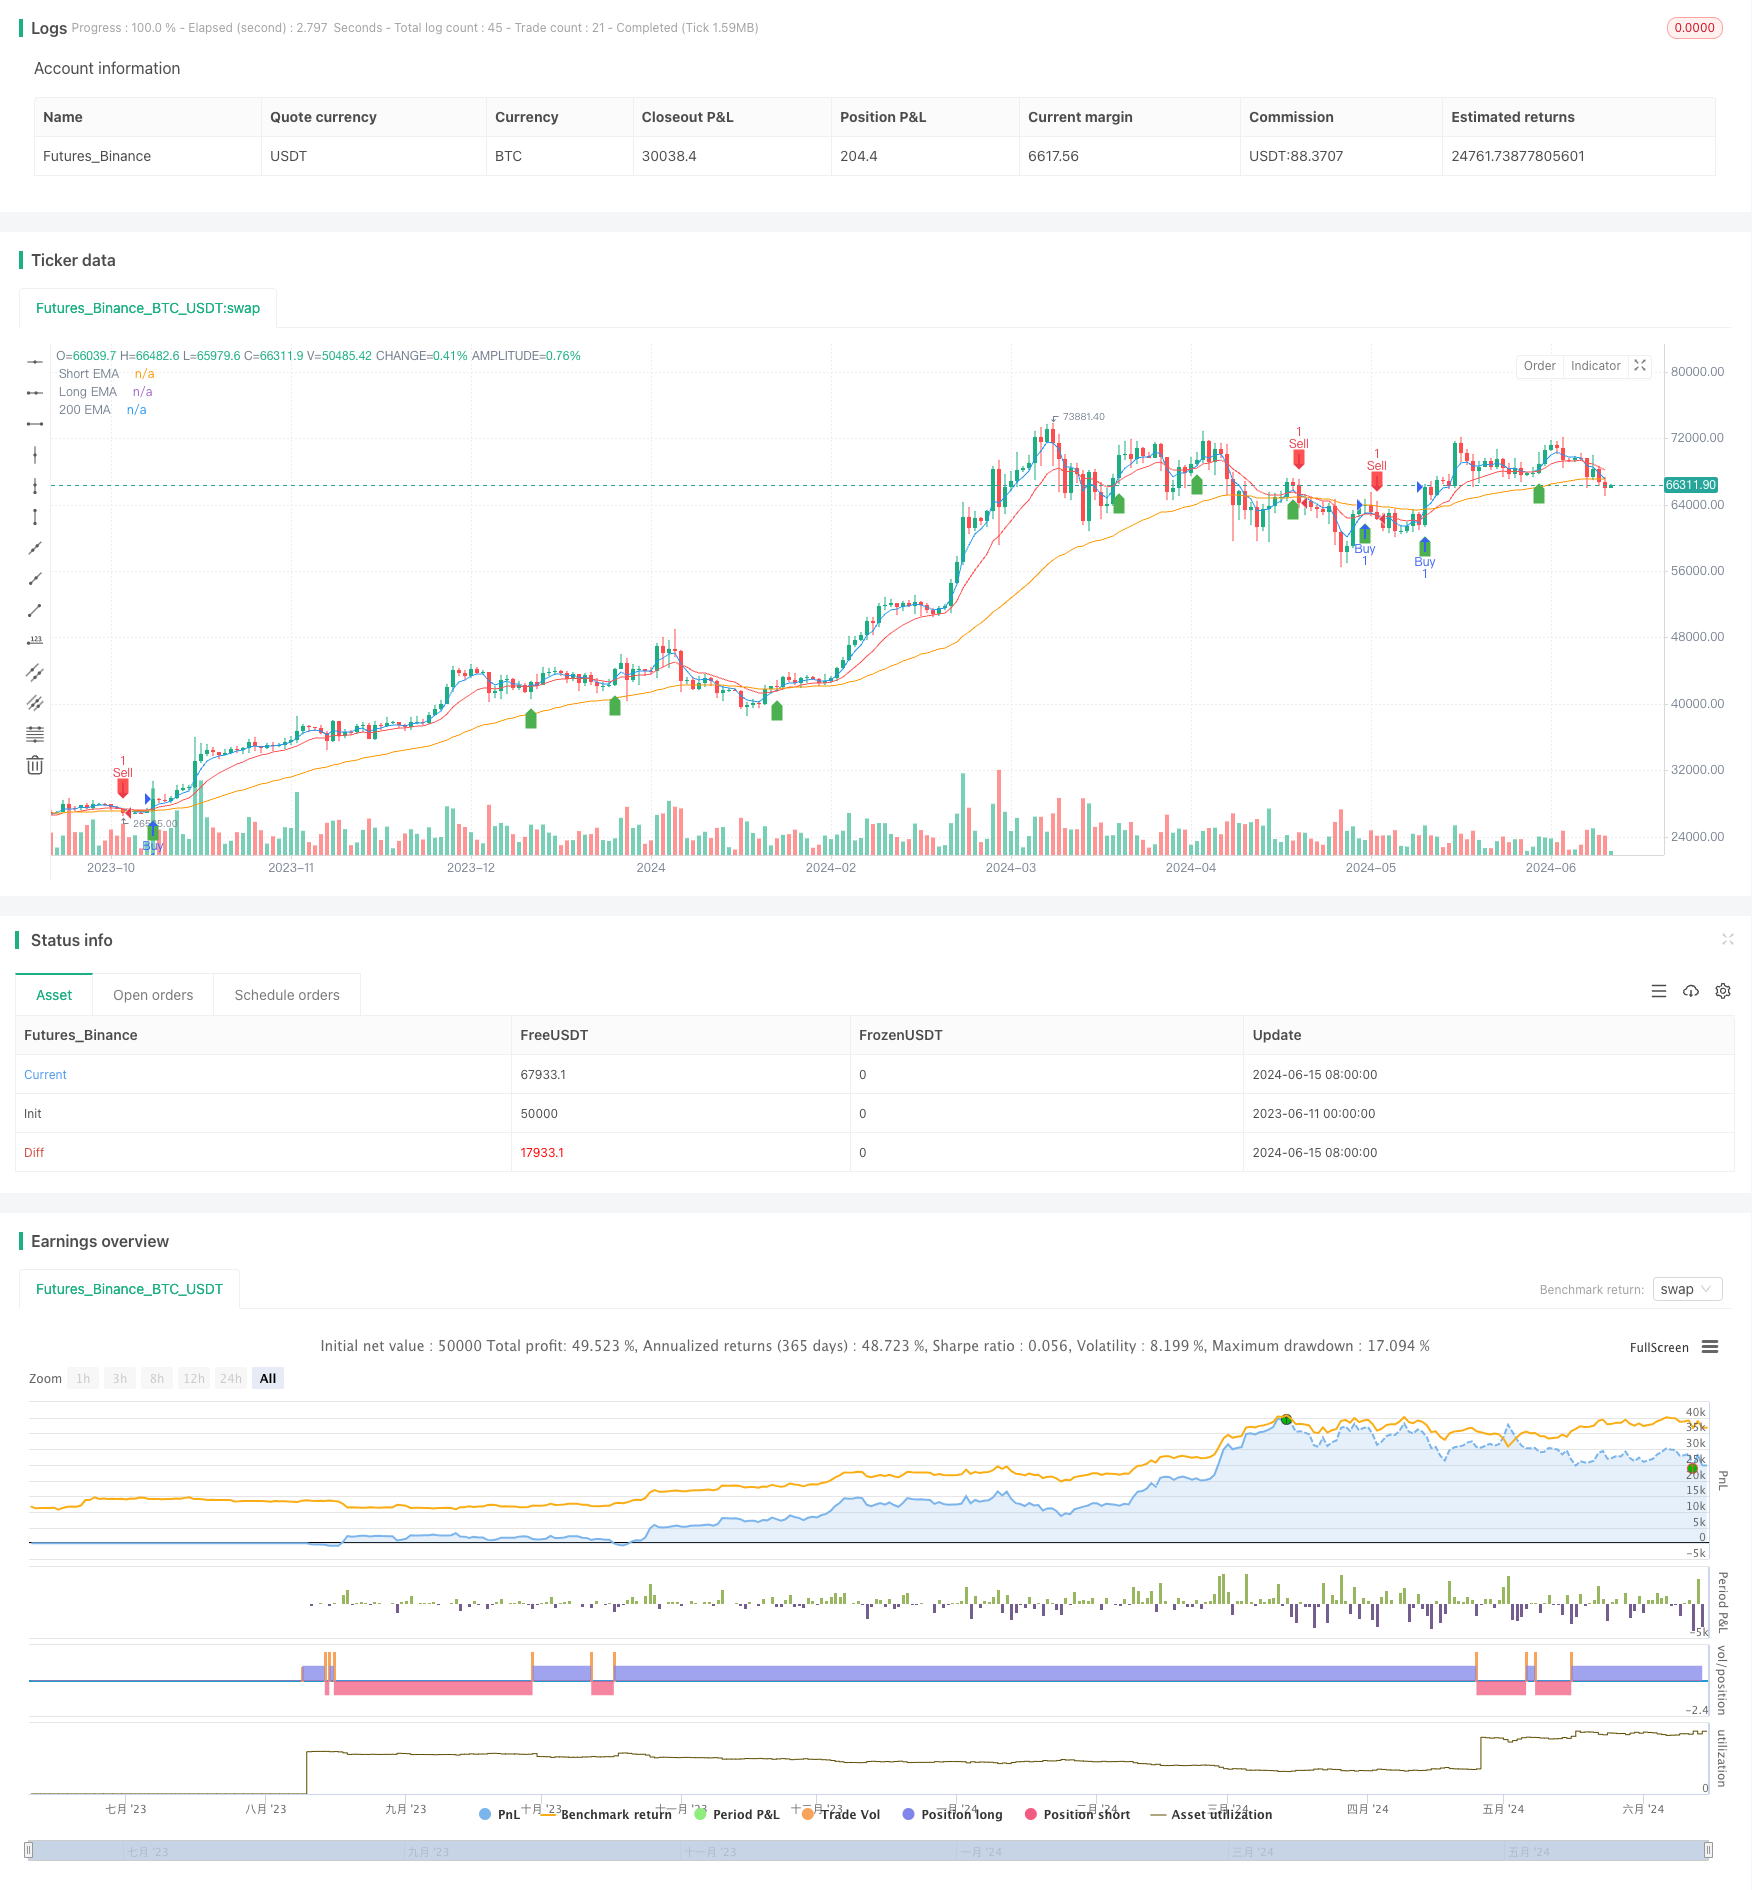
[trans]
概述
该策略结合了多个技术指标,包括三个不同周期的指数移动平均线(EMA)和相对强弱指数(RSI),通过分析它们之间的关系来识别潜在的买卖信号。该策略的主要思路是利用短期、中期和长期EMA的交叉来确定趋势方向,同时使用RSI来过滤可能的假信号。当价格在长期EMA之上,短期EMA上穿中期EMA,且RSI未达到超买区时,产生买入信号;相反地,当价格在长期EMA之下,短期EMA下穿中期EMA,且RSI未达到超卖区时,产生卖出信号。
策略原理
- 计算三个不同周期的EMA:短期(默认为4)、中期(默认为12)和长期(默认为48)。
- 计算RSI指标,默认周期为14,超买区默认为70,超卖区默认为30。
- 当满足以下条件时,产生买入信号:
- 短期EMA上穿中期EMA
- RSI未达到超买区
- 收盘价在长期EMA之上
- 当满足以下条件时,产生卖出信号:
- 短期EMA下穿中期EMA
- RSI未达到超卖区
- 收盘价在长期EMA之下
- 根据买卖信号执行相应的多头或空头交易。
策略优势
- 多重指标确认:该策略结合了趋势跟踪指标(EMA)和动量指标(RSI),通过多个指标的共同确认来提高信号的可靠性,有助于过滤掉一些假信号。
- 趋势适应性:通过使用不同周期的EMA,该策略能够适应不同时间尺度的趋势,捕捉短期、中期和长期的趋势变化。
- 风险控制:通过RSI的超买超卖条件,该策略避免在市场可能反转时进行交易,一定程度上控制了风险。
- 简单易用:该策略逻辑清晰,使用的指标简单实用,易于理解和应用。
策略风险
- 参数优化风险:该策略的表现依赖于EMA和RSI的参数选择,不同的参数可能导致不同的结果。如果参数没有经过充分的回测和优化,可能导致策略表现不佳。
- 震荡市风险:在震荡市场条件下,频繁的EMA交叉可能导致过多的交易信号,增加交易成本并降低策略效率。
- 趋势逆转风险:该策略在趋势已经确立后才会产生信号,可能错过趋势初期的一部分利润。同时,当趋势突然逆转时,该策略可能反应不够及时,导致一定的损失。
策略优化方向
- 动态参数优化:考虑使用动态参数优化方法,如遗传算法或网格搜索,找到在不同市场条件下表现最佳的参数组合,提高策略的适应性和稳健性。
- 加入其他过滤条件:为了进一步提高信号质量,可以考虑加入其他技术指标或市场情绪指标作为过滤条件,如成交量、波动率等。
- 趋势强度确认:在产生交易信号前,可以通过分析趋势强度(如ADX指标)来确认趋势的可靠性,避免在弱趋势或无趋势市场中交易。
- 止损止盈优化:引入更高级的止损止盈策略,如移动止损或基于波动率的动态止损,以更好地控制风险和保护利润。
总结
该策略通过结合三个不同周期的EMA和RSI指标,形成了一个简单有效的趋势跟踪交易系统。它利用EMA交叉来识别趋势方向,并通过RSI来过滤可能的假信号,在捕捉趋势的同时控制了风险。尽管该策略存在一些局限性,如参数优化风险和趋势逆转风险,但通过进一步的优化,如动态参数选择、加入其他过滤条件和改进止损止盈策略,可以提高该策略的适应性和稳健性,使其成为一个更加完善和可靠的交易系统。
||
Overview
This strategy combines multiple technical indicators, including three Exponential Moving Averages (EMAs) with different periods and the Relative Strength Index (RSI), to identify potential buy and sell signals by analyzing the relationships between these indicators. The main idea behind this strategy is to use the crossovers of short-term, medium-term, and long-term EMAs to determine the trend direction while using RSI to filter out possible false signals. A buy signal is generated when the price is above the long-term EMA, the short-term EMA crosses above the medium-term EMA, and the RSI is not in the overbought area. Conversely, a sell signal is generated when the price is below the long-term EMA, the short-term EMA crosses below the medium-term EMA, and the RSI is not in the oversold area.
Strategy Principles
- Calculate three EMAs with different periods: short-term (default 4), medium-term (default 12), and long-term (default 48).
- Calculate the RSI indicator with a default period of 14, overbought level of 70, and oversold level of 30.
- A buy signal is generated when the following conditions are met:
- The short-term EMA crosses above the medium-term EMA
- The RSI is not in the overbought area
- The closing price is above the long-term EMA
- A sell signal is generated when the following conditions are met:
- The short-term EMA crosses below the medium-term EMA
- The RSI is not in the oversold area
- The closing price is below the long-term EMA
- Execute corresponding long or short trades based on the buy and sell signals.
Strategy Advantages
- Multiple indicator confirmation: This strategy combines trend-following indicators (EMAs) and a momentum indicator (RSI), using confirmation from multiple indicators to improve signal reliability and help filter out some false signals.
- Trend adaptability: By using EMAs with different periods, this strategy can adapt to trends on various time scales, capturing short-term, medium-term, and long-term trend changes.
- Risk control: By incorporating overbought and oversold conditions from the RSI, this strategy avoids trading when the market may be prone to reversals, controlling risk to a certain extent.
- Simplicity and ease of use: The strategy's logic is clear, and the indicators used are simple and practical, making it easy to understand and apply.
Strategy Risks
- Parameter optimization risk: The performance of this strategy depends on the selection of EMA and RSI parameters, and different parameters may lead to varying results. If the parameters are not sufficiently backtested and optimized, the strategy's performance may be suboptimal.
- Choppy market risk: In choppy market conditions, frequent EMA crossovers may generate excessive trading signals, increasing trading costs and reducing strategy efficiency.
- Trend reversal risk: This strategy generates signals after a trend has been established, potentially missing out on some profits in the early stages of a trend. Additionally, when a trend suddenly reverses, the strategy may not react quickly enough, leading to potential losses.
Strategy Optimization Directions
- Dynamic parameter optimization: Consider using dynamic parameter optimization methods, such as genetic algorithms or grid search, to find the best-performing parameter combinations under different market conditions, improving the strategy's adaptability and robustness.
- Additional filtering conditions: To further enhance signal quality, consider incorporating other technical indicators or market sentiment indicators as filtering conditions, such as volume or volatility.
- Trend strength confirmation: Before generating trading signals, analyze trend strength (e.g., using the ADX indicator) to confirm the reliability of the trend, avoiding trades in weak or trendless markets.
- Stop-loss and take-profit optimization: Introduce more advanced stop-loss and take-profit strategies, such as trailing stops or volatility-based dynamic stops, to better control risk and protect profits.
Summary
This strategy combines three EMAs with different periods and the RSI indicator to form a simple and effective trend-following trading system. It uses EMA crossovers to identify trend direction and RSI to filter out potential false signals, capturing trends while controlling risk. Although the strategy has some limitations, such as parameter optimization risk and trend reversal risk, further optimizations, including dynamic parameter selection, additional filtering conditions, and improved stop-loss and take-profit strategies, can enhance its adaptability and robustness, making it a more comprehensive and reliable trading system. [/trans]
Source (PineScript)
/*backtest
start: 2023-06-11 00:00:00
end: 2024-06-16 00:00:00
period: 1d
basePeriod: 1h
exchanges: [{"eid":"Futures_Binance","currency":"BTC_USDT"}]
*/

// This Pine Script™ code is subject to the terms of the Mozilla Public License 2.0 at https://mozilla.org/MPL/2.0/
// © fitradn
//@version=4
//@version=4
strategy("EMA & RSI Strategy with 200 EMA", shorttitle="EMARSI200", overlay=true)

// Input for EMAs
shortEmaLength = input(4, title="Short EMA Length")
longEmaLength = input(12, title="Long EMA Length")
longTermEmaLength = input(48, title="Long Term EMA Length")

// Calculate EMAs
shortEma = ema(close, shortEmaLength)
longEma = ema(close, longEmaLength)
longTermEma = ema(close, longTermEmaLength)

// Plot EMAs
plot(shortEma, color=color.blue, title="Short EMA")
plot(longEma, color=color.red, title="Long EMA")
plot(longTermEma, color=color.orange, title="200 EMA")

// Input for RSI
rsiLength = input(14, title="RSI Length")
overbought = input(70, title="Overbought Level")
oversold = input(30, title="Oversold Level")

// Calculate RSI
rsi = rsi(close, rsiLength)

// Buy and Sell Conditions
buySignal = crossover(shortEma, longEma) and rsi < overbought and close > longTermEma
sellSignal = crossunder(shortEma, longEma) and rsi > oversold and close < longTermEma

// Execute Trades
if (buySignal)
    strategy.entry("Buy", strategy.long)
if (sellSignal)
    strategy.entry("Sell", strategy.short)

// Plot Buy and Sell Signals
plotshape(series=buySignal, location=location.belowbar, color=color.green, style=shape.labelup, title="Buy Signal")
plotshape(series=sellSignal, location=location.abovebar, color=color.red, style=shape.labeldown, title="Sell Signal")
Detail
https://www.fmz.com/strategy/454364
Last Modified
2024-06-17 16:38:23