
10 KiB
Name
EMAMACDRSI三重指标动量策略-EMA-MACD-and-RSI-Triple-Indicator-Momentum-Strategy
Author
ChaoZhang
Strategy Description
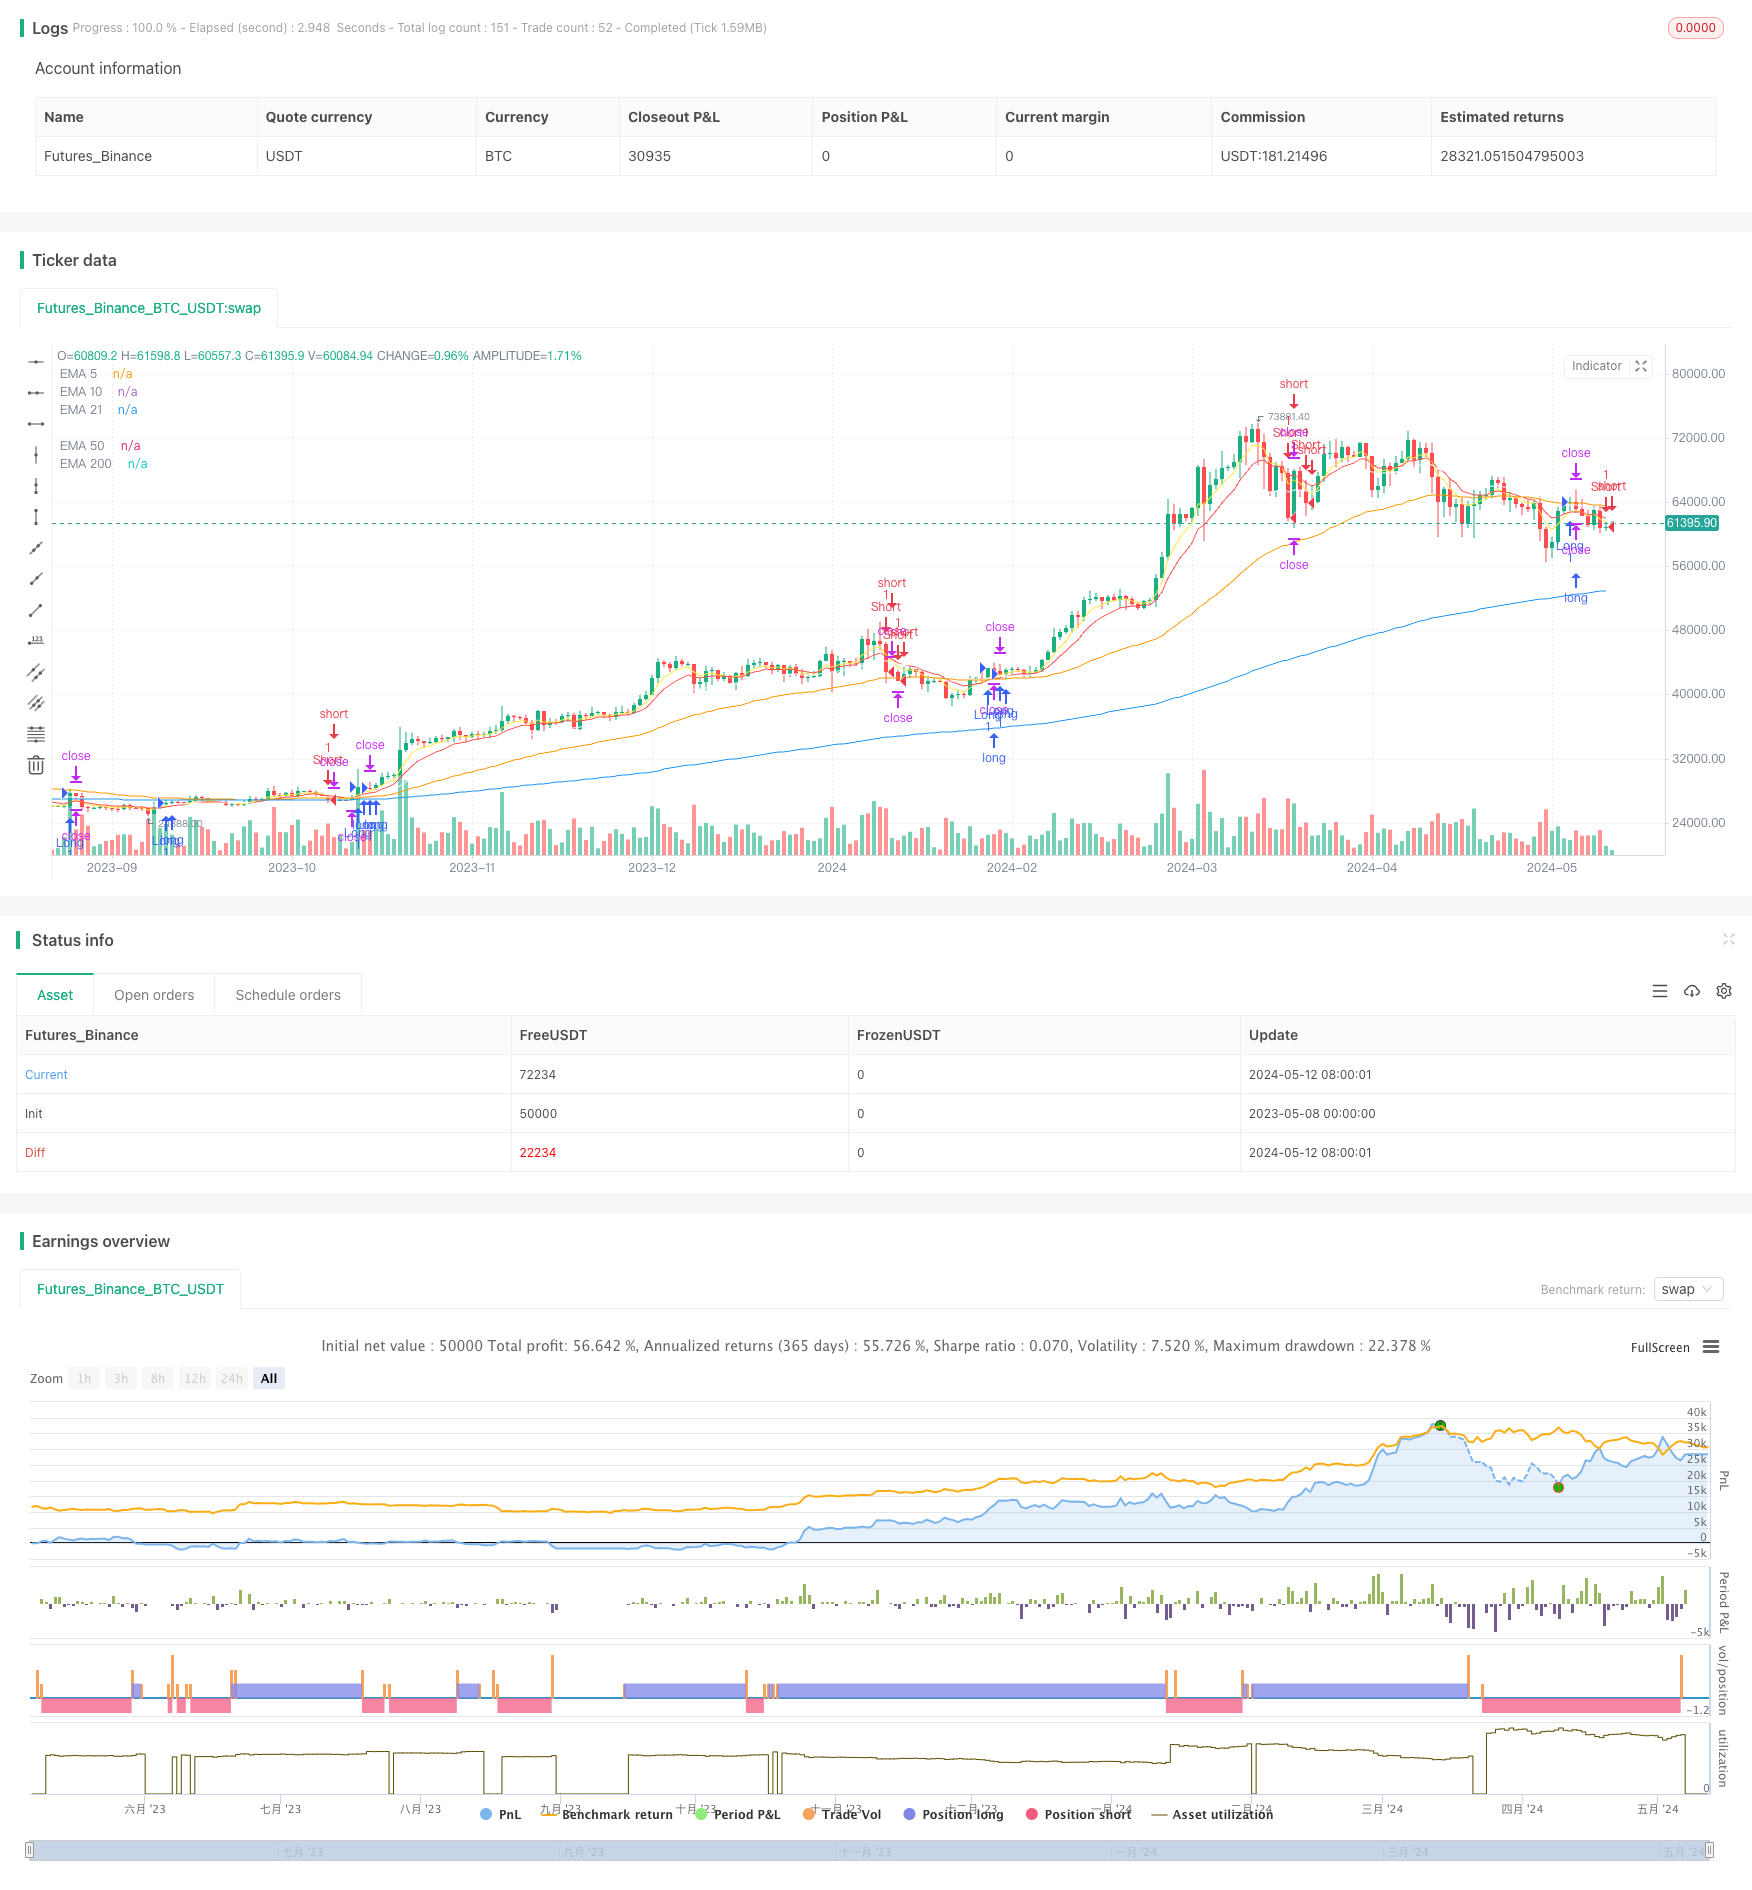
[trans]
概述
该策略结合了指数移动平均线(EMA)、移动平均线收敛发散指标(MACD)和相对强弱指标(RSI),通过三重指标的共同确认,识别潜在的趋势变化和动量转折点,以提高交易的准确性和可靠性。该策略使用了多个不同周期的EMA(5、10、21、50、200和1000),以全面评估不同时间尺度下的价格趋势。同时,MACD和RSI指标用于确认EMA交叉信号,提供进一步的趋势和动量证据。
策略原理
- EMA交叉:当较短周期EMA(如9日)穿过较长周期EMA(如21日)时,表明潜在趋势变化。多头交叉(9日EMA上穿21日EMA)预示看涨趋势,空头交叉(9日EMA下穿21日EMA)预示看跌趋势。
- MACD确认:利用MACD信号确认EMA交叉。对于多头交易,寻找MACD线上穿信号线且MACD柱状图为正值的情况。对于空头交易,则寻找相反的情况。当MACD柱状图平缓或缺乏明确方向时,避免交易。
- RSI确认:结合EMA和MACD信号,利用RSI确认超买或超卖状况。在看涨情景下,当RSI达到超买水平(>70)时考虑获利了结或平仓多头头寸。在看跌情景下,当RSI达到超卖水平(<30)时考虑获利了结或平仓空头头寸。
优势分析
- 多重指标确认:通过结合EMA、MACD和RSI,该策略提供了更全面可靠的交易信号,减少了假信号的可能性。
- 趋势跟踪:使用不同周期的EMA有助于识别不同时间尺度下的价格趋势,捕捉主要的市场走向。
- 动量衡量:MACD和RSI指标提供了对价格动量的额外洞见,帮助评估趋势强度和潜在反转。
- 风险管理:设置止损单和适当的仓位规模有助于管理风险,限制潜在损失。
风险分析
- 滞后性:作为趋势跟踪指标,EMA可能存在一定的滞后性,导致错过早期趋势变化。
- 假信号:尽管采用了多重指标确认,但在震荡市场条件下仍可能产生假信号。
- 参数优化:策略效果可能对指标参数选择敏感,需要根据不同市场和资产进行优化调整。
- 市场风险:任何交易策略都无法完全消除市场风险,意外事件和黑天鹅事件可能导致重大损失。
优化方向
- 动态参数调整:根据市场状况的变化,动态调整EMA、MACD和RSI的参数设置,以适应不同的市场阶段和波动水平。
- 多时间框架分析:结合多个时间框架的信号,如日线、4小时线和1小时线,以获得更全面的市场视角和确认。
- 风险管理优化:优化止损和止盈策略,如使用移动止损或基于波动率的止损,以更好地保护利润和限制损失。
- 组合其他指标:考虑纳入其他技术指标或基本面因素,如布林带、成交量或市场情绪指标,以提高信号质量和可靠性。
总结
EMA、MACD、RSI三重指标动量策略通过结合多个技术指标的优势,提供了一种全面的交易方法,帮助交易者以更高的置信度识别潜在的趋势变化和动量转折点。该策略利用不同周期的EMA评估多个时间尺度下的价格趋势,并用MACD和RSI指标进一步确认交易信号。尽管该策略展现了优势,但仍存在滞后性、假信号和市场风险等潜在风险。通过动态参数调整、多时间框架分析、风险管理优化和组合其他指标等方法,可以进一步提升策略的性能和稳健性。然而,任何交易策略在实施前都需要全面的回测和评估,并根据个人交易风格和风险承受能力进行适当调整。
||
Overview
This strategy combines the Exponential Moving Average (EMA), Moving Average Convergence Divergence (MACD), and Relative Strength Index (RSI) to identify potential trend changes and momentum shifts with increased accuracy and reliability. It employs multiple EMAs with different periods (5, 10, 21, 50, 200, and 1000) to comprehensively assess price trends across various time scales. Additionally, the MACD and RSI indicators are used to confirm EMA crossover signals, providing further evidence of trends and momentum.
Strategy Principles
- EMA Crossovers: When a shorter-period EMA (e.g., 9-day) crosses above or below a longer-period EMA (e.g., 21-day), it indicates a potential trend change. A bullish crossover (9-day EMA crossing above 21-day EMA) suggests a bullish trend, while a bearish crossover (9-day EMA crossing below 21-day EMA) suggests a bearish trend.
- MACD Confirmation: MACD signals are used to confirm EMA crossovers. For bullish trades, look for the MACD line crossing above the Signal line and a positive MACD histogram. For bearish trades, look for the opposite. Avoid trading when the MACD histogram is flat or lacks clear direction.
- RSI Confirmation: RSI is used to confirm overbought or oversold conditions in conjunction with EMA and MACD signals. In bullish scenarios, consider taking profits or closing long positions when RSI reaches overbought levels (>70). In bearish scenarios, consider taking profits or closing short positions when RSI reaches oversold levels (<30).
Advantages Analysis
- Multiple Indicator Confirmation: By combining EMA, MACD, and RSI, the strategy provides more comprehensive and reliable trading signals, reducing the likelihood of false signals.
- Trend Following: Using EMAs with different periods helps identify price trends across multiple time scales, capturing the primary market direction.
- Momentum Measurement: MACD and RSI indicators provide additional insights into price momentum, aiding in the assessment of trend strength and potential reversals.
- Risk Management: Setting stop-loss orders and proper position sizing helps manage risk and limit potential losses.
Risk Analysis
- Lagging Nature: As trend-following indicators, EMAs may exhibit some lag, potentially missing early trend changes.
- False Signals: Despite using multiple indicators for confirmation, false signals can still occur, particularly in choppy market conditions.
- Parameter Optimization: The strategy's performance may be sensitive to the choice of indicator parameters, requiring optimization and adaptation to different markets and assets.
- Market Risk: No trading strategy can completely eliminate market risk, and unexpected events or black swan occurrences may lead to significant losses.
Optimization Directions
- Dynamic Parameter Adjustment: Dynamically adjust the parameters of EMAs, MACD, and RSI based on changing market conditions to adapt to different market phases and volatility levels.
- Multi-Timeframe Analysis: Incorporate signals from multiple timeframes, such as daily, 4-hour, and 1-hour charts, to gain a more comprehensive market perspective and confirmation.
- Risk Management Optimization: Optimize stop-loss and take-profit strategies, such as using trailing stops or volatility-based stops, to better protect profits and limit losses.
- Integration of Additional Indicators: Consider incorporating other technical indicators or fundamental factors, such as Bollinger Bands, volume, or market sentiment indicators, to enhance signal quality and reliability.
Summary
The EMA, MACD, and RSI Triple Indicator Momentum Strategy provides a comprehensive approach to trading by leveraging the strengths of multiple technical indicators, enabling traders to identify potential trend changes and momentum shifts with increased confidence. The strategy utilizes EMAs with different periods to assess price trends across multiple time scales and employs MACD and RSI indicators to further confirm trading signals. While the strategy demonstrates advantages, it also carries potential risks such as lagging nature, false signals, and market risk. Through dynamic parameter adjustment, multi-timeframe analysis, risk management optimization, and the integration of additional indicators, the strategy's performance and robustness can be further enhanced. However, any trading strategy should undergo thorough backtesting and evaluation before implementation and be adapted to suit individual trading styles and risk tolerance. [/trans]
Source (PineScript)
/*backtest
start: 2023-05-08 00:00:00
end: 2024-05-13 00:00:00
period: 1d
basePeriod: 1h
exchanges: [{"eid":"Futures_Binance","currency":"BTC_USDT"}]
*/

//@version=5
strategy("2024", overlay=true)


// Define additional EMAs
ema5 = ta.ema(close, 5)
ema21 = ta.ema(close, 21)
ema10 = ta.ema(close, 10)
ema50 = ta.ema(close, 50)
ema200 = ta.ema(close, 200)
ema1000 = ta.ema(close, 1000)

// RSI
rsiValue = ta.rsi(close, 14)

// MACD
[macdLine, signalLine, histLine] = ta.macd(close, 12, 26, 9)

// Signal conditions
longCondition = close > ema21 and rsiValue > 50 and histLine > 0
shortCondition = close < ema21 and rsiValue < 50 and histLine < 0

// Entry and exit signals
if (longCondition and strategy.position_size <= 0)
    strategy.entry("Long", strategy.long)
    strategy.exit("Long Exit", "Long", limit=close*1.02, stop=close*0.98)
    alert('7345642438869,buy,XAUUSDm,risk=0.01,sl=140,tp=350', alert.freq_once_per_bar_close)

if (shortCondition and strategy.position_size >= 0)
    strategy.entry("Short", strategy.short)
    strategy.exit("Short Exit", "Short", limit=close*0.98, stop=close*1.02)
    alert('7345642438869,sell,XAUUSDm,risk=0.01,sl=140,tp=350', alert.freq_once_per_bar_close)

// Plotting EMAs
plot(ema5, color=color.yellow, title="EMA 5")
plot(ema10, color=color.red, title="EMA 10")
plot(ema21, color=color.white, title="EMA 21")
plot(ema50, color=color.orange, title="EMA 50")
plot(ema200, color=color.blue, title="EMA 200")
plot(ema1000, color=color.gray, title="EMA 1000")

// Plotting signals
plotshape(longCondition and strategy.position_size <= 0, style=shape.arrowup, location=location.belowbar, color=color.green, size=size.small)
plotshape(shortCondition and strategy.position_size >= 0, style=shape.arrowdown, location=location.abovebar, color=color.red, size=size.small)
Detail
https://www.fmz.com/strategy/451387
Last Modified
2024-05-14 15:34:37