
13 KiB
Name
EMA-MACD-SuperTrend-ADX-ATR多重指标交易信号策略-EMA-MACD-SuperTrend-ADX-ATR-Multi-Indicator-Trading-Signal-Strategy
Author
ChaoZhang
Strategy Description
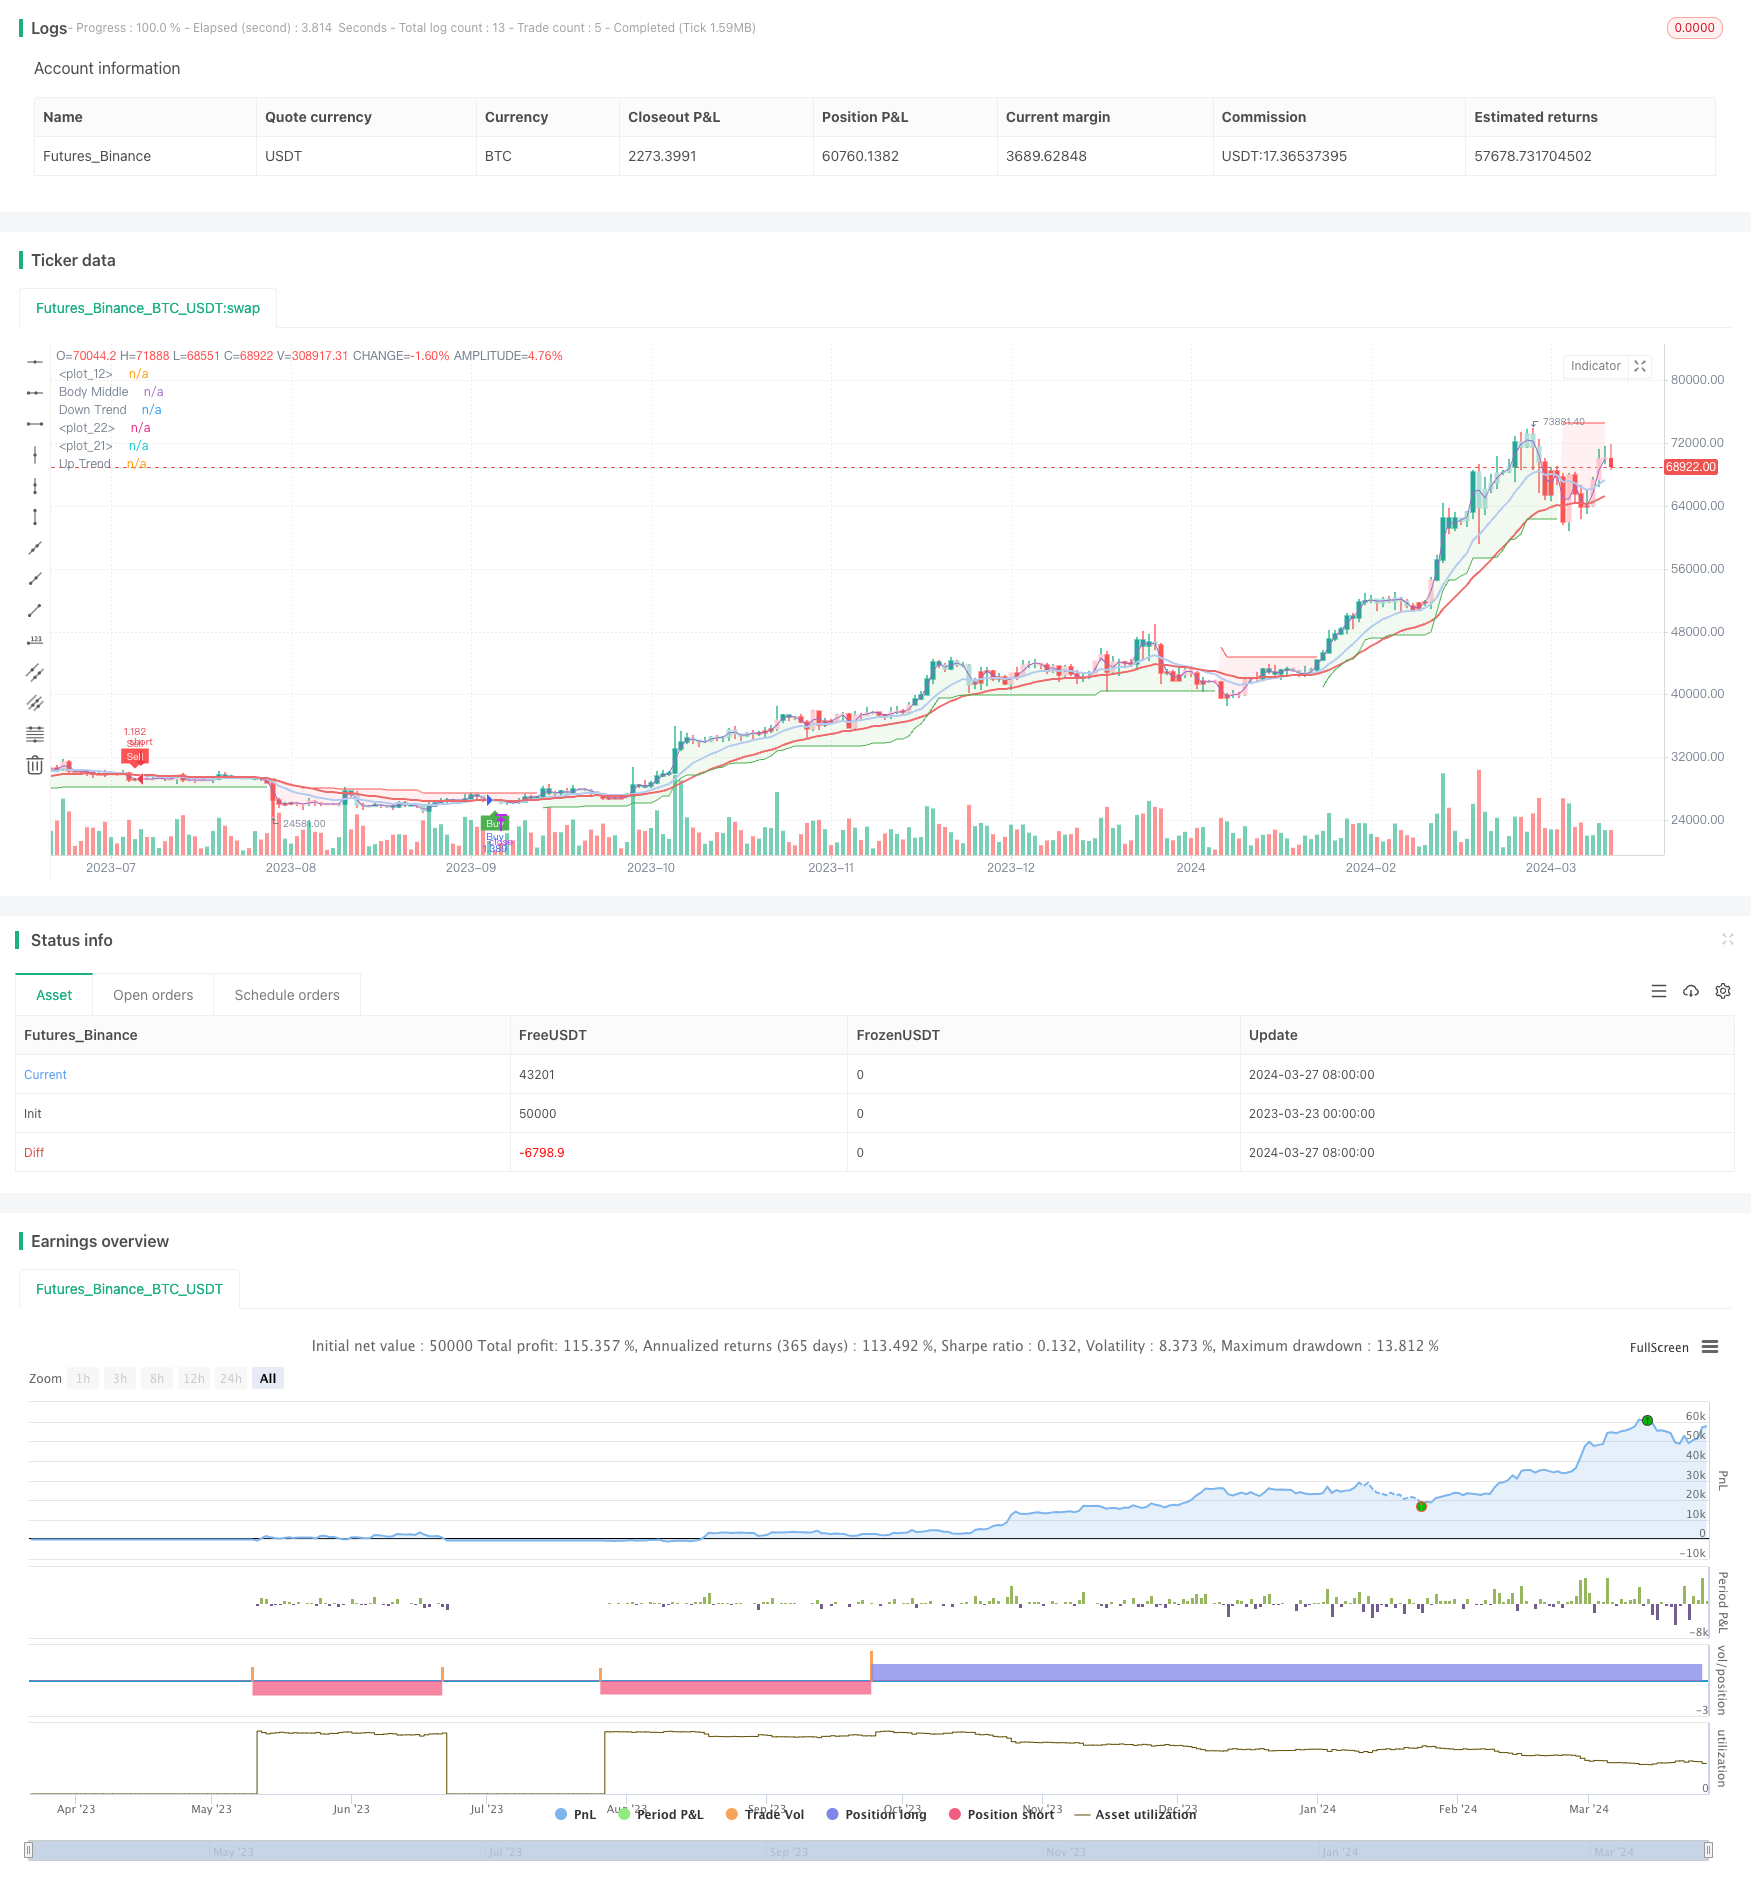 [trans]
概述
该策略综合运用了多个技术指标,包括指数移动平均线(EMA)、移动平均线收敛发散指标(MACD)、SuperTrend、平均方向指数(ADX)和平均真实波幅(ATR),通过这些指标的组合来判断市场趋势、波动性和交易信号,以期在加密货币交易中获得良好的回报。该策略利用了不同指标的优势,力求在趋势判断、震荡判断和风险控制等方面实现平衡,从而为交易者提供可靠的交易信号。
策略原理
- 使用12日和26日EMA的交叉作为趋势判断的依据,当12日EMA上穿26日EMA时表明上升趋势,反之则表明下降趋势。
- 利用MACD指标作为辅助判断,当MACD直方图大于0时,结合EMA多头信号进行开仓;当MACD直方图小于0时,结合EMA空头信号进行开仓。
- 通过ADX指标判断市场是否处于趋势状态,当ADX大于15时认为市场处于趋势期。
- 使用ATR指标对市场波动性进行判断,当ATR大于20日ATR的0.5倍时,认为市场处于高波动状态。
- 引入SuperTrend指标作为止损条件,当价格跌破SuperTrend时平多头仓位,当价格突破SuperTrend时平空头仓位。
- 在满足EMA、MACD、ADX和ATR条件时,根据多头或空头信号进行开仓;在触发SuperTrend止损条件时进行平仓。
策略优势
- 多指标组合:该策略综合运用了多个技术指标,从趋势、震荡和风险控制等多个维度对市场进行分析,提高了交易信号的可靠性。
- 趋势判断:通过EMA和MACD的结合,策略能够较好地判断市场的趋势方向,为交易决策提供依据。
- 风险控制:引入ADX和ATR指标,对市场的趋势强度和波动性进行判断,在一定程度上控制了交易风险。
- 止损机制:使用SuperTrend指标作为止损条件,能够有效地限制单笔交易的最大亏损,保护交易资金。
- 参数灵活:该策略中的各项指标参数可以根据不同的市场状况和交易品种进行灵活调整,以适应变化的市场环境。
策略风险
- 参数优化:该策略涉及多个指标和参数,如EMA周期、MACD参数、ADX阈值等,这些参数的选择对策略效果有重要影响,需要进行反复的参数优化和调试。
- 市场适应性:该策略在某些市场状况下可能表现欠佳,如震荡市或趋势转折点,此时策略可能会发出错误的交易信号。
- 滑点和交易成本:该策略在高波动市场中可能产生较为频繁的交易信号,导致较高的滑点和交易成本,影响策略收益。
- 回测局限性:该策略的回测结果可能存在一定的局限性,实际交易中的市场状况可能与历史数据存在差异,策略在实盘运行中的表现可能与回测结果不完全一致。
策略优化方向
- 动态参数优化:针对不同的市场状况和交易品种,对策略中的关键参数进行动态优化,提高策略的适应性和稳健性。
- 引入市场情绪指标:在现有指标的基础上,引入反映市场情绪的指标,如恐慌指数(VIX)等,对市场情绪进行量化分析,辅助交易决策。
- 改进止损机制:在SuperTrend止损的基础上,引入其他止损方法,如移动止损、百分比止损等,提高止损的灵活性和有效性。
- 仓位管理优化:根据市场趋势强度、波动性等因素,动态调整仓位大小,在趋势明确时加大仓位,在震荡市中减小仓位,提高资金利用效率。
- 多时间框架分析:结合不同时间框架的信号,如日线、4小时线等,对交易信号进行多重确认,提高信号的可靠性。
总结
EMA-MACD-SuperTrend-ADX-ATR多重指标交易信号策略是一个综合运用多个技术指标的量化交易策略。通过EMA、MACD、ADX和ATR等指标的组合,策略能够从趋势、震荡和风险控制等多个维度对市场进行分析,为交易者提供可靠的交易信号。该策略的优势在于多指标组合、趋势判断、风险控制和止损机制等方面,但同时也存在参数优化、市场适应性、交易成本和回测局限性等风险。未来可以通过动态参数优化、引入市场情绪指标、改进止损机制、仓位管理优化和多时间框架分析等方面对策略进行优化和改进,以提高其适应性、稳健性和盈利能力。
||
Overview
This strategy combines multiple technical indicators, including Exponential Moving Average (EMA), Moving Average Convergence Divergence (MACD), SuperTrend, Average Directional Index (ADX), and Average True Range (ATR), to determine market trends, volatility, and trading signals, aiming to achieve strong returns in cryptocurrency trading. The strategy leverages the strengths of different indicators to balance trend identification, oscillation determination, and risk control, providing reliable trading signals for traders.
Strategy Principle
- The crossover of the 12-day and 26-day EMAs is used as a basis for trend determination. When the 12-day EMA crosses above the 26-day EMA, it indicates an uptrend; conversely, it indicates a downtrend.
- The MACD indicator is used as an auxiliary judgment. When the MACD histogram is above 0, combined with the EMA bullish signal, a long position is opened. When the MACD histogram is below 0, combined with the EMA bearish signal, a short position is opened.
- The ADX indicator is used to determine whether the market is in a trending state. When ADX is above 15, the market is considered to be in a trending phase.
- The ATR indicator is used to assess market volatility. When ATR is greater than 0.5 times the 20-day ATR, the market is considered to be in a high volatility state.
- The SuperTrend indicator is introduced as a stop-loss condition. When the price falls below the SuperTrend, long positions are closed, and when the price breaks above the SuperTrend, short positions are closed.
- When the EMA, MACD, ADX, and ATR conditions are met, positions are opened based on bullish or bearish signals. When the SuperTrend stop-loss condition is triggered, positions are closed.
Strategy Advantages
- Multi-indicator combination: The strategy combines multiple technical indicators to analyze the market from various dimensions, including trend, oscillation, and risk control, improving the reliability of trading signals.
- Trend identification: By combining EMA and MACD, the strategy can effectively determine the market trend direction, providing a basis for trading decisions.
- Risk control: The introduction of ADX and ATR indicators helps assess the trend strength and volatility of the market, controlling trading risks to a certain extent.
- Stop-loss mechanism: Using the SuperTrend indicator as a stop-loss condition effectively limits the maximum loss of a single trade, protecting trading capital.
- Parameter flexibility: The indicator parameters in the strategy can be flexibly adjusted according to different market conditions and trading instruments to adapt to changing market environments.
Strategy Risks
- Parameter optimization: The strategy involves multiple indicators and parameters, such as EMA periods, MACD parameters, and ADX thresholds. The selection of these parameters has a significant impact on the strategy's performance and requires iterative parameter optimization and debugging.
- Market adaptability: The strategy may underperform in certain market conditions, such as range-bound markets or trend reversal points, where the strategy may generate incorrect trading signals.
- Slippage and trading costs: In highly volatile markets, the strategy may generate frequent trading signals, leading to higher slippage and trading costs, affecting the strategy's profitability.
- Backtesting limitations: The backtesting results of the strategy may have certain limitations. Actual market conditions may differ from historical data, and the strategy's performance in live trading may not entirely align with backtesting results.
Strategy Optimization Directions
- Dynamic parameter optimization: Dynamically optimize the key parameters in the strategy for different market conditions and trading instruments to improve the strategy's adaptability and robustness.
- Incorporation of market sentiment indicators: In addition to the existing indicators, introduce indicators that reflect market sentiment, such as the Volatility Index (VIX), to quantitatively analyze market sentiment and assist in trading decisions.
- Improved stop-loss mechanism: Enhance the flexibility and effectiveness of stop-losses by introducing additional stop-loss methods, such as trailing stops or percentage-based stops, in addition to the SuperTrend stop-loss.
- Position sizing optimization: Dynamically adjust position sizes based on factors such as market trend strength and volatility. Increase position sizes when trends are clear and reduce position sizes in range-bound markets to improve capital efficiency.
- Multi-timeframe analysis: Combine signals from different timeframes, such as daily and 4-hour charts, to confirm trading signals across multiple timeframes, enhancing signal reliability.
Summary
The EMA-MACD-SuperTrend-ADX-ATR Multi-Indicator Trading Signal Strategy is a quantitative trading strategy that integrates multiple technical indicators. By combining indicators such as EMA, MACD, ADX, and ATR, the strategy analyzes the market from various dimensions, including trend, oscillation, and risk control, providing reliable trading signals for traders. The strategy's strengths lie in its multi-indicator combination, trend identification, risk control, and stop-loss mechanism. However, it also faces risks such as parameter optimization, market adaptability, trading costs, and backtesting limitations. In the future, the strategy can be optimized and improved through dynamic parameter optimization, incorporation of market sentiment indicators, enhancement of the stop-loss mechanism, position sizing optimization, and multi-timeframe analysis to increase its adaptability, robustness, and profitability. [/trans]
Strategy Arguments
| Argument | Default | Description |
|---|---|---|
| v_input_int_1 | 10 | ATR Length |
| v_input_float_1 | 3 | Factor |
Source (PineScript)
/*backtest
start: 2023-03-23 00:00:00
end: 2024-03-28 00:00:00
period: 1d
basePeriod: 1h
exchanges: [{"eid":"Futures_Binance","currency":"BTC_USDT"}]
*/

//@version=5
strategy("EMA-MACD-SuperTrend-ADX-ATR Strategy",
     overlay = true,
     initial_capital = 1000,
     default_qty_type = strategy.percent_of_equity,
     default_qty_value = 70)

//MACD
[macdLine, signalLine, hist] = ta.macd(close, 12, 26, 9)
//Plot Candlesticks
candlestickscolor = (hist >= 0 ? (hist[1] < hist ? #26A69A : #B2DFDB) : (hist[1] < hist ? #FFCDD2 : #FF5252))
plotcandle(open, high, low, close,
     color = candlestickscolor,
     bordercolor = candlestickscolor)

//EMA
ema12 = ta.ema(close, 12)
ema26 = ta.ema(close, 26)

//Plot EMA
plot(ema26, color= #EE6969, linewidth = 2)
plot(ema12, color= #B4CBF0, linewidth = 2)

//Average Directional Index (ADX) Calculation
trueRange = ta.rma(ta.tr, 14)
plusDM = ta.rma(math.max(high - high[1], 0), 14)
minusDM = ta.rma(math.max(low[1] - low, 0), 14)
plusDI = 100 * ta.rma(plusDM / trueRange, 14)
minusDI = 100 * ta.rma(minusDM / trueRange, 14)
adxValue = 100  *ta.rma(math.abs(plusDI - minusDI) / (plusDI + minusDI), 14)

//Trend Confirmation (ADX)
trending = adxValue > 15

//Volatility Filter (ATR)
atrValue = ta.atr(14)
volatility = atrValue > 0.5 * ta.atr(20)

//SuperTrend
atrlength = input.int(10, "ATR Length", step = 1)
factor = input.float(3, "Factor", step = 0.1)
[supertrend, direction] = ta.supertrend(factor, atrlength)
supertrend := barstate.isfirst ? na : supertrend

//Plot SuperTrend
uptrend = plot(direction < 0 ? supertrend : na,
     "Up Trend", color = color.green, style = plot.style_linebr, linewidth = 1)

downtrend = plot(direction > 0 ? supertrend : na,
     "Down Trend", color = color.red, style = plot.style_linebr, linewidth = 1)
bodymiddle = plot(barstate.isfirst ? na : (open + close)/2, "Body Middle", display = display.none)
fill(bodymiddle, uptrend,   color.new(color.green, 90), fillgaps = false)
fill(bodymiddle, downtrend, color.new(color.red,   90), fillgaps = false)

//Entry Conditions
longCondition = ta.crossover(ema12, ema26) and trending and volatility and hist > 0

shortCondition = ta.crossunder(ema12, ema26)  and trending and volatility and hist < 0

long_SL_Con = ta.crossunder(close, supertrend)

short_SL_Con = ta.crossover(close, supertrend)

//Plot Signal
plotshape(longCondition,
     title='Buy', text='Buy',
     location= location.belowbar,
     style=shape.labelup, size=size.tiny,
     color=color.green, textcolor=color.new(color.white, 0))

plotshape(shortCondition,
     title='Sell', text='Sell',
     location= location.abovebar,
     style=shape.labeldown, size=size.tiny,
     color=color.red, textcolor=color.new(color.white, 0))

//Backtest
start = timestamp(2020, 1, 1, 0, 0, 0)
end = timestamp(2024, 1, 1, 0, 0, 0)
backtestperiod = time >= start and time <= end

if longCondition and backtestperiod
    strategy.entry("Buy", strategy.long)

if long_SL_Con and backtestperiod
    strategy.close("Buy")

if shortCondition and backtestperiod
    strategy.entry("Sell", strategy.short)

if short_SL_Con and backtestperiod
    strategy.close("Sell")
Detail
https://www.fmz.com/strategy/446549
Last Modified
2024-03-29 15:41:29