
13 KiB
Name
EMA-MACD-RSI-交叉策略-EMA-MACD-RSI-Crossover-Strategy
Author
ChaoZhang
Strategy Description
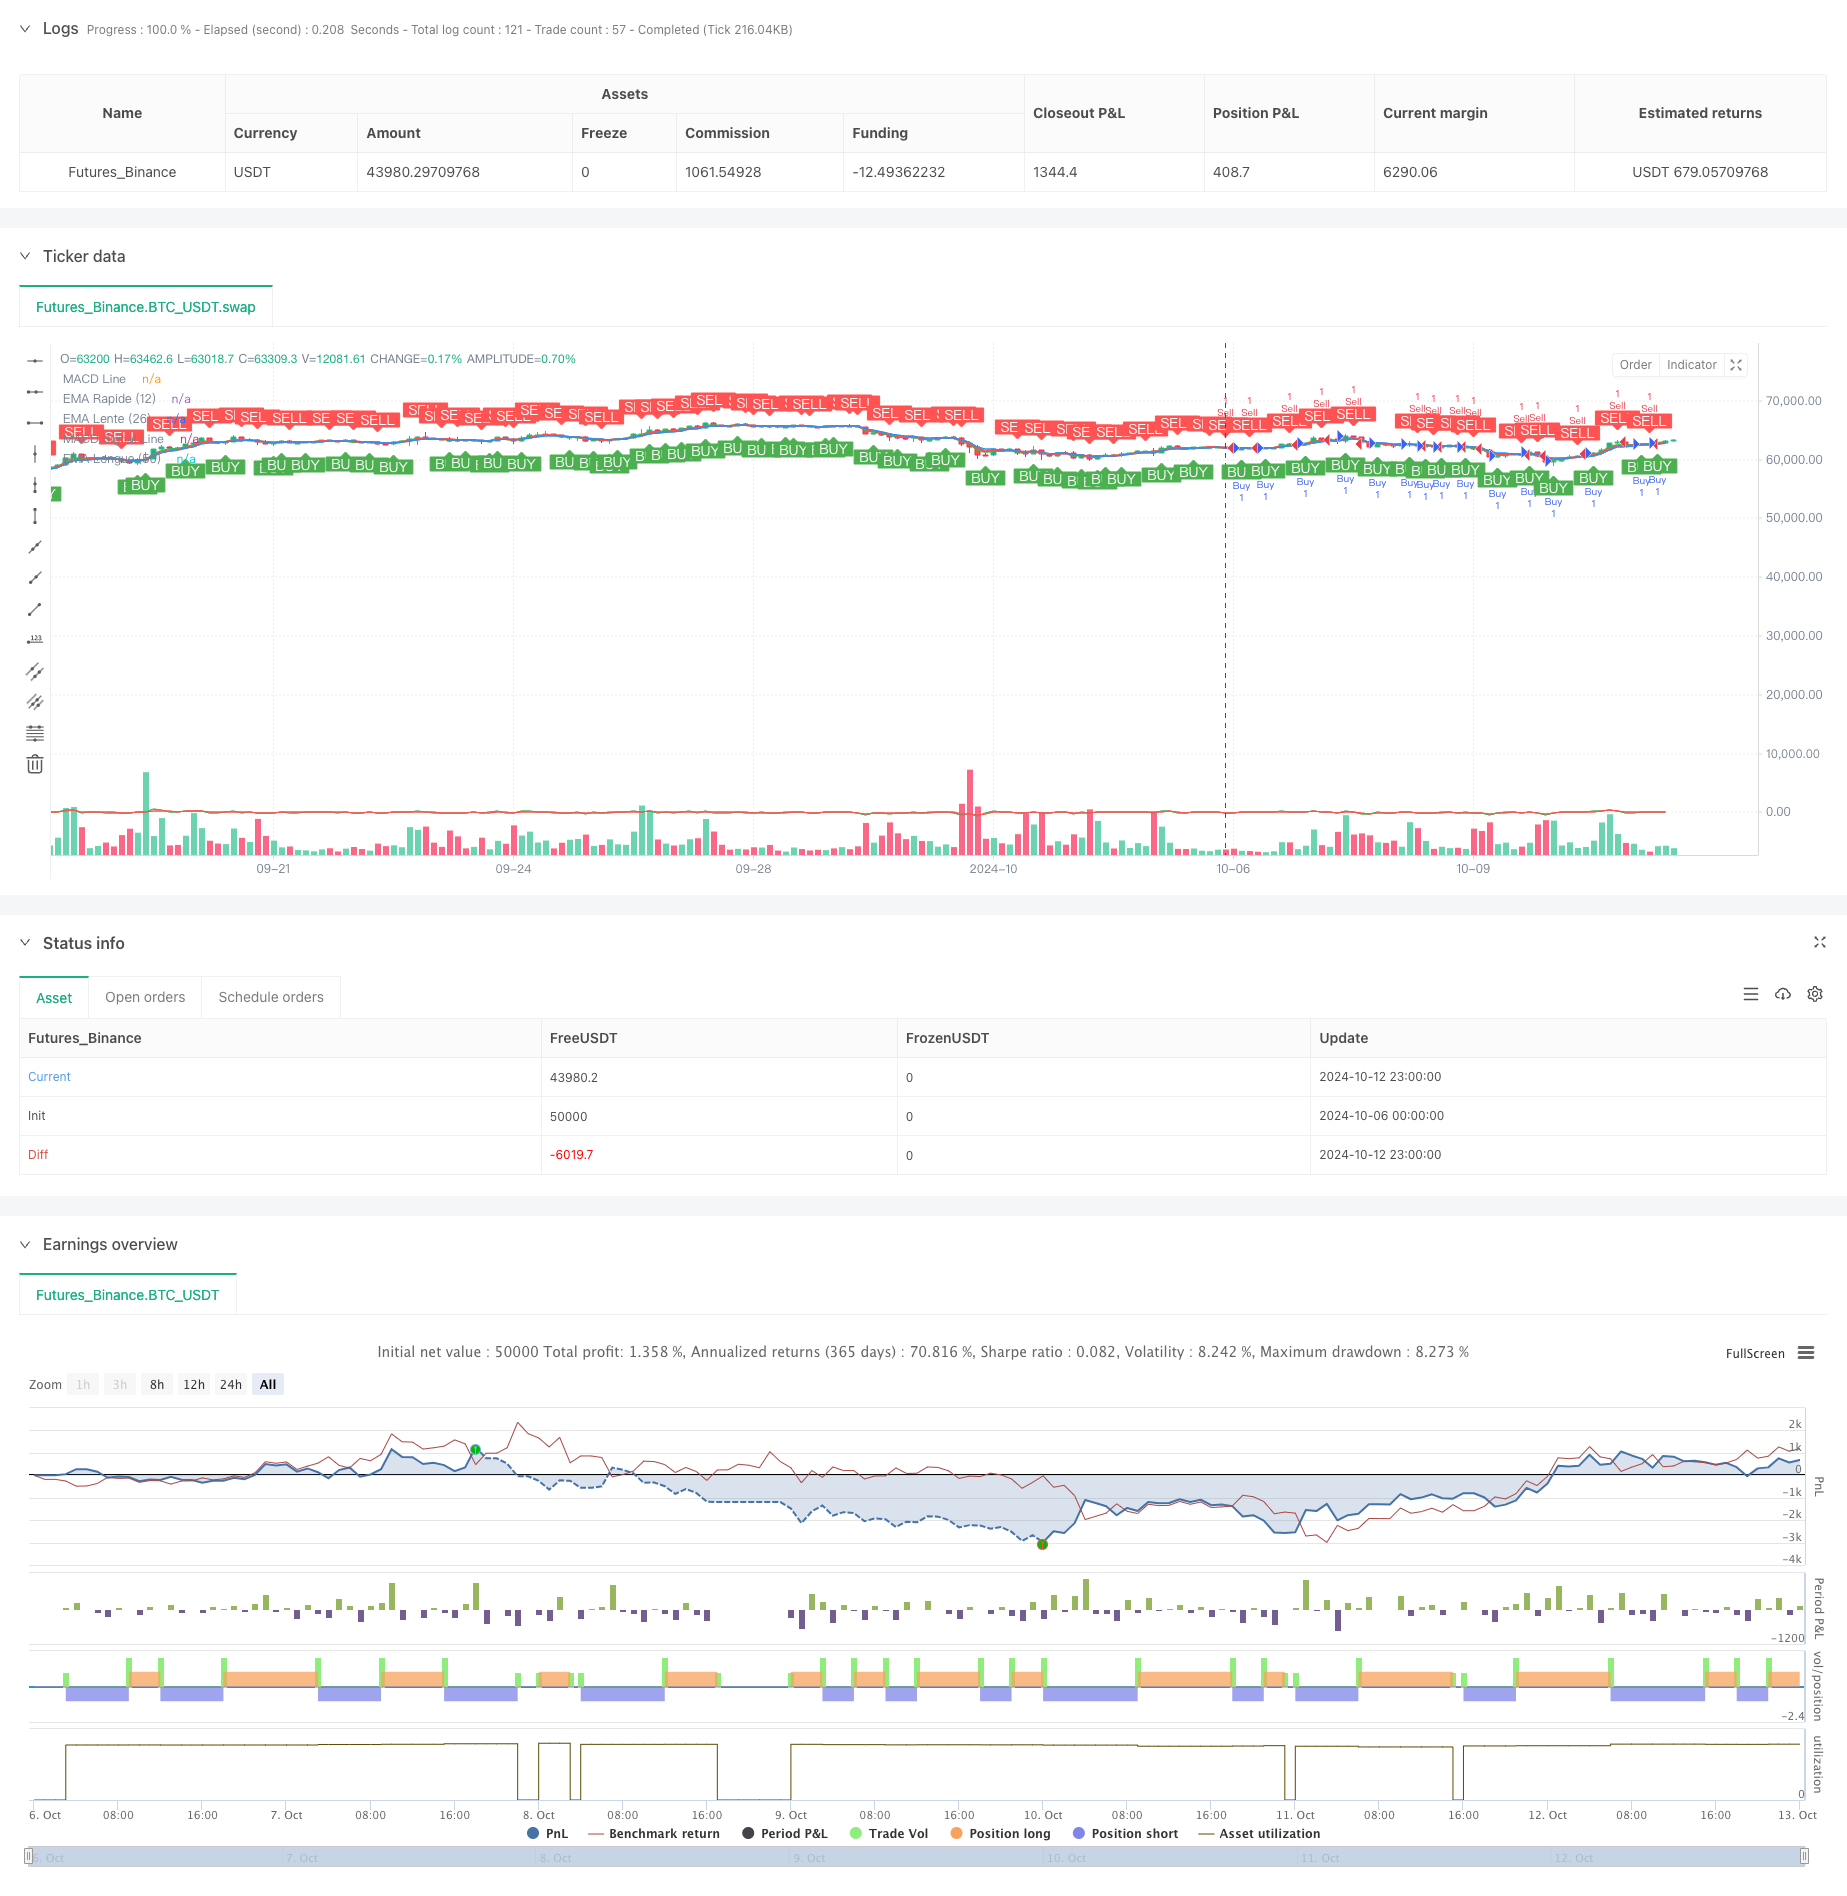
[trans]
概述
EMA/MACD/RSI交叉策略是一种结合多个技术指标的量化交易策略。该策略主要利用指数移动平均线(EMA)、移动平均线趋同散度指标(MACD)和相对强弱指数(RSI)的交叉信号来判断市场趋势和产生交易信号。策略还引入了平均真实波幅(ATR)来设置动态止损,有效控制风险。这种多指标结合的方法旨在提高交易信号的准确性和可靠性。
策略原理
该策略的核心原理是通过多重指标的交叉和配合来确定入场和出场时机:
- EMA交叉: 快速EMA与慢速EMA的交叉用于捕捉短期趋势变化。
- MACD交叉: MACD线与信号线的交叉用于确认中期趋势转折。
- RSI过滤: 使用RSI指标过滤掉可能的假突破,只在RSI不处于超买或超卖区域时执行交易。
- ATR止损: 利用ATR设置动态止损,根据市场波动调整止损位置。
买入条件是快速EMA上穿慢速EMA或MACD线上穿信号线,同时RSI高于超卖水平。卖出条件则相反。策略还通过检查当前持仓状态来避免重复开仓,提高资金利用效率。
策略优势
- 多指标结合: 通过结合EMA、MACD和RSI,策略能够从不同角度确认交易信号,降低误判风险。
- 趋势跟踪与反转兼顾: EMA和MACD的使用既能捕捉趋势,又能及时发现潜在的反转机会。
- 动态风险管理: 使用基于ATR的动态止损,使止损点能够根据市场波动性自动调整。
- 灵活性强: 策略参数可根据不同市场和时间框架进行调整,适应性强。
- 避免过度交易: 通过检查现有持仓来避免重复开仓,有助于控制交易频率和成本。
策略风险
- 震荡市表现欠佳: 在横盘震荡市场中,可能会产生频繁的假信号,导致过度交易和亏损。
- 参数敏感性: 策略性能高度依赖于EMA、MACD和RSI的参数设置,不同市场可能需要频繁调整。
- 滞后性: 作为滞后指标,EMA和MACD可能在剧烈波动的市场中反应不够及时。
- 信号冲突: 多个指标可能在某些时候给出相互矛盾的信号,增加决策难度。
- 过度依赖技术分析: 策略未考虑基本面因素,在重大新闻或事件影响下可能失效。
策略优化方向
- 引入波动率过滤: 可以考虑在高波动率环境下调整策略参数或暂停交易,以应对剧烈市场波动。
- 增加趋势强度判断: 引入ADX等趋势强度指标,在强趋势市场中采用更激进的策略,弱趋势市场中更保守。
- 优化止盈机制: 当前策略仅有止损设置,可以考虑加入基于ATR或固定百分比的止盈机制,锁定利润。
- 时间框架联动: 考虑在多个时间框架上验证信号,提高交易决策的可靠性。
- 加入成交量分析: 结合成交量指标,如OBV或CMF,以确认价格走势的有效性。
- 机器学习优化: 使用机器学习算法动态调整指标参数,提高策略对市场变化的适应性。
总结
EMA/MACD/RSI交叉策略是一种综合性强的技术分析交易系统,通过多指标的协同作用来识别交易机会和管理风险。该策略的主要优势在于其多维度的市场分析视角和灵活的风险管理机制。然而,使用者需要注意策略在不同市场环境下的表现差异,并针对具体交易品种和市场状况进行参数优化。通过持续改进和优化,如引入更多指标、优化止盈止损机制等,该策略有潜力成为一个稳健的量化交易工具。在实际应用中,建议进行充分的回测和模拟交易,并结合市场洞察和风险管理原则,以达到最佳的交易效果。
||
Overview
The EMA/MACD/RSI Crossover Strategy is a quantitative trading approach that combines multiple technical indicators. This strategy primarily utilizes crossover signals from Exponential Moving Averages (EMA), Moving Average Convergence Divergence (MACD), and Relative Strength Index (RSI) to assess market trends and generate trading signals. The strategy also incorporates the Average True Range (ATR) for setting dynamic stop-losses, effectively managing risk. This multi-indicator approach aims to enhance the accuracy and reliability of trading signals.
Strategy Principle
The core principle of this strategy is to determine entry and exit points through multiple indicator crossovers and combinations:
- EMA Crossover: The crossover of fast EMA and slow EMA is used to capture short-term trend changes.
- MACD Crossover: The crossover of MACD line and signal line confirms medium-term trend reversals.
- RSI Filter: The RSI indicator is used to filter out potential false breakouts, executing trades only when RSI is not in overbought or oversold territories.
- ATR Stop-Loss: ATR is used to set dynamic stop-losses, adjusting the stop-loss position based on market volatility.
The buy condition is triggered when the fast EMA crosses above the slow EMA or when the MACD line crosses above the signal line, while the RSI is above the oversold level. Sell conditions are the opposite. The strategy also checks the current position status to avoid duplicate entries, improving capital efficiency.
Strategy Advantages
- Multi-Indicator Integration: By combining EMA, MACD, and RSI, the strategy confirms trading signals from different perspectives, reducing the risk of false judgments.
- Balance of Trend Following and Reversal: The use of EMA and MACD allows for both trend capture and timely identification of potential reversals.
- Dynamic Risk Management: The ATR-based dynamic stop-loss enables automatic adjustment of stop points based on market volatility.
- High Flexibility: Strategy parameters can be adjusted for different markets and timeframes, offering strong adaptability.
- Avoidance of Overtrading: Checking existing positions prevents duplicate entries, helping control trading frequency and costs.
Strategy Risks
- Poor Performance in Sideways Markets: In range-bound markets, the strategy may generate frequent false signals, leading to overtrading and losses.
- Parameter Sensitivity: Strategy performance is highly dependent on the parameter settings of EMA, MACD, and RSI, potentially requiring frequent adjustments for different markets.
- Lag: As lagging indicators, EMA and MACD may not respond quickly enough in highly volatile markets.
- Signal Conflicts: Multiple indicators may sometimes give contradictory signals, increasing decision-making complexity.
- Overreliance on Technical Analysis: The strategy does not consider fundamental factors and may fail under the influence of significant news or events.
Strategy Optimization Directions
- Incorporate Volatility Filtering: Consider adjusting strategy parameters or pausing trading in high volatility environments to handle extreme market fluctuations.
- Add Trend Strength Assessment: Introduce trend strength indicators like ADX, adopting more aggressive strategies in strong trend markets and more conservative approaches in weak trend markets.
- Optimize Profit-Taking Mechanism: The current strategy only has stop-loss settings. Consider adding ATR-based or fixed percentage profit-taking mechanisms to lock in gains.
- Timeframe Synergy: Consider validating signals across multiple timeframes to enhance trading decision reliability.
- Include Volume Analysis: Integrate volume indicators such as OBV or CMF to confirm the validity of price movements.
- Machine Learning Optimization: Use machine learning algorithms to dynamically adjust indicator parameters, improving the strategy's adaptability to market changes.
Conclusion
The EMA/MACD/RSI Crossover Strategy is a comprehensive technical analysis trading system that identifies trading opportunities and manages risks through the synergy of multiple indicators. The main advantages of this strategy lie in its multidimensional market analysis perspective and flexible risk management mechanism. However, users need to be aware of the strategy's performance differences in various market environments and optimize parameters for specific trading instruments and market conditions. Through continuous improvement and optimization, such as introducing more indicators and refining profit-taking and stop-loss mechanisms, this strategy has the potential to become a robust quantitative trading tool. In practical application, it is recommended to conduct thorough backtesting and simulated trading, combined with market insights and risk management principles, to achieve optimal trading results.
[/trans]
Source (PineScript)
/*backtest
start: 2024-10-06 00:00:00
end: 2024-10-13 00:00:00
period: 3h
basePeriod: 3h
exchanges: [{"eid":"Futures_Binance","currency":"BTC_USDT"}]
*/

//@version=5
strategy("Mister Buy / sell signals", overlay=true, shorttitle="Mister Buy / sell signals")

// ─────────────────────────────────────────────────────────────
// Paramètres des EMA et adaptation selon le timeframe
ema_fast_length = input(3, title="EMA Rapide (12)")
ema_slow_length = input(4, title="EMA Lente (26)")
ema_long_length = input(5, title="EMA Longue (50)")

// Paramètres MACD
macd_fast_length = input(1, title="MACD Période Rapide")
macd_slow_length = input(2, title="MACD Période Lente")
macd_signal_length = input(3, title="MACD Signal (9)")

// Paramètres RSI
rsi_length = input(42, title="RSI Période")
rsi_overbought = input(70, title="RSI Zone de surachat")
rsi_oversold = input(30, title="RSI Zone de survente")

// Paramètres ATR
atr_length = input(12, title="ATR Période")
atr_multiplier = input(1.0, title="Multiplicateur ATR pour Stop")

// ─────────────────────────────────────────────────────────────
// Calcul des EMA
ema_fast = ta.ema(close, ema_fast_length)
ema_slow = ta.ema(close, ema_slow_length)
ema_long = ta.ema(close, ema_long_length)

// Calcul du RSI
rsi = ta.rsi(close, rsi_length)

// Calcul du MACD
[macdLine, signalLine, _] = ta.macd(close, macd_fast_length, macd_slow_length, macd_signal_length)

// Calcul de l'ATR pour gérer les stops
atr_value = ta.atr(atr_length)

// ─────────────────────────────────────────────────────────────
// Conditions d'achat et de vente basées sur MACD, EMA et RSI
buy_condition = (ta.crossover(ema_fast, ema_slow) or ta.crossover(macdLine, signalLine)) and rsi > rsi_oversold
sell_condition = (ta.crossunder(ema_fast, ema_slow) or ta.crossunder(macdLine, signalLine)) and rsi < rsi_overbought

// ─────────────────────────────────────────────────────────────
// Vérification des positions ouvertes pour éviter les doublons
long_position = strategy.position_size > 0  // Position d'achat ouverte
short_position = strategy.position_size < 0  // Position de vente ouverte

// ─────────────────────────────────────────────────────────────
// Gestion des positions et Stop Loss
long_stop = close - atr_value * atr_multiplier
short_stop = close + atr_value * atr_multiplier

// Entrer les positions uniquement si aucune position n'est ouverte dans la même direction
if (buy_condition and not long_position)
    strategy.entry("Buy", strategy.long)
    strategy.exit("Exit Buy", from_entry="Buy", stop=long_stop)

if (sell_condition and not short_position)
    strategy.entry("Sell", strategy.short)
    strategy.exit("Exit Sell", from_entry="Sell", stop=short_stop)

// ─────────────────────────────────────────────────────────────
// Affichage des EMA et du MACD sur le graphique
plot(ema_fast, color=color.green, linewidth=2, title="EMA Rapide (12)")
plot(ema_slow, color=color.red, linewidth=2, title="EMA Lente (26)")
plot(ema_long, color=color.blue, linewidth=1, title="EMA Longue (50)")

plot(macdLine, color=color.green, title="MACD Line")
plot(signalLine, color=color.red, title="MACD Signal Line")

// ─────────────────────────────────────────────────────────────
// Signaux graphiques pour les points d'entrée et de sortie
// Affichage des signaux d'achat si aucune position Buy n'est active
plotshape(series=buy_condition and not long_position, title="Signal Achat", location=location.belowbar, color=color.green, style=shape.labelup, text="BUY", textcolor=color.white)

// Affichage des signaux de vente si aucune position Sell n'est active
plotshape(series=sell_condition and not short_position, title="Signal Vente", location=location.abovebar, color=color.red, style=shape.labeldown, text="SELL", textcolor=color.white)
Detail
https://www.fmz.com/strategy/469622
Last Modified
2024-10-14 12:22:58