
12 KiB
Name
EMA-200-交叉量价趋势策略EMA-200-Crossover-with-Volume-and-Trend-Strategy
Author
ChaoZhang
Strategy Description
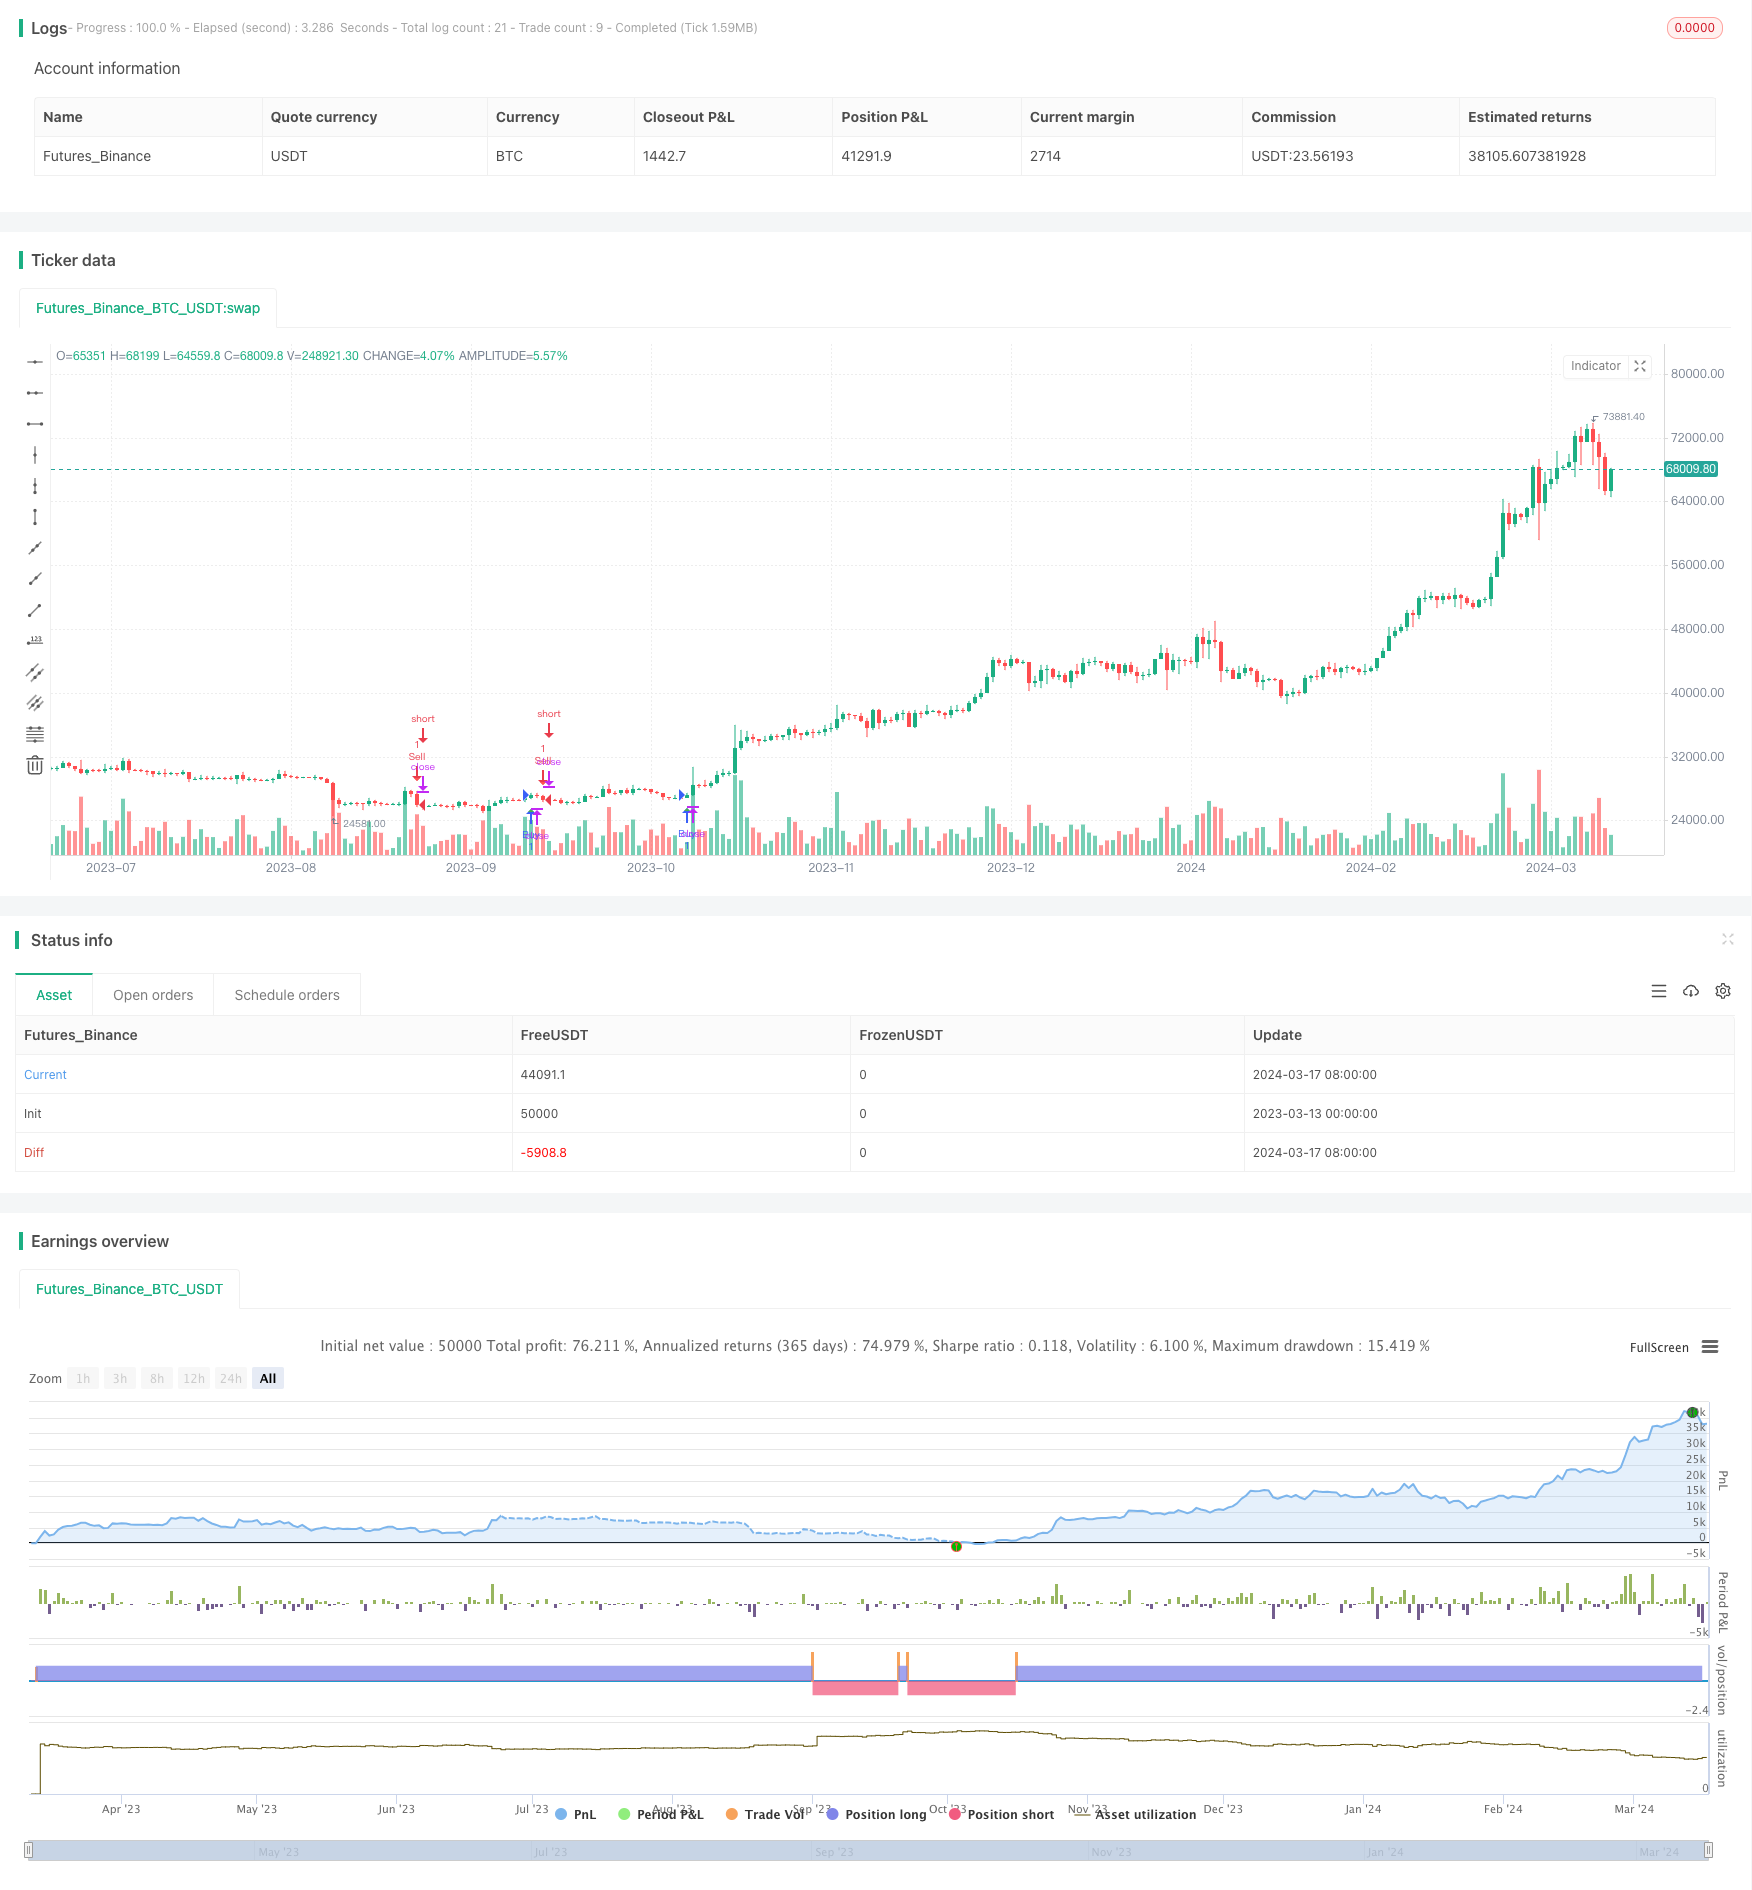 [trans]
策略概述
Jurik 50-100 EMA 200 交叉量价趋势策略是一个基于Jurik移动平均线和指数移动平均线(EMA)交叉,结合成交量和价格趋势确认的交易策略。该策略使用Jurik移动平均线(周期为50)和EMA(周期为200)的交叉来产生买卖信号,同时考虑成交量条件和趋势方向进行确认。
策略原理
该策略的核心是利用两条不同周期的移动平均线的交叉来捕捉潜在的趋势变化。具体来说:
-
当价格向上突破Jurik和EMA移动平均线,并且当前蜡烛线收盘价高于EMA时,在高成交量和上升趋势的确认下,产生买入信号。
-
当价格向下突破Jurik和EMA移动平均线,并且当前蜡烛线收盘价低于EMA时,在高成交量和下降趋势的确认下,产生卖出信号。
该策略使用Jurik移动平均线,旨在对价格变化做出更敏感的反应。同时,使用EMA作为长期趋势的参考。通过结合成交量分析和趋势确认,该策略试图在趋势形成的早期阶段就识别出潜在的入场点。
策略优势
-
趋势跟踪:通过使用不同周期的移动平均线交叉,该策略能够有效地捕捉潜在的趋势变化,帮助交易者顺应市场趋势。
-
成交量确认:该策略将成交量作为确认因素之一,以验证价格突破的有效性。高成交量表明市场参与者的兴趣和趋势的持续性。
-
风险管理:该策略纳入了固定风险因子,根据用户定义的风险承受能力来确定仓位大小,有助于控制风险。
-
可视化:该策略在图表上绘制买卖信号,直观地显示潜在的入场点,方便交易者进行决策。
策略风险
-
假突破:在某些情况下,价格可能会出现短暂的突破,但随后迅速反转,导致错误的交易信号。
-
市场噪音:短期内市场的波动性可能会导致频繁的交易信号,增加交易成本和错误信号的风险。
-
趋势反转:该策略在趋势形成的早期阶段进行交易,但如果趋势突然反转,可能会导致损失。
为了应对这些风险,交易者可以考虑结合其他技术指标或过滤条件,如使用更长时间周期的移动平均线来确认趋势,或设置适当的止损和止盈位来管理风险。
策略优化方向
-
参数优化:对Jurik移动平均线和EMA的周期进行优化测试,找到在不同市场条件下表现最佳的参数组合。
-
多时间周期确认:考虑在多个时间周期上进行信号确认,以过滤掉一些假突破和短期噪音。
-
动态风险管理:根据市场波动性或其他风险指标,动态调整风险因子和仓位大小,以更好地适应不同的市场环境。
-
组合其他指标:将该策略与其他技术指标或市场情绪指标相结合,以提高信号的可靠性和准确性。
通过以上优化方向,可以提高策略的鲁棒性和适应性,更好地应对不同的市场条件。
策略总结
Jurik 50-100 EMA 200 交叉量价趋势策略是一个基于移动平均线交叉,结合成交量和趋势确认的交易策略。该策略利用Jurik移动平均线对价格变化的敏感性和EMA对长期趋势的捕捉能力,试图在趋势形成的早期阶段识别潜在的入场机会。通过成交量的确认和趋势方向的验证,该策略旨在提高交易信号的可靠性。同时,固定风险因子的纳入有助于控制风险。
尽管该策略有其优势,但也存在假突破、市场噪音和趋势反转等风险。为了应对这些风险并进一步提升策略表现,交易者可以考虑对策略进行优化,如参数优化、多时间周期确认、动态风险管理和组合其他指标等方法。
总的来说,Jurik 50-100 EMA 200 交叉量价趋势策略提供了一个基于移动平均线和成交量的交易框架,通过趋势跟踪和风险管理,力求在动态的市场环境中捕捉潜在的交易机会。交易者可以根据自己的风险偏好和交易风格,对该策略进行适当的调整和优化,以期获得更好的交易表现。
||
Strategy Overview
The Jurik 50-100 EMA 200 Crossover with Volume and Trend strategy is a trading strategy based on the crossover between the Jurik moving average and the Exponential Moving Average (EMA), combined with volume conditions and trend confirmation. The strategy uses the crossover of the Jurik moving average (with a period of 50) and the EMA (with a period of 200) to generate buy and sell signals, while considering volume conditions and trend direction for confirmation.
Strategy Principle
The core of this strategy is to utilize the crossover of two moving averages with different periods to capture potential trend changes. Specifically:
-
When the price crosses above both the Jurik and EMA moving averages, and the current candle's close price is above the EMA, a buy signal is generated under the confirmation of high volume conditions and an uptrend.
-
When the price crosses below both the Jurik and EMA moving averages, and the current candle's close price is below the EMA, a sell signal is generated under the confirmation of high volume conditions and a downtrend.
The strategy employs the Jurik moving average, which is designed to be more responsive to price changes. Meanwhile, the EMA is used as a reference for the long-term trend. By combining volume analysis and trend confirmation, the strategy aims to identify potential entry points in the early stages of trend formation.
Strategy Advantages
-
Trend Following: By using the crossover of moving averages with different periods, the strategy can effectively capture potential trend changes, helping traders align with market trends.
-
Volume Confirmation: The strategy incorporates volume as one of the confirmation factors to validate the effectiveness of price breakouts. High volume indicates interest from market participants and the sustainability of the trend.
-
Risk Management: The strategy includes a fixed risk factor, determining the position size based on the user's defined risk tolerance, which helps control risk.
-
Visualization: The strategy plots buy and sell signals on the chart, visually indicating potential entry points, making it convenient for traders to make decisions.
Strategy Risks
-
False Breakouts: In some cases, the price may experience temporary breakouts but quickly reverse, leading to false trading signals.
-
Market Noise: Short-term market volatility may cause frequent trading signals, increasing trading costs and the risk of false signals.
-
Trend Reversal: The strategy trades in the early stages of trend formation, but if the trend suddenly reverses, it may lead to losses.
To address these risks, traders can consider combining other technical indicators or filtering conditions, such as using moving averages with longer time periods to confirm trends, or setting appropriate stop-loss and take-profit levels to manage risk.
Strategy Optimization Directions
-
Parameter Optimization: Optimize the periods of the Jurik moving average and EMA through testing to find the best-performing parameter combinations under different market conditions.
-
Multi-Timeframe Confirmation: Consider confirming signals on multiple timeframes to filter out false breakouts and short-term noise.
-
Dynamic Risk Management: Dynamically adjust the risk factor and position size based on market volatility or other risk indicators to better adapt to different market environments.
-
Combining Other Indicators: Combine the strategy with other technical indicators or market sentiment indicators to improve the reliability and accuracy of signals.
By implementing these optimization directions, the robustness and adaptability of the strategy can be enhanced to better cope with different market conditions.
Strategy Summary
The Jurik 50-100 EMA 200 Crossover with Volume and Trend strategy is a trading strategy based on moving average crossovers, combined with volume confirmation and trend validation. The strategy leverages the sensitivity of the Jurik moving average to price changes and the ability of EMA to capture long-term trends, aiming to identify potential entry opportunities in the early stages of trend formation. By confirming with volume and validating trend direction, the strategy seeks to improve the reliability of trading signals. The inclusion of a fixed risk factor helps control risk.
Although the strategy has its advantages, it also faces risks such as false breakouts, market noise, and trend reversals. To address these risks and further enhance the strategy's performance, traders can consider optimizing the strategy through methods such as parameter optimization, multi-timeframe confirmation, dynamic risk management, and combining other indicators.
Overall, the Jurik 50-100 EMA 200 Crossover with Volume and Trend strategy provides a trading framework based on moving averages and volume, aiming to capture potential trading opportunities in dynamic market environments through trend following and risk management. Traders can make appropriate adjustments and optimizations to the strategy based on their risk preferences and trading styles, seeking to achieve better trading performance.
[/trans]
Strategy Arguments
| Argument | Default | Description |
|---|---|---|
| v_input_int_1 | 50 | Periodo Jurik |
| v_input_int_2 | 200 | Periodo EMA |
| v_input_float_1 | 10000 | Volume Threshold |
| v_input_float_2 | 3 | Risk Factor |
Source (PineScript)
/*backtest
start: 2023-03-13 00:00:00
end: 2024-03-18 00:00:00
period: 1d
basePeriod: 1h
exchanges: [{"eid":"Futures_Binance","currency":"BTC_USDT"}]
*/

//@version=5
strategy("Jurik 50-100 EMA 200 Crossover with Volume and Trend", shorttitle="Jurik50-100_EMA200_Vol_Trend", overlay=true)

// Impostazione dei periodi per le medie mobili
jurik_periodo = input.int(50, title="Periodo Jurik", minval=1)
ema_periodo = input.int(200, title="Periodo EMA", minval=1)
vol_threshold = input.float(10000, title="Volume Threshold", minval=0)
risk_factor = input.float(3, title="Risk Factor", minval=0)

// Calcola la media mobile Jurik con fase 100
calcola_media_mobile_jurik(source, length) =>
    alpha = 0.5 // Valore fittizio per alpha
    sum1 = 0.0
    sum2 = 0.0
    for i = 0 to length - 1
        sum1 := sum1 + (1 - alpha) * math.pow(alpha, i) * source[i]
        sum2 := sum2 + (1 - alpha) * math.pow(alpha, i)
    sum1 / sum2

// Calcola la media mobile esponenziale (EMA)
ema = ta.ema(close, ema_periodo)

// Calcola la media mobile Jurik
jurik = calcola_media_mobile_jurik(close, jurik_periodo)

// Calcola il volume
volume_cond = volume > vol_threshold

// Condizione di uptrend e downtrend
uptrend = ta.crossover(close, ema) and volume_cond
downtrend = ta.crossunder(close, ema) and volume_cond

// Segnali di ingresso
long_condition = uptrend and ta.crossover(jurik, ema) and close > ema and jurik < close
short_condition = downtrend and ta.crossunder(jurik, ema) and close < ema and jurik > close

// Calcola la dimensione della posizione considerando il fattore di rischio
risk_position_size = 1

// Genera segnali di trading con dimensione della posizione basata sul rischio
strategy.entry("Buy", strategy.long, when=long_condition, qty=risk_position_size)
strategy.entry("Sell", strategy.short, when=short_condition, qty=risk_position_size)

// Etichetta dei segnali di ingresso
plotshape(series=long_condition, title="Buy Signal", location=location.belowbar, color=color.green, style=shape.triangleup, size=size.small)
plotshape(series=short_condition, title="Sell Signal", location=location.abovebar, color=color.red, style=shape.triangledown, size=size.small)
Detail
https://www.fmz.com/strategy/445457
Last Modified
2024-03-19 15:58:22