
11 KiB
Name
EMA-交叉动态止盈止损交易策略-EMA-Crossover-Trading-Strategy-with-Dynamic-Take-Profit-and-Stop-Loss
Author
ChaoZhang
Strategy Description
 [trans]
概述
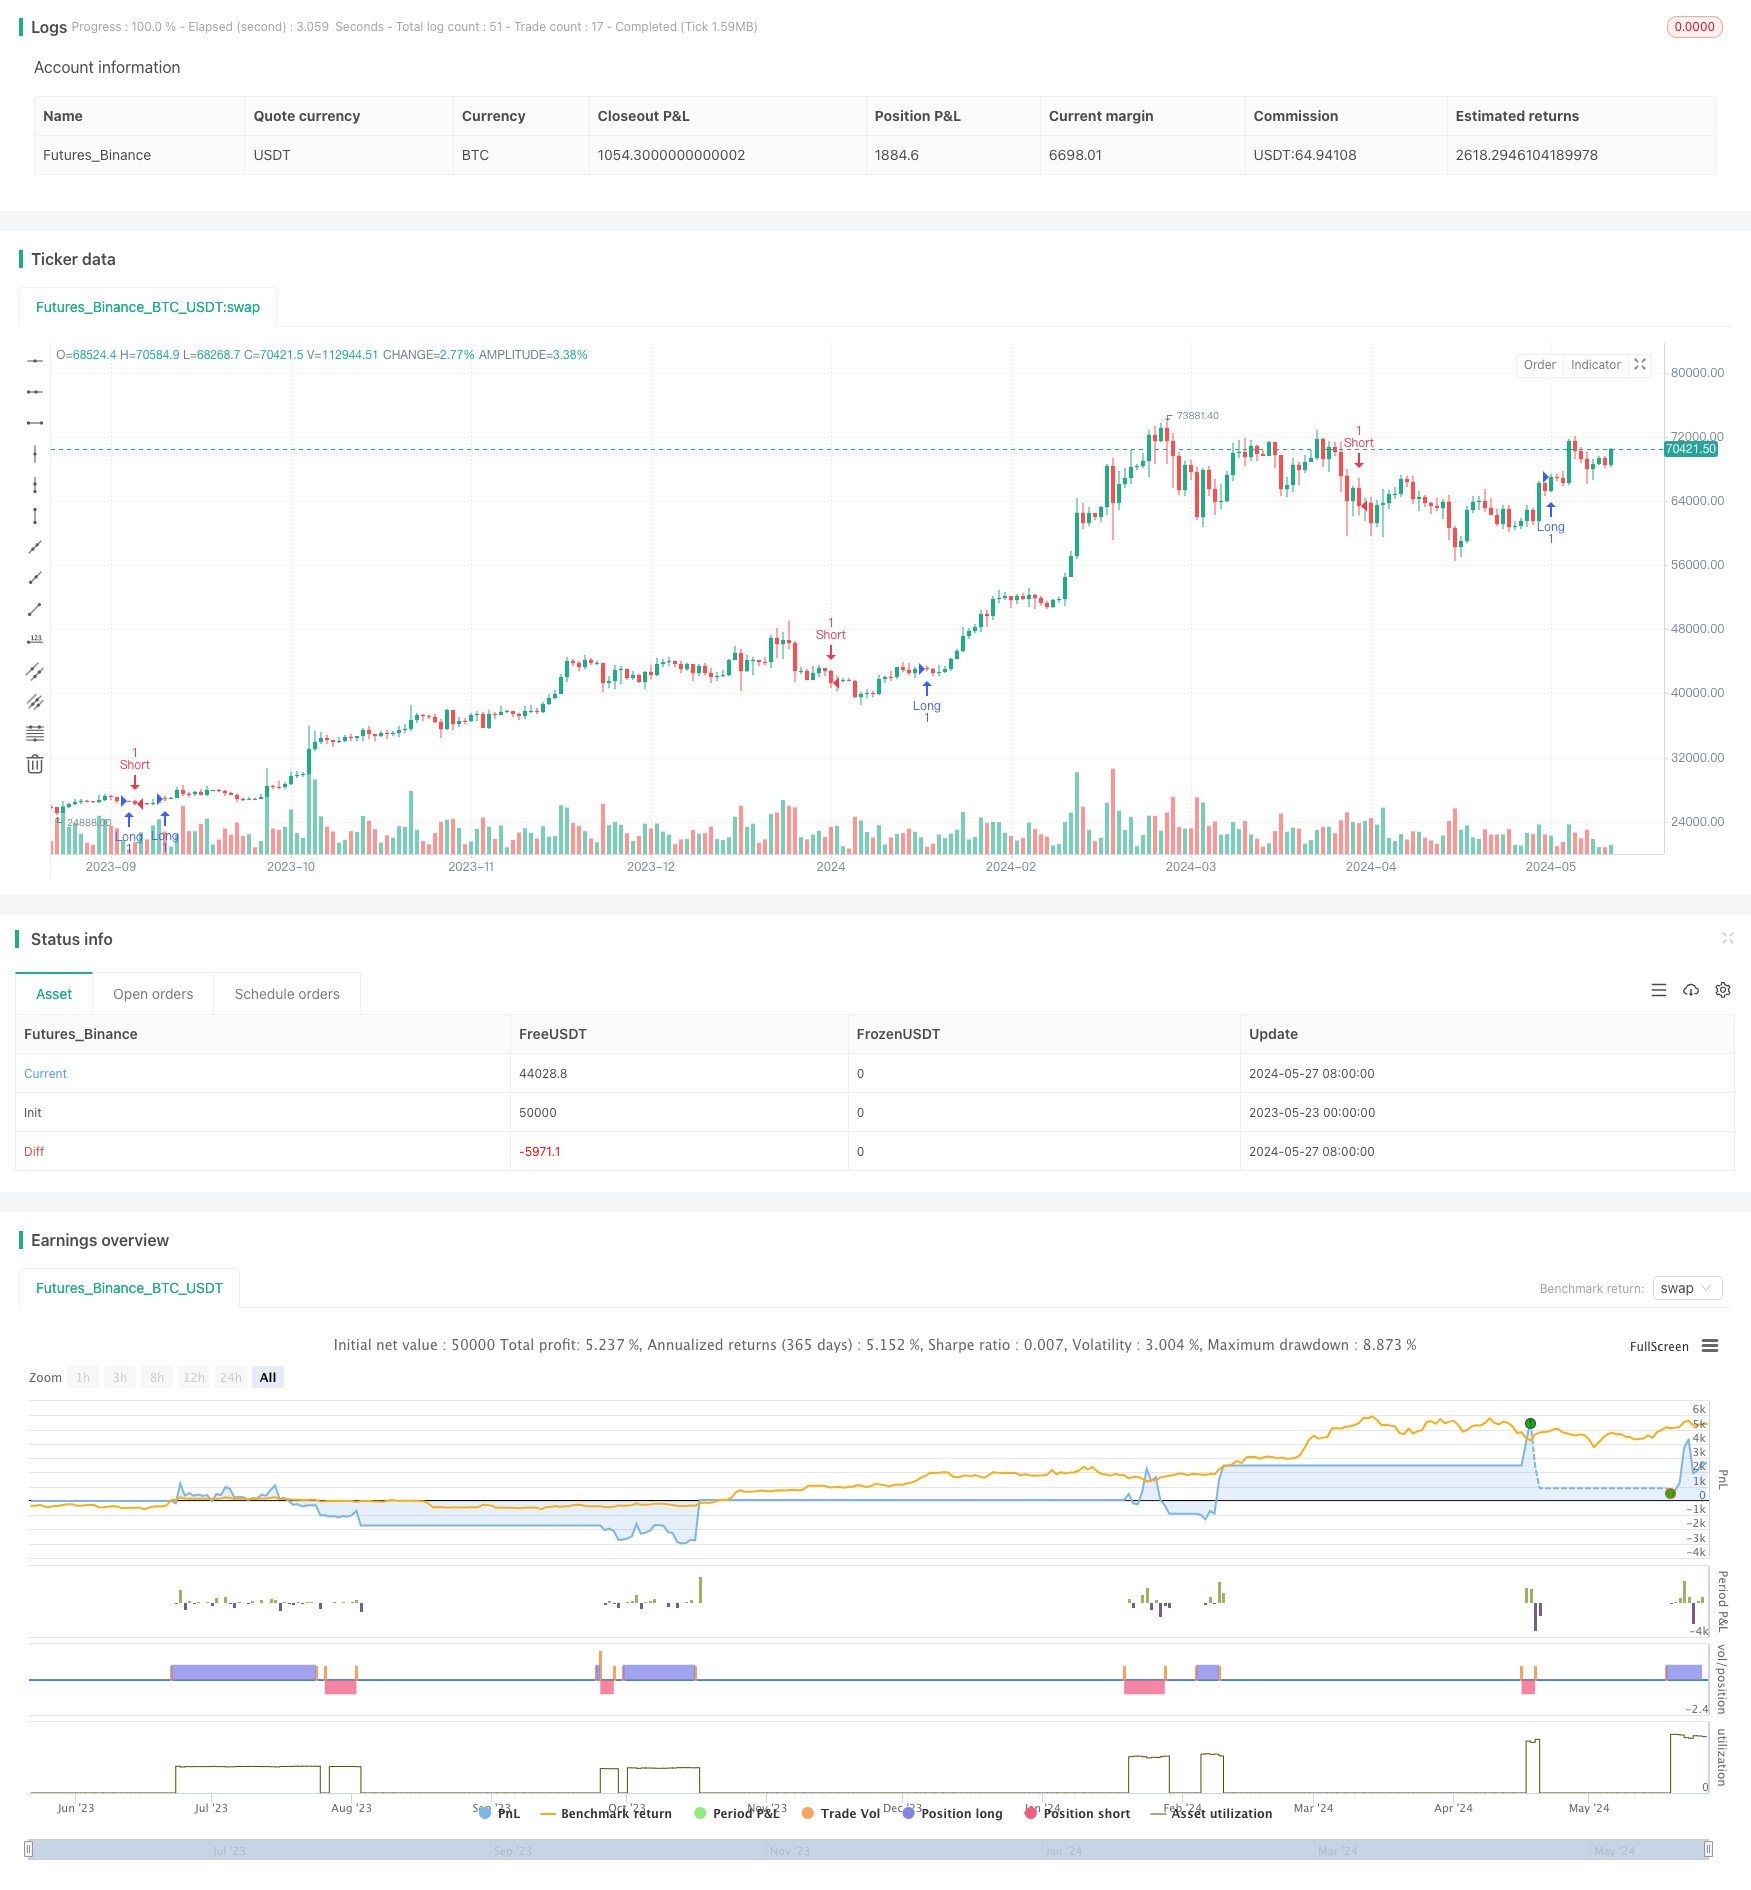
该策略利用指数移动平均线(EMA)的交叉来产生交易信号,同时动态设置止盈和止损水平。当较短周期的EMA(EMA 12)从下方越过较长周期的EMA(EMA 26)时,产生买入信号;反之,当EMA 12从上方跌破EMA 26时,产生卖出信号。该策略对多头和空头头寸分别设置不同的动态止盈和止损水平。对于多头头寸,止盈设置在入场价格上方8%,止损设置在入场价格下方2.5%;对于空头头寸,止盈设置在入场价格下方8%,止损设置在入场价格上方2.5%。
策略原理
该策略的核心是利用两条不同周期的指数移动平均线(EMA)的交叉来产生交易信号。EMA是一种趋势跟踪指标,能够平滑价格数据,减少噪音干扰。当较短周期的EMA从下方越过较长周期的EMA时,表明价格走势转强,产生买入信号;反之,当较短周期的EMA从上方跌破较长周期的EMA时,表明价格走势转弱,产生卖出信号。
同时,该策略采用动态止盈止损的方法,根据当前头寸的方向(多头或空头),设置不同的止盈和止损水平。这种动态调整止盈止损的方法,能够在趋势较强时让利润充分扩大,同时在价格出现逆转时及时止损,从而更好地控制风险。
策略优势
-
简单易用:该策略仅使用两条EMA线的交叉来产生交易信号,逻辑清晰,易于理解和实现。
-
趋势跟踪:EMA指标具有良好的趋势跟踪能力,能够有效捕捉价格的主要趋势。
-
动态止盈止损:根据头寸方向动态调整止盈和止损水平,能够在趋势较强时让利润充分扩大,同时在价格出现逆转时及时止损,更好地控制风险。
-
适应性强:该策略适用于不同的市场环境和交易品种,具有较强的适应性和灵活性。
策略风险
-
参数优化风险:EMA周期的选择以及止盈止损比例的设置都需要根据具体市场环境和交易品种进行优化,不恰当的参数设置可能导致策略表现不佳。
-
频繁交易风险:当市场处于震荡状态时,EMA交叉可能会频繁发生,导致策略产生较多的交易信号,增加交易成本和风险。
-
趋势逆转风险:当市场趋势发生突然逆转时,该策略可能会产生错误的交易信号,导致损失。
策略优化方向
-
引入其他技术指标:可以考虑引入其他技术指标,如RSI、MACD等,以辅助EMA交叉信号的确认,提高交易信号的可靠性。
-
优化参数设置:通过对EMA周期以及止盈止损比例进行优化测试,找到适合特定市场环境和交易品种的最佳参数组合。
-
引入风险控制措施:考虑引入风险控制措施,如仓位管理、资金管理等,以更好地控制交易风险。
-
结合基本面分析:将技术分析与基本面分析相结合,综合考虑市场环境、经济数据等因素,以提高交易决策的准确性。
总结
该策略利用EMA交叉来产生交易信号,并采用动态止盈止损的方法来控制风险。它具有简单易用、趋势跟踪、适应性强等优势,但同时也面临参数优化风险、频繁交易风险和趋势逆转风险等挑战。通过引入其他技术指标、优化参数设置、引入风险控制措施以及结合基本面分析等方法,可以进一步优化该策略的性能,提高其在实际交易中的适用性和盈利能力。
||
Overview
This strategy utilizes the crossover of Exponential Moving Averages (EMAs) to generate trading signals while dynamically setting take profit and stop loss levels. When the shorter-term EMA (EMA 12) crosses above the longer-term EMA (EMA 26), a buy signal is generated; conversely, when the EMA 12 crosses below the EMA 26, a sell signal is generated. The strategy sets different dynamic take profit and stop loss levels for long and short positions. For long positions, the take profit is set at 8% above the entry price, and the stop loss is set at 2.5% below the entry price; for short positions, the take profit is set at 8% below the entry price, and the stop loss is set at 2.5% above the entry price.
Strategy Principle
The core of this strategy is to use the crossover of two EMAs with different periods to generate trading signals. EMA is a trend-following indicator that smooths price data and reduces noise interference. When the shorter-term EMA crosses above the longer-term EMA, it indicates a strengthening price trend and generates a buy signal; conversely, when the shorter-term EMA crosses below the longer-term EMA, it indicates a weakening price trend and generates a sell signal.
At the same time, the strategy employs a dynamic take profit and stop loss method, setting different take profit and stop loss levels based on the direction of the current position (long or short). This method of dynamically adjusting take profit and stop loss levels allows profits to fully expand when the trend is strong while timely cutting losses when prices reverse, thereby better controlling risks.
Strategy Advantages
-
Simple and easy to use: The strategy only uses the crossover of two EMA lines to generate trading signals, with clear logic and easy to understand and implement.
-
Trend following: The EMA indicator has good trend-following capabilities and can effectively capture the main trends of prices.
-
Dynamic take profit and stop loss: By dynamically adjusting take profit and stop loss levels based on the position direction, it allows profits to fully expand when the trend is strong while timely cutting losses when prices reverse, better controlling risks.
-
Strong adaptability: The strategy is applicable to different market environments and trading instruments, with strong adaptability and flexibility.
Strategy Risks
-
Parameter optimization risk: The selection of EMA periods and the setting of take profit and stop loss ratios need to be optimized according to specific market environments and trading instruments. Inappropriate parameter settings may lead to poor strategy performance.
-
Frequent trading risk: When the market is in a volatile state, EMA crossovers may occur frequently, causing the strategy to generate more trading signals and increase trading costs and risks.
-
Trend reversal risk: When the market trend reverses suddenly, the strategy may generate incorrect trading signals, leading to losses.
Strategy Optimization Directions
-
Introduce other technical indicators: Consider introducing other technical indicators, such as RSI and MACD, to assist in confirming EMA crossover signals and improve the reliability of trading signals.
-
Optimize parameter settings: Find the best parameter combination suitable for specific market environments and trading instruments by optimizing and testing EMA periods and take profit and stop loss ratios.
-
Introduce risk control measures: Consider introducing risk control measures, such as position management and capital management, to better control trading risks.
-
Combine with fundamental analysis: Combine technical analysis with fundamental analysis, comprehensively considering market environment, economic data, and other factors to improve the accuracy of trading decisions.
Summary
This strategy uses EMA crossovers to generate trading signals and employs a dynamic take profit and stop loss method to control risks. It has advantages such as simplicity, trend-following, and strong adaptability, but also faces challenges such as parameter optimization risk, frequent trading risk, and trend reversal risk. By introducing other technical indicators, optimizing parameter settings, introducing risk control measures, and combining with fundamental analysis, the performance of this strategy can be further optimized to improve its applicability and profitability in actual trading.
[/trans]
Source (PineScript)
/*backtest
start: 2023-05-23 00:00:00
end: 2024-05-28 00:00:00
period: 1d
basePeriod: 1h
exchanges: [{"eid":"Futures_Binance","currency":"BTC_USDT"}]
*/

//@version=5
strategy("CDC Action Zone Trading Bot with Dynamic TP/SL", overlay=true)

// ดึงข้อมูลราคาปัจจุบัน
current_price = close

// คำนวณเส้น EMA 12 และ EMA 26
ema12 = ta.ema(current_price, 12)
ema26 = ta.ema(current_price, 26)

// กำหนดเปอร์เซ็นต์ Take Profit และ Stop Loss
takeProfitPercent = 0.080
stopLossPercent = 0.025

// คำนวณระดับ Take Profit และ Stop Loss
longTakeProfit = strategy.position_avg_price * (1 + takeProfitPercent)
longStopLoss = strategy.position_avg_price * (1 - stopLossPercent)

shortTakeProfit = strategy.position_avg_price * (1 - takeProfitPercent)
shortStopLoss = strategy.position_avg_price * (1 + stopLossPercent)

// สัญญาณ Buy
buySignal = (ema12 > ema26) and (ema12[1] <= ema26[1])

// สัญญาณ Sell
sellSignal = (ema12 < ema26) and (ema12[1] >= ema26[1])

// เปิด Position Long
if (buySignal)
    strategy.entry("Long", strategy.long)

// เปิด Position Short
if (sellSignal)
    strategy.entry("Short", strategy.short)

// ปิด Position Long เมื่อถึง Take Profit หรือ Stop Loss
if (strategy.position_size > 0)
    strategy.exit("Long TP/SL", from_entry="Long", limit=longTakeProfit, stop=longStopLoss, comment="TP/SL")

// ปิด Position Short เมื่อถึง Take Profit หรือ Stop Loss
if (strategy.position_size < 0)
    strategy.exit("Short TP/SL", from_entry="Short", limit=shortTakeProfit, stop=shortStopLoss, comment="TP/SL")

// ปิด Position Long เมื่อเกิดสัญญาณขาย
if (strategy.position_size > 0 and sellSignal)
    strategy.close("Long", comment="Sell Signal")

// ปิด Position Short เมื่อเกิดสัญญาณซื้อ
if (strategy.position_size < 0 and buySignal)
    strategy.close("Short", comment="Buy Signal")

// Debugging messages to plot the calculated levels for visual verification
//plot(longTakeProfit, title="Long Take Profit", color=color.green, linewidth=1, style=plot.style_line)
//plot(longStopLoss, title="Long Stop Loss", color=color.red, linewidth=1, style=plot.style_line)
//plot(shortTakeProfit, title="Short Take Profit", color=color.green, linewidth=1, style=plot.style_line)
//plot(shortStopLoss, title="Short Stop Loss", color=color.red, linewidth=1, style=plot.style_line)
Detail
https://www.fmz.com/strategy/452820
Last Modified
2024-05-29 16:55:22