
16 KiB
Name
EMA趋势追踪自动化交易策略-EMA-Trend-Following-Automated-Trading-Strategy
Author
ChaoZhang
Strategy Description
[trans]
概述
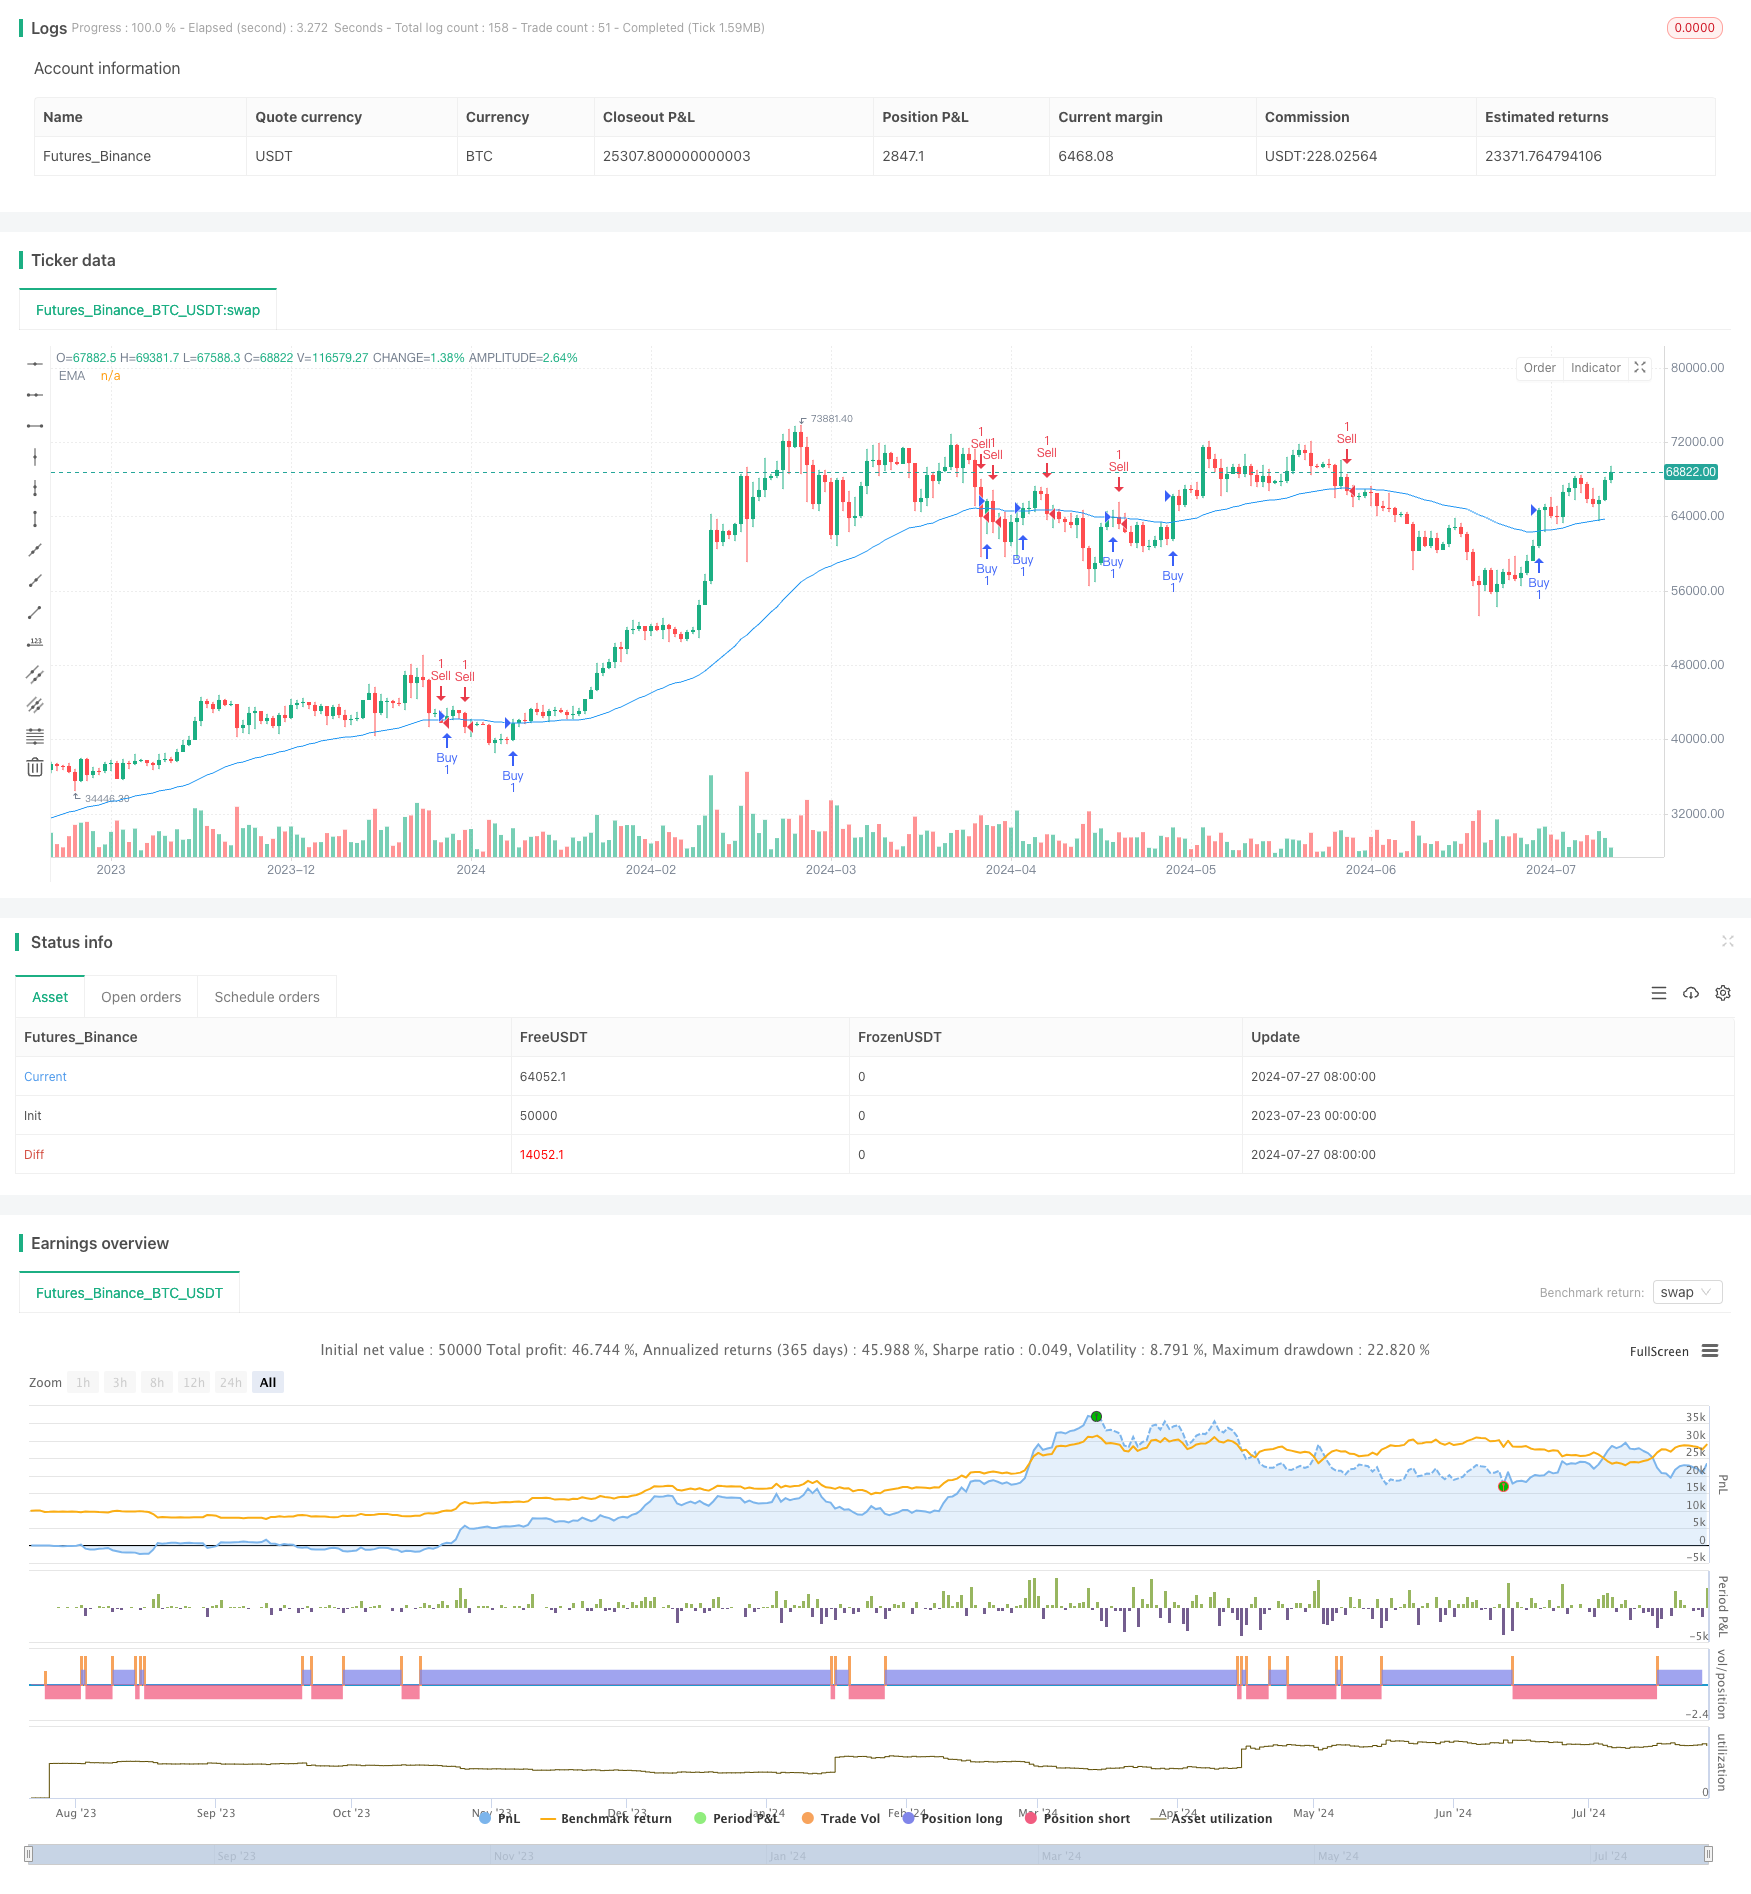
EMA趋势追踪自动化交易策略是一种基于指数移动平均线(EMA)的自动化交易系统。该策略利用EMA指标识别市场趋势,并在价格突破EMA时自动执行买入或卖出操作。策略还集成了风险管理、止损和获利了结等功能,旨在最大化盈利潜力的同时有效控制风险。该策略在TradingView平台上使用Pine Script 5版本实现,为交易者提供了一种系统化、客观的方法来捕捉市场趋势并自动化交易过程。
策略原理
-
EMA趋势识别:策略使用可自定义长度的EMA(默认50周期)来识别市场趋势。当价格向上突破EMA时,视为买入(做多)信号;当价格向下突破EMA时,视为卖出(做空)信号。
-
风险管理:策略采用基于账户余额的风险管理方法。每笔交易的默认风险设置为账户余额的1%(可由用户调整),以确保资金暴露的一致性和可控性。
-
动态止损:策略使用基于近期价格波动的动态止损方法。止损位置通过计算最近一定数量柱线(默认10根)的最低点(对于多头)或最高点(对于空头),再加上一个可调整的额外点数(默认5个点)来确定。
-
固定获利:策略设置了固定的获利目标,默认为入场价格的20个点。当价格达到这一水平时,交易将自动平仓以锁定利润。
-
回溯验证:为了过滤虚假信号,策略引入了回溯验证机制。在执行买入信号前,会确认最近一定数量的柱线(默认10根)的价格是否始终低于EMA;卖出信号则相反。
-
自动执行:一旦满足预定义的条件,策略会自动执行交易,无需人工干预。同时,策略还会生成买卖信号警报,以便交易者及时获取市场动向。
策略优势
-
自动化执行:通过自动化交易决策,策略有效消除了人为情绪因素的干扰,提高了交易的客观性和一致性。
-
趋势捕捉:利用EMA指标,策略能够有效识别和跟踪市场趋势,提高了捕捉大趋势的概率。
-
风险控制:通过设置每笔交易的风险百分比,策略实现了有效的资金管理,降低了单笔交易对整体账户的影响。
-
动态止损:采用基于市场波动的动态止损方法,使得止损更加灵活,能够适应不同市场环境。
-
获利保护:设置固定的获利目标,确保在价格达到预期水平时锁定利润,避免因市场逆转而损失已有盈利。
-
信号过滤:通过回溯验证机制,策略能够有效过滤掉潜在的虚假突破信号,提高交易的准确性。
-
实时警报:策略生成的实时买卖信号警报,使交易者能够及时了解市场动向,便于进行额外的人工分析或干预。
-
高度可定制:策略提供多个可调参数,如EMA长度、风险百分比、止损点数等,使交易者能够根据个人风险偏好和市场环境进行优化。
策略风险
-
震荡市场风险:在横盘或震荡市场中,EMA突破可能导致频繁的假突破信号,造成连续亏损。为缓解这一风险,可考虑引入额外的趋势确认指标或加大EMA周期。
-
滑点风险:在快速市场中,实际成交价可能与信号生成时的价格有显著差异,影响策略表现。建议在回测中模拟滑点情况,并在实盘中使用限价单而非市价单。
-
过度交易风险:频繁的EMA穿越可能导致过度交易,增加交易成本。可以通过增加信号过滤条件或延长EMA周期来减少交易频率。
-
固定获利目标的局限性:使用固定点数的获利目标可能在波动性较大的市场中过早平仓,错失更大的盈利机会。考虑使用动态的获利目标,如跟踪止盈。
-
资金管理风险:虽然策略设置了每笔交易的风险百分比,但在连续亏损情况下仍可能导致较大的账户回撤。建议设置最大回撤限制和每日亏损限制。
-
市场环境变化风险:策略性能可能受到市场波动性、流动性变化的影响。定期评估和调整策略参数很重要。
策略优化方向
-
多周期分析:引入多个时间周期的EMA分析,以提高趋势判断的准确性。例如,可以同时考虑短期、中期和长期EMA的位置关系。
-
波动性适应:根据市场波动性动态调整EMA周期、止损和获利目标。在低波动期可缩短EMA周期,提高灵敏度;在高波动期则相反。
-
趋势强度过滤:引入ADX(平均方向指数)等趋势强度指标,仅在趋势足够强时执行交易,以减少震荡市场中的假信号。
-
动态获利目标:使用ATR(真实波动幅度)来设置动态的获利目标,使策略能够在大趋势中获得更多收益。
-
时间过滤:加入时间过滤功能,避免在市场开盘、收盘或者重要新闻公布前后的高波动期交易。
-
成交量确认:结合成交量分析,只有在成交量支撑的情况下才执行EMA突破交易,以提高信号的可靠性。
-
机器学习优化:使用机器学习算法动态优化策略参数,如EMA长度、风险百分比等,以适应不同的市场环境。
-
情绪指标整合:考虑整合市场情绪指标,如VIX恐慌指数,在极端市场情绪下调整策略行为。
总结
EMA趋势追踪自动化交易策略是一个结合了技术分析和自动化执行的系统化交易方法。通过利用EMA指标捕捉市场趋势,并结合风险管理、动态止损和固定获利目标,该策略旨在提供一个平衡的交易方案。其自动化特性有助于消除人为情绪因素,提高交易的一致性和效率。
然而,策略也面临着震荡市场风险、过度交易和固定获利目标的局限性等挑战。通过引入多周期分析、波动性适应、趋势强度过滤等优化方向,策略有潜力进一步提升其性能和适应性。
总的来说,这个策略为交易者提供了一个良好的起点,可以根据个人交易风格和市场环境进行进一步的定制和优化。重要的是要进行充分的回测和前向测试,并在实盘交易中谨慎应用,持续监控和调整策略表现。
||
Overview
The EMA Trend-Following Automated Trading Strategy is an automated trading system based on the Exponential Moving Average (EMA) indicator. This strategy utilizes the EMA to identify market trends and automatically executes buy or sell operations when the price breaks through the EMA. The strategy also integrates risk management, stop-loss, and take-profit functionalities, aiming to maximize profit potential while effectively controlling risk. Implemented on the TradingView platform using Pine Script version 5, this strategy provides traders with a systematic and objective approach to capture market trends and automate the trading process.
Strategy Principles
-
EMA Trend Identification: The strategy uses a customizable length EMA (default 50 periods) to identify market trends. When the price breaks above the EMA, it is considered a buy (long) signal; when the price breaks below the EMA, it is considered a sell (short) signal.
-
Risk Management: The strategy employs a risk management method based on account balance. The default risk for each trade is set at 1% of the account balance (adjustable by the user) to ensure consistency and controllability of capital exposure.
-
Dynamic Stop-Loss: The strategy uses a dynamic stop-loss method based on recent price volatility. The stop-loss position is determined by calculating the lowest point (for long trades) or highest point (for short trades) of a certain number of recent bars (default 10), plus an adjustable additional number of points (default 5 points).
-
Fixed Take-Profit: The strategy sets a fixed profit target, default at 20 points from the entry price. When the price reaches this level, the trade will automatically close to lock in profits.
-
Lookback Validation: To filter out false signals, the strategy introduces a lookback validation mechanism. Before executing a buy signal, it confirms that the price of a certain number of recent bars (default 10) has consistently been below the EMA; the opposite applies for sell signals.
-
Automated Execution: Once predefined conditions are met, the strategy automatically executes trades without manual intervention. Additionally, the strategy generates buy and sell signal alerts to keep traders informed of market movements in real-time.
Strategy Advantages
-
Automated Execution: By automating trading decisions, the strategy effectively eliminates the interference of human emotional factors, improving the objectivity and consistency of trading.
-
Trend Capture: Utilizing the EMA indicator, the strategy can effectively identify and follow market trends, increasing the probability of capturing major trends.
-
Risk Control: By setting a risk percentage for each trade, the strategy achieves effective fund management, reducing the impact of individual trades on the overall account.
-
Dynamic Stop-Loss: Adopting a dynamic stop-loss method based on market volatility makes the stop-loss more flexible and adaptable to different market environments.
-
Profit Protection: Setting fixed profit targets ensures that profits are locked in when the price reaches the expected level, avoiding loss of existing profits due to market reversals.
-
Signal Filtering: Through the lookback validation mechanism, the strategy can effectively filter out potential false breakout signals, improving the accuracy of trades.
-
Real-Time Alerts: The real-time buy and sell signal alerts generated by the strategy allow traders to stay informed of market movements promptly, facilitating additional manual analysis or intervention.
-
Highly Customizable: The strategy provides multiple adjustable parameters, such as EMA length, risk percentage, stop-loss points, etc., allowing traders to optimize according to personal risk preferences and market conditions.
Strategy Risks
-
Sideways Market Risk: In ranging or oscillating markets, EMA breakouts may lead to frequent false breakout signals, resulting in consecutive losses. To mitigate this risk, consider introducing additional trend confirmation indicators or increasing the EMA period.
-
Slippage Risk: In fast-moving markets, the actual execution price may differ significantly from the price at signal generation, affecting strategy performance. It is recommended to simulate slippage in backtesting and use limit orders instead of market orders in live trading.
-
Overtrading Risk: Frequent EMA crossovers may lead to overtrading, increasing transaction costs. This can be reduced by adding signal filtering conditions or extending the EMA period.
-
Limitations of Fixed Profit Targets: Using fixed point profit targets may result in premature closing of positions in highly volatile markets, missing out on larger profit opportunities. Consider using dynamic profit targets, such as trailing stops.
-
Fund Management Risk: Although the strategy sets a risk percentage for each trade, consecutive losses may still lead to significant account drawdowns. It is advisable to set maximum drawdown limits and daily loss limits.
-
Market Environment Change Risk: Strategy performance may be affected by changes in market volatility and liquidity. Regular evaluation and adjustment of strategy parameters are important.
Strategy Optimization Directions
-
Multi-Timeframe Analysis: Introduce EMA analysis across multiple time periods to improve the accuracy of trend judgment. For example, consider the positional relationships of short-term, medium-term, and long-term EMAs simultaneously.
-
Volatility Adaptation: Dynamically adjust EMA periods, stop-loss, and profit targets based on market volatility. Shorten EMA periods during low volatility periods to increase sensitivity, and do the opposite during high volatility periods.
-
Trend Strength Filtering: Introduce trend strength indicators such as ADX (Average Directional Index) to execute trades only when the trend is sufficiently strong, reducing false signals in oscillating markets.
-
Dynamic Profit Targets: Use ATR (Average True Range) to set dynamic profit targets, allowing the strategy to capture more gains in strong trends.
-
Time Filtering: Add time filtering functionality to avoid trading during high volatility periods such as market opening, closing, or before and after important news releases.
-
Volume Confirmation: Integrate volume analysis, executing EMA breakout trades only when supported by volume, to improve signal reliability.
-
Machine Learning Optimization: Use machine learning algorithms to dynamically optimize strategy parameters, such as EMA length and risk percentage, to adapt to different market environments.
-
Sentiment Indicator Integration: Consider integrating market sentiment indicators, such as the VIX fear index, to adjust strategy behavior during extreme market sentiment.
Conclusion
The EMA Trend-Following Automated Trading Strategy is a systematic trading method that combines technical analysis with automated execution. By leveraging the EMA indicator to capture market trends and incorporating risk management, dynamic stop-loss, and fixed profit targets, this strategy aims to provide a balanced trading solution. Its automated nature helps eliminate human emotional factors and improves trading consistency and efficiency.
However, the strategy also faces challenges such as sideways market risk, overtrading, and limitations of fixed profit targets. Through the introduction of multi-timeframe analysis, volatility adaptation, trend strength filtering, and other optimization directions, the strategy has the potential to further enhance its performance and adaptability.
Overall, this strategy provides traders with a solid starting point that can be further customized and optimized according to individual trading styles and market environments. It is crucial to conduct thorough backtesting and forward testing, apply the strategy cautiously in live trading, and continuously monitor and adjust strategy performance.
[/trans]
Source (PineScript)
/*backtest
start: 2023-07-23 00:00:00
end: 2024-07-28 00:00:00
period: 1d
basePeriod: 1h
exchanges: [{"eid":"Futures_Binance","currency":"BTC_USDT"}]
*/

//@version=5
strategy("EMA Automated Strategy", overlay=true)

// Input parameters
emaLength = input.int(50, title="EMA Length")
defaultRiskPercentage = input.float(1.0, "Default Risk per Trade (%)", step=0.1)
stopLossPips = input.float(5, title="Stop Loss (Pips)")
takeProfitPips = input.float(20, title="Take Profit (Pips)")
lookbackBars = input.int(10, title="Lookback Bars")

// Calculate EMA
emaValue = ta.ema(close, emaLength)

// Function to calculate stop loss
getStopLoss(direction, barsBack) =>
    if direction == 1 // Buy trade
        lowSwing = ta.lowest(low, barsBack)
        lowSwing - stopLossPips * syminfo.mintick
    else // Sell trade
        highSwing = ta.highest(high, barsBack)
        highSwing + stopLossPips * syminfo.mintick

// Calculate risk amount based on default or user-defined percentage
riskPercentage = defaultRiskPercentage / 100
riskAmount = strategy.equity * riskPercentage

// Determine trade direction and execute
var qty = 0
if ta.crossover(close, emaValue)
    // Buy trade
    stopLoss = getStopLoss(-1, lookbackBars)
    takeProfit = close + takeProfitPips * syminfo.mintick
    qty := math.floor(riskAmount / (close - stopLoss) / syminfo.pointvalue)
    if qty < 1
        qty := 1
    strategy.entry("Buy", strategy.long, stop=stopLoss, limit=takeProfit, qty=qty)

if ta.crossunder(close, emaValue)
    // Sell trade
    stopLoss = getStopLoss(1, lookbackBars)
    takeProfit = close - takeProfitPips * syminfo.mintick
    qty := math.floor(riskAmount / (stopLoss - close) / syminfo.pointvalue)
    if qty < 1
        qty := 1
    strategy.entry("Sell", strategy.short, stop=stopLoss, limit=takeProfit, qty=qty)

// Plotting
plot(emaValue, title="EMA", color=color.blue)

// Alerts
alertcondition(condition=ta.crossover(close, emaValue), title="Buy Signal", message="Buy Signal Detected!")
alertcondition(condition=ta.crossunder(close, emaValue), title="Sell Signal", message="Sell Signal Detected!")
Detail
https://www.fmz.com/strategy/458042
Last Modified
2024-07-29 14:26:03