
11 KiB
Name
EMA均线交叉策略EMA-Crossover-Strategy
Author
ChaoZhang
Strategy Description
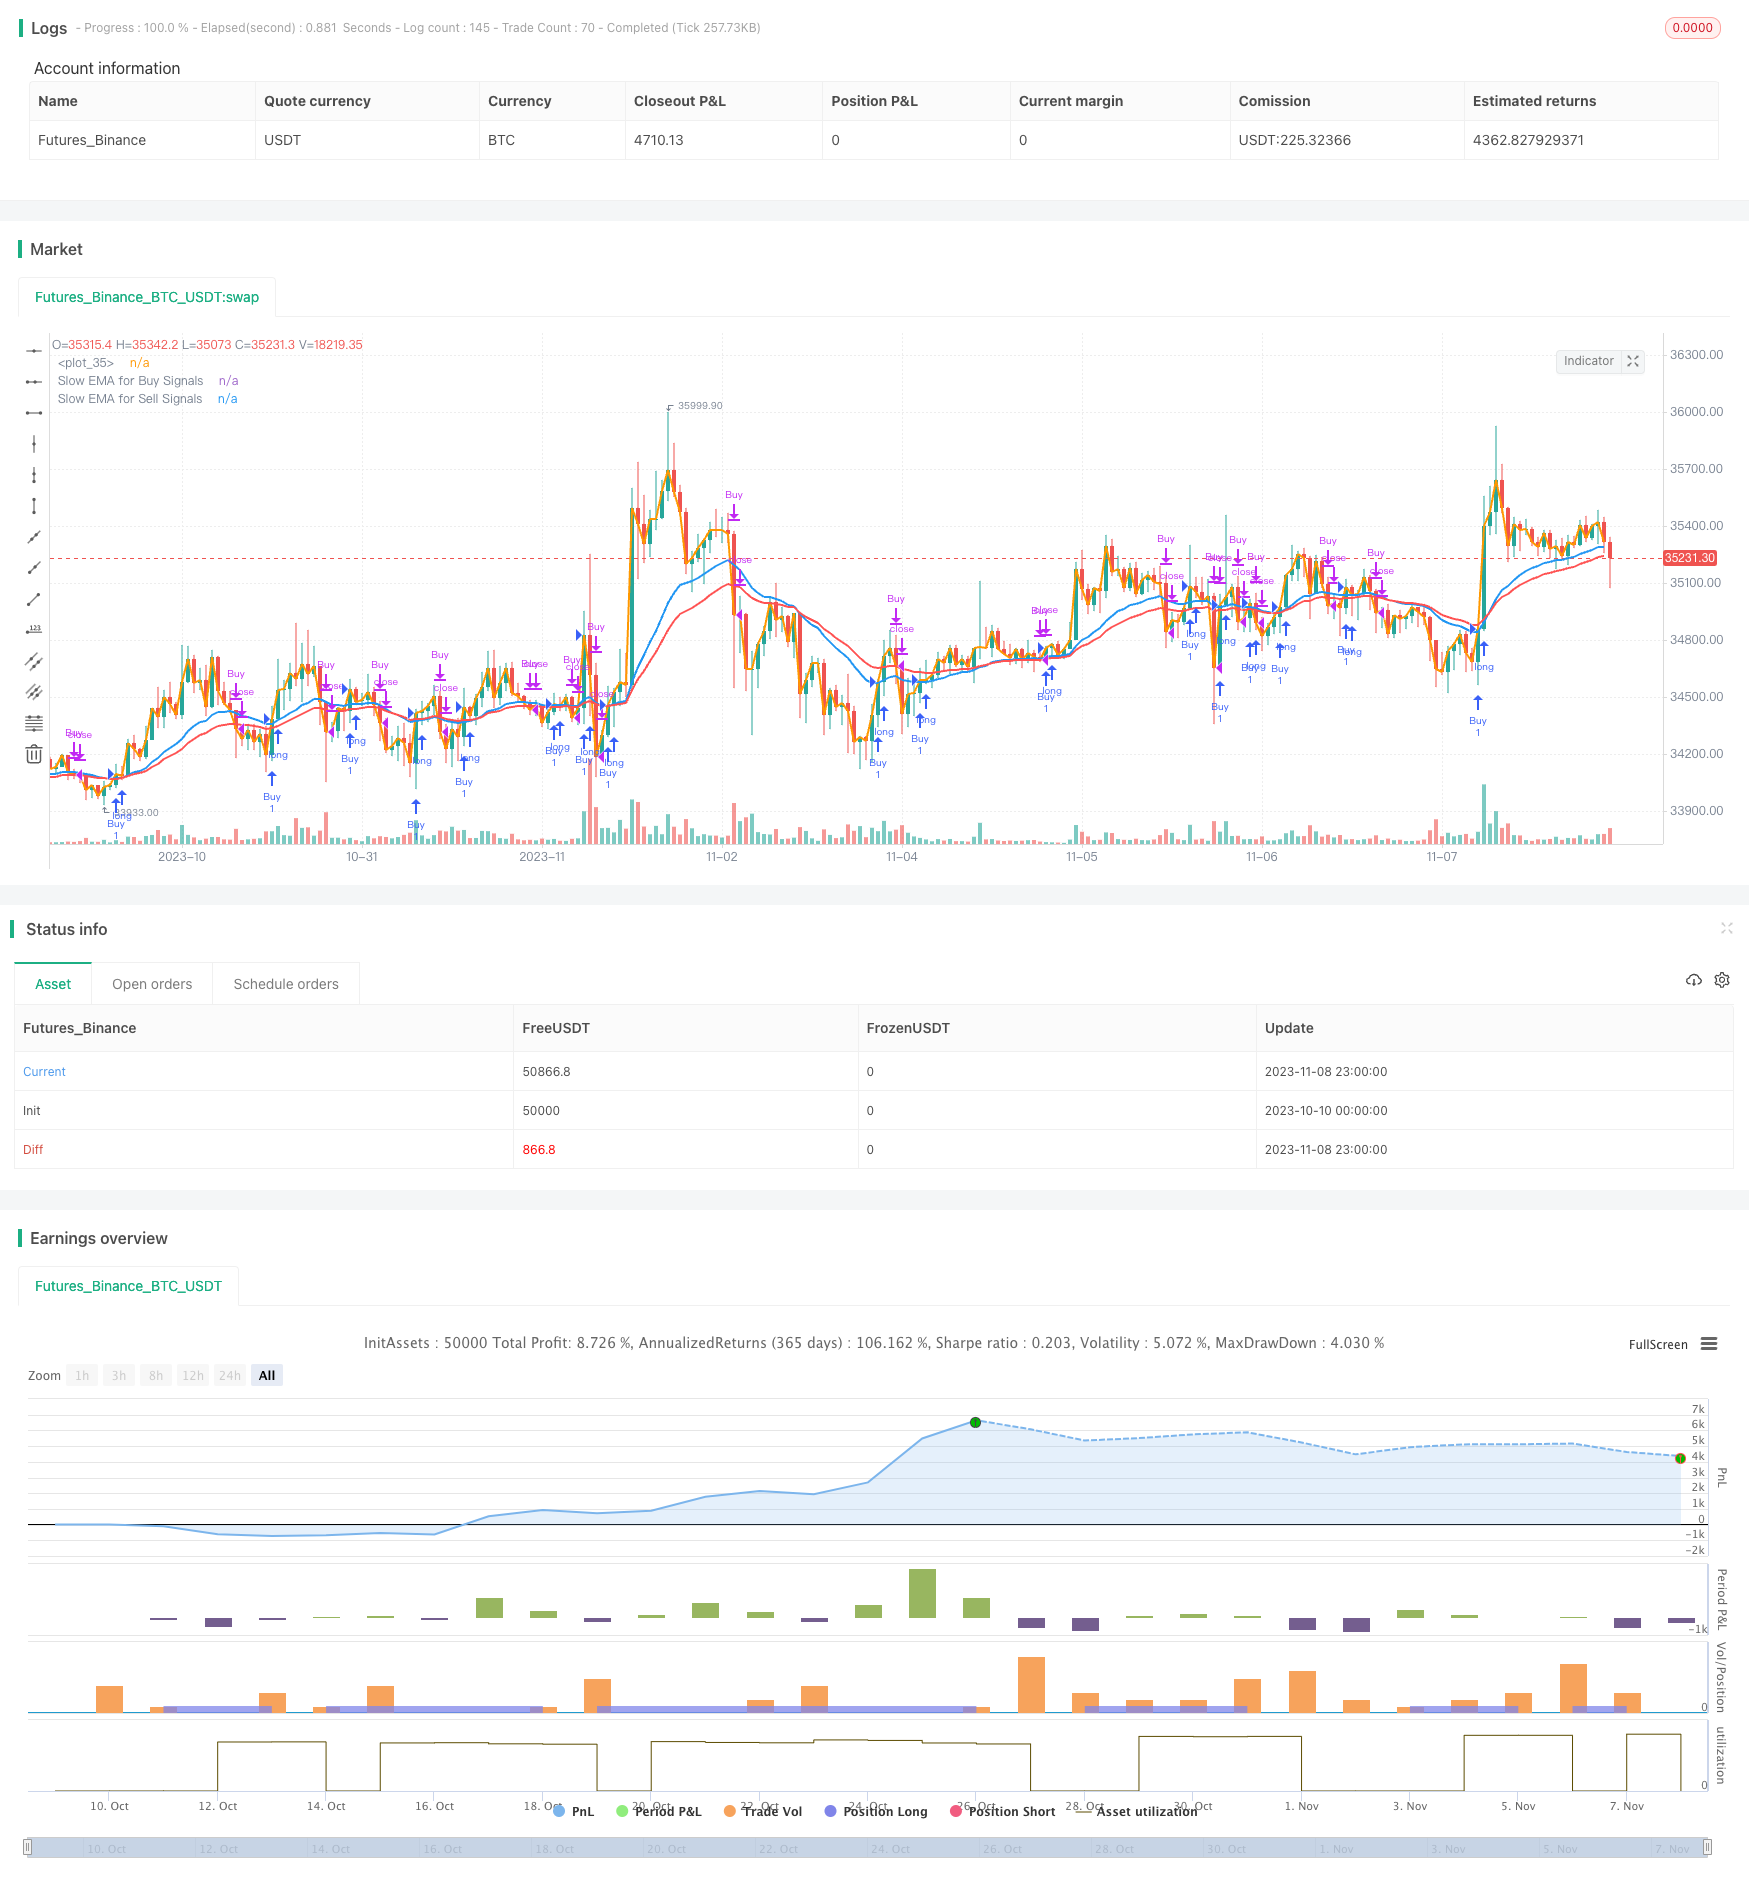 [trans]
概述
该策略运用快速EMA线和慢速EMA线的交叉作为买入和卖出信号,实现根据均线交叉进行自动交易。快速EMA线紧贴价格变动,慢速EMA线平滑价格变动。当快速EMA线从下方向上穿过慢速EMA线时,产生买入信号;当快速EMA线从上方向下跌破慢速EMA线时,产生卖出信号。该策略灵活可调,可以通过调整快慢EMA的参数,自定义买入和卖出的信号点。
策略原理
该策略主要通过计算快速EMA线和慢速EMA线,并比较两条均线的关系来产生交易信号。
首先,在输入参数中设置快速EMA的周期emaFast为1,这样快速EMA就能够紧贴价格变动。同时设置慢速EMA的周期,emaSlowBuy用于产生买入信号,emaSlowSell用于产生卖出信号。
然后,根据输入的周期,计算出快速EMA和慢速EMA。快速EMA固定周期为1,紧跟价格;慢速EMA为可调节的参数,平滑价格数据。
接下来,比较快速EMA和慢速EMA的大小关系,判断交叉情况。如果快速EMA从下方向上穿过慢速EMA,即产生金叉,满足买入条件;如果快速EMA从上方向下跌破慢速EMA,即产生死叉,满足卖出条件。
最后,在满足买入和卖出条件时,执行相应的开仓和平仓指令,完成交易。同时,检查当前时间是否在回测时间范围内,避免超出日期范围造成错误交易。
优势分析
- 使用均线交叉判断买卖点,是一种成熟可靠的技术指标
- 快慢EMA周期可调,可以根据市场调整参数,寻找最佳交易机会
- 采用金叉买入、死叉卖出的思路清晰易懂
- 可灵活设置买入和卖出使用不同EMA参数,完全自定义交易策略
- 可选择仅做多、仅做空或双向交易,灵活适应不同市场情况
- 可设置回测的时间范围,针对不同时间段进行优化测试
风险分析
- EMA均线交叉具有滞后性,可能错过价格变化的最佳时机
- 大幅波动市场中,EMA交叉产生的信号可能频繁,造成过度交易
- 需要反复测试参数,寻找最佳EMA组合,否则会出现大量错误信号
- 固定使用1周期的快速EMA,在市场突发事件时无法有效过滤噪音
- 不能有效处理价格震荡区间的市场,会产生许多不必要的交易信号
针对风险,可以考虑以下优化措施:
-
结合其他指标过滤EMA交叉信号,避免错误信号
-
根据市场波动程度调整EMA参数,降低交易频率
-
增加对止损和止盈的考虑,控制风险
-
优化快速EMA的周期,在特定市况下采用更合适的参数
-
增加对趋势的判断,避免陷入震荡市场的过度交易
优化方向
该策略可以从以下几个方向进行进一步优化:
-
优化EMA的参数设置,测试不同的周期组合,找出最优参数
可以通过遍历不同的emaFast和emaSlow参数,采用步进优化或随机优化的方法,找出在历史数据回测中表现最好的参数组合。
-
结合其他指标进行信号过滤验证
例如可以结合MACD、KDJ、布林带等指标,避免EMA交叉产生误信号。
-
增加对趋势的判断
计算平均真实波幅等指标,判断走势强弱,避免陷入震荡市场。
-
优化止损止盈策略
研究最佳的止损点位以控制亏损风险,以及确定合理的止盈点位最大化利润。
-
测试其他EMA组合
不仅测试快慢EMA组合,也可以测试双EMA、三EMA甚至多EMA组合,寻找更优参数。
-
进行参数调整以适应不同市场周期
对于趋势更强的市场可以适当加快EMA周期,而震荡市场则可以加慢EMA周期。
总结
该EMA交叉策略整体思路清晰易懂,使用成熟的技术指标判断买卖时机。策略可定制性强,可以通过调整EMA参数进行优化,从而针对不同市场环境制定交易策略。但EMA信号存在滞后性,需要反复测试找到最佳参数组合。此外,还需要针对风险进行优化,结合其他指标进行信号过滤验证,并优化止损止盈方式,从而降低回撤和提高盈利能力。如果持续优化测试,该策略有望获取良好的交易业绩。
||
Overview
This strategy uses the crossover of fast EMA and slow EMA lines as buy and sell signals to implement automated trading based on EMA crossovers. The fast EMA line closely follows price action while the slow EMA line smooths price action. When the fast EMA line crosses above the slow EMA line from below, a buy signal is generated. When the fast EMA line crosses below the slow EMA line from above, a sell signal is generated. The strategy is flexible and customizable by adjusting the parameters of the fast and slow EMAs to define custom signal points for entries and exits.
Strategy Logic
The strategy mainly generates trading signals by calculating fast and slow EMA lines and comparing their relationship.
First, the period of the fast EMA emaFast is set to 1 in the input parameters so that it can closely follow price changes. At the same time, the periods of the slow EMAs are set - emaSlowBuy for generating buy signals and emaSlowSell for sell signals.
Then, the fast EMA and slow EMAs are calculated according to the input periods. The fast EMA has a fixed period of 1 to follow prices closely while the slow EMAs are adjustable parameters to smooth price data.
Next, the relationship between the fast EMA and slow EMAs is compared to determine crossovers. If the fast EMA crosses above the slow EMA, forming a golden cross, the buy condition is met. If the fast EMA crosses below the slow EMA, forming a death cross, the sell condition is met.
Finally, entry and exit orders are executed when the buy and sell conditions are met to complete trades. Meanwhile, it checks that the current time is within the backtest date range to avoid erroneous trades outside the date range.
Advantage Analysis
- Using EMA crossovers to determine entry and exit points is a mature and reliable technical indicator
- Adjustable fast and slow EMA periods allow parameters to be tuned to find optimal trading opportunities in different market conditions
- The logic of buying on golden crosses and selling on death crosses is straightforward and easy to understand
- Flexible configuration of buy and sell EMAs enables full customization of the trading strategy
- Options for long-only, short-only or two-way trading provides flexibility for different market environments
- Customizable backtest date range allows optimization testing on specific time periods
Risk Analysis
- EMA crossover signals have lag and may miss the optimal timing of price changes
- Frequent crossover signals may occur in volatile markets, leading to over-trading
- Extensive testing is required to find the optimal EMA combinations, otherwise excessive false signals may occur
- The fixed 1-period fast EMA cannot filter noise effectively during market shock events
- Sideways choppy markets may generate unnecessary trade signals
Possible enhancements to mitigate risks:
-
Add filters using other indicators to validate EMA crossover signals and avoid false signals
-
Adjust EMA periods based on market volatility to reduce trade frequency
-
Incorporate stop loss and take profit to control risk
-
Optimize the fast EMA period for better performance in specific market conditions
-
Add trend determination to avoid over-trading in ranging markets
Enhancement Opportunities
Some ways the strategy can be further optimized:
-
Optimize EMA parameters by testing different period combinations to find the optimal settings
-
Add filters using other indicators like MACD, KDJ, Bollinger Bands to validate signals
-
Incorporate trend metrics like ATR to avoid ranging markets
-
Optimize stop loss and take profit strategies for better risk and profitability
-
Test other EMA combinations like dual or triple EMAs to find better parameters
-
Adjust parameters dynamically for different market cycles like faster EMAs for trending and slower EMAs for choppy markets
Conclusion
The EMA crossover strategy has clear, easy-to-understand logic using established technical indicators to determine entries and exits. It is highly customizable via EMA parameter tuning for optimization across different market conditions. However, EMA signals have lag and extensive testing is required to find the best parameters. Additionally, further enhancements are needed to mitigate risks by adding signal filters, optimizing stops, and avoiding ranging markets. With continuous optimization and testing, this strategy has potential for strong trading performance.
[/trans]
Strategy Arguments
| Argument | Default | Description |
|---|---|---|
| v_input_1 | 20 | Slow EMA for Buy Signals |
| v_input_2 | 30 | Slow EMA for Sell Signals |
| v_input_3 | 0 | Trade Direction: Both |
| v_input_4 | timestamp(01 Jan 2018 00:00) | Start Date |
| v_input_5 | timestamp(31 Dec 2025 23:59) | End Date |
Source (PineScript)
/*backtest
start: 2023-10-10 00:00:00
end: 2023-11-09 00:00:00
period: 1h
basePeriod: 15m
exchanges: [{"eid":"Futures_Binance","currency":"BTC_USDT"}]
*/

//@version=4
strategy(
     "EMA Cross Strategy with Custom Buy/Sell Conditions",
     overlay=true
     )

// INPUT:

// Options to enter fast Exponential Moving Average (EMA) value
emaFast = 1

// Options to enter slow EMAs for buy and sell signals
slowEMABuy = input(title="Slow EMA for Buy Signals",  defval=20, minval=1, maxval=9999)
slowEMASell = input(title="Slow EMA for Sell Signals",  defval=30, minval=1, maxval=9999)

// Option to select trade directions
tradeDirection = input(title="Trade Direction", options=["Long", "Short", "Both"], defval="Both")

// Options that configure the backtest date range
startDate = input(title="Start Date", type=input.time, defval=timestamp("01 Jan 2018 00:00"))
endDate = input(title="End Date", type=input.time, defval=timestamp("31 Dec 2025 23:59"))


// CALCULATIONS:

// Use a fixed fast EMA of 1 and calculate slow EMAs for buy and sell signals
fastEMA = ema(close, emaFast)
slowEMABuyValue = ema(close, slowEMABuy)
slowEMASellValue = ema(close, slowEMASell)


// PLOT:

// Draw the EMA lines on the chart
plot(series=fastEMA, color=color.orange, linewidth=2)
plot(series=slowEMABuyValue, color=color.blue, linewidth=2, title="Slow EMA for Buy Signals")
plot(series=slowEMASellValue, color=color.red, linewidth=2, title="Slow EMA for Sell Signals")


// CONDITIONS:

// Check if the close time of the current bar falls inside the date range
inDateRange = true

// Translate input into trading conditions for buy and sell signals
buyCondition = crossunder(slowEMABuyValue, fastEMA)
sellCondition = crossover(slowEMASellValue, fastEMA)

// Translate input into overall trading conditions
longOK  = (tradeDirection == "Long") or (tradeDirection == "Both")
shortOK = (tradeDirection == "Short") or (tradeDirection == "Both")


// ORDERS:

// Submit entry (or reverse) orders based on buy and sell conditions
if (buyCondition and inDateRange)
    strategy.entry("Buy", strategy.long)

if (sellCondition and inDateRange)
    strategy.close("Buy")

// Submit exit orders based on opposite trade conditions
if (strategy.position_size > 0 and sellCondition)
    strategy.close("Sell")
if (strategy.position_size < 0 and buyCondition)
    strategy.close("Sell")
Detail
https://www.fmz.com/strategy/431678
Last Modified
2023-11-10 15:05:22