
8.3 KiB
Name
EMA动量均线交叉策略EMA-Momentum-Moving-Average-Crossover-Strategy
Author
ChaoZhang
Strategy Description
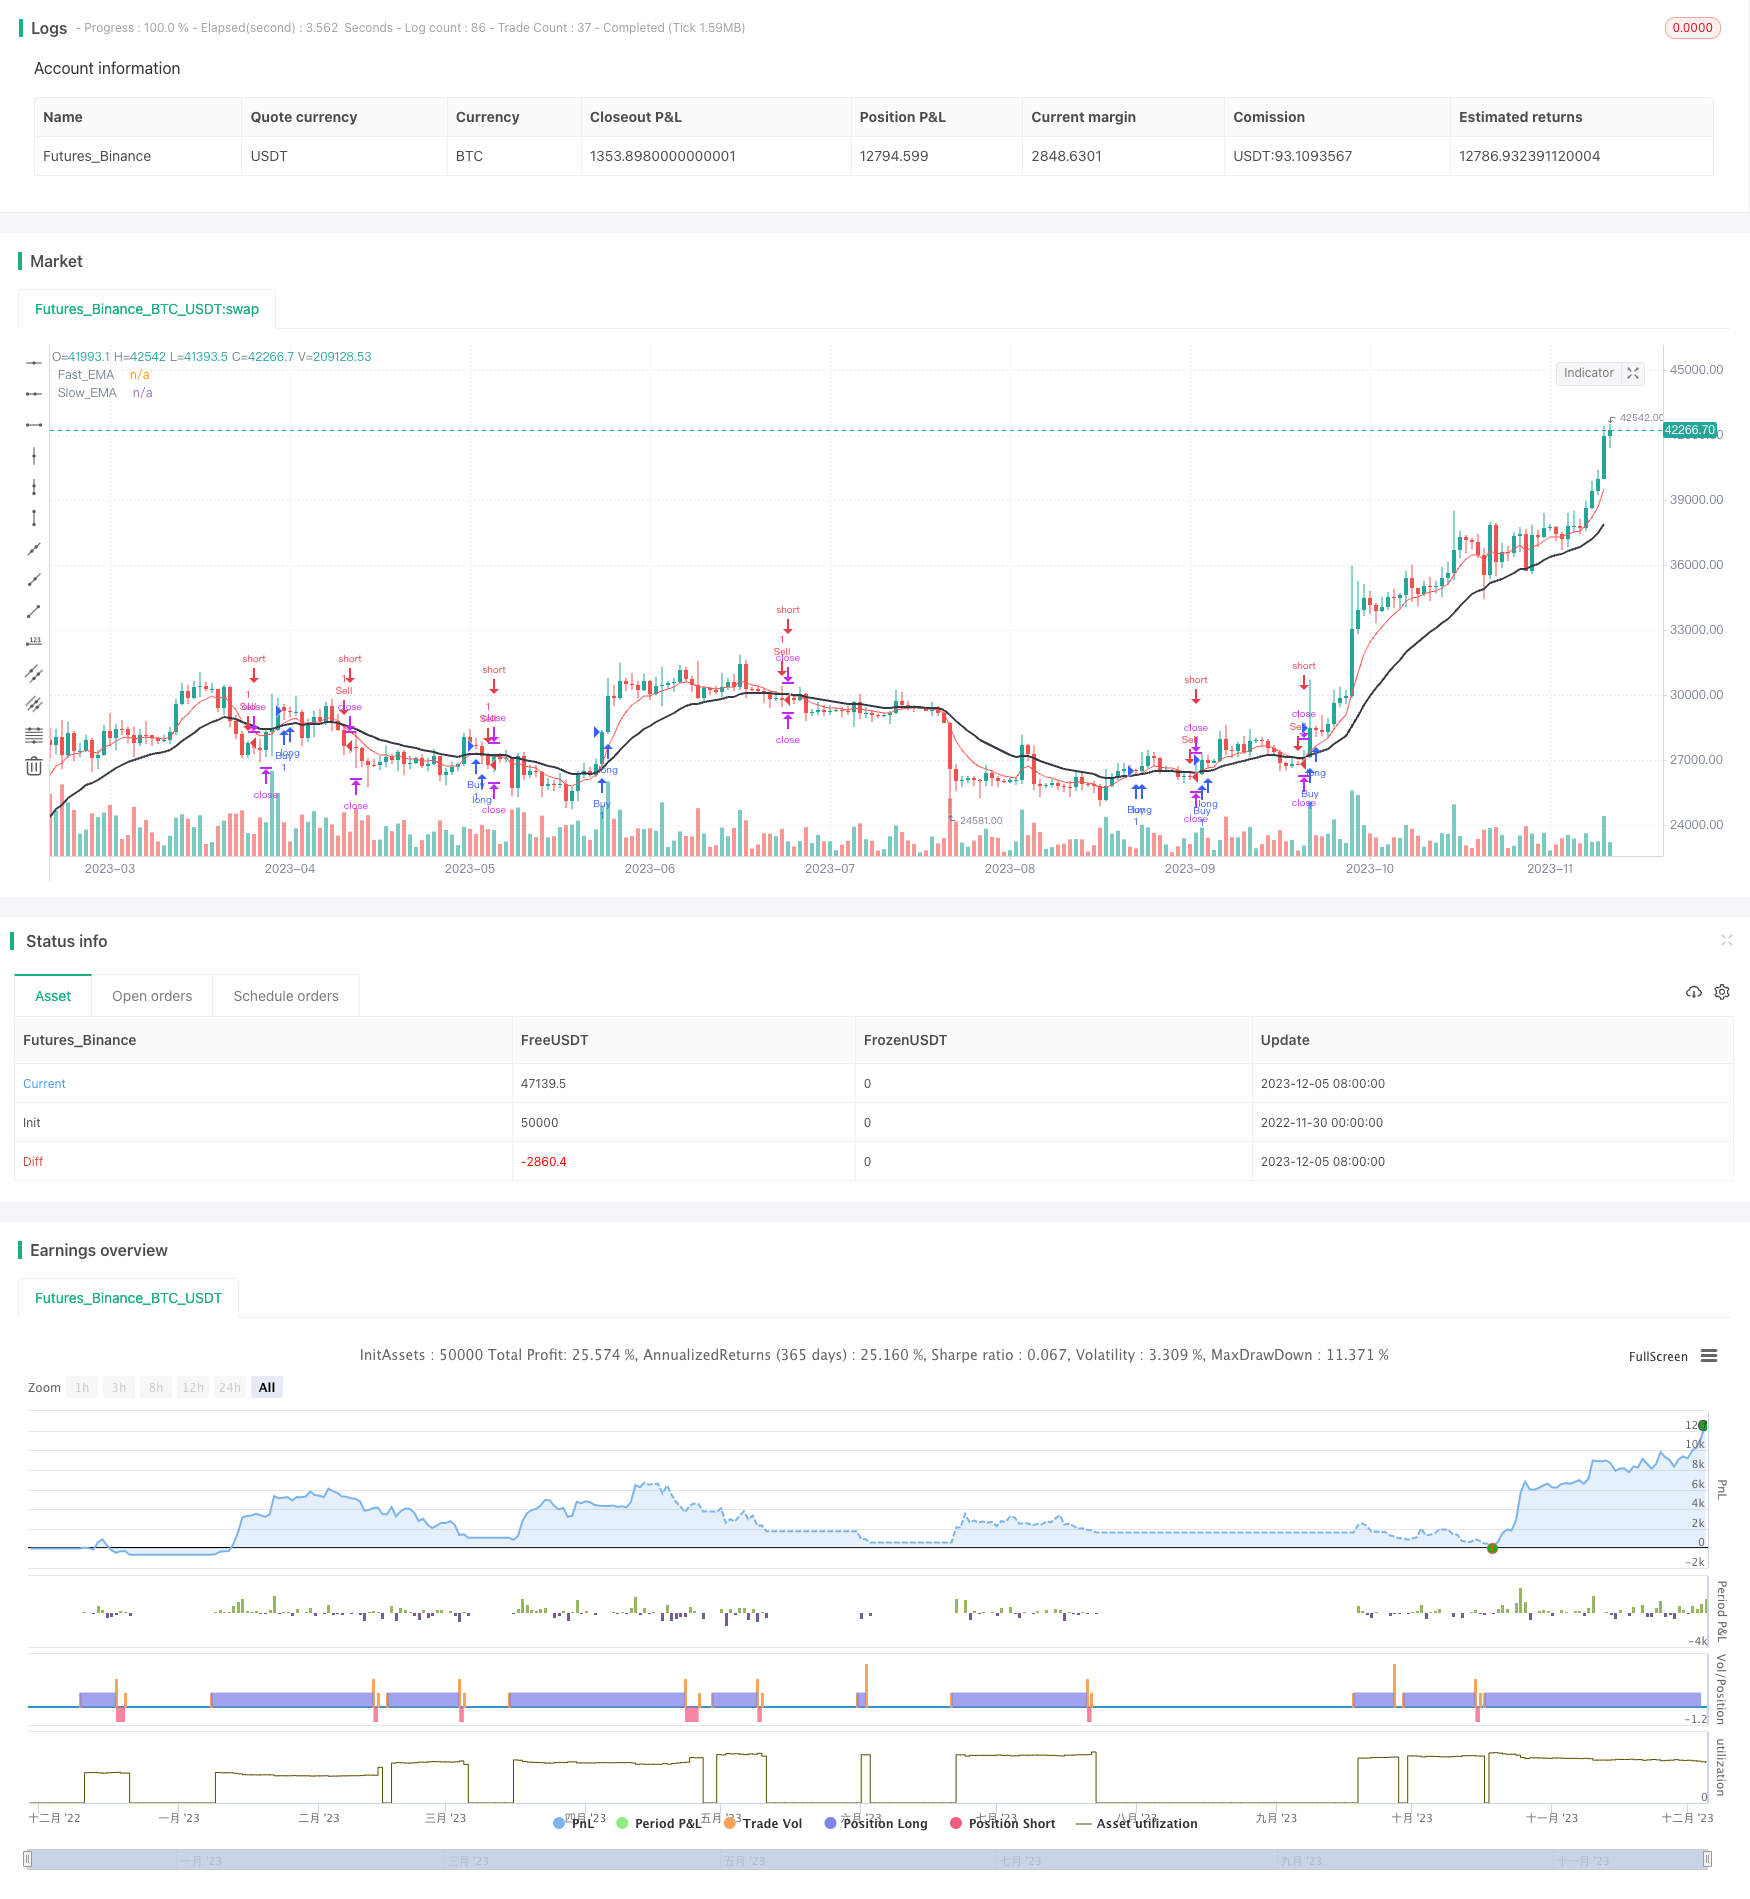
[trans]
概述
动量均线交叉策略通过计算快速Exponential Moving Average(EMA)和慢速EMA,并观察它们的交叉来产生交易信号。当快速EMA从下方上穿越慢速EMA时,会生成买入信号;当快速EMA从上方下穿慢速EMA时,会生成卖出信号。
策略原理
该策略使用两个EMA作为主要分析工具——一个快速EMA周期为7,一个慢速EMA周期为21。EMA是一种趋势跟踪指标,能够平滑价格 datos,滤除市场噪音。快速EMA比慢速EMA更灵敏,能更快捕捉价格趋势的变化。
当快速EMA上穿慢速EMA时,表示短期趋势开始主导长期趋势,即价格开始上涨。这时策略会产生买入信号,打开长仓。相反,当快速EMA下穿慢速EMA时,表示短期趋势开始向下,价格开始下跌。这时策略会产生卖出信号,打开短仓。
利用EMA交叉形成动量交易信号,是一种广泛使用的量化交易策略。该策略自动跟踪价格趋势,无需人工判断,可以高效自动化交易。
优势分析
-
使用广泛的指标:EMA是一种简单但非常常用的技术指标,该策略基于EMA这一成熟有效的分析工具,可靠性较高。
-
自动跟踪趋势:该策略能够自动发现价格趋势的变化,并及时做出交易决策,无需人工判断,避免漏单。
-
简单清晰的逻辑:交叉原理简单易懂,容易判断产生的信号,降低风险。
-
可自定义参数:用户可以根据自己的偏好,调整EMA周期参数,使策略更符合个人风格。
风险分析
-
可能产生错误信号:在价格震荡时,EMA可能产生多次交叉造成错误信号。可以通过调整参数优化,或增加过滤条件来减少错误信号。
-
单一指标依赖:该策略完全依赖EMA这一指标。当EMA失效或产生滞后时,会影响策略表现。可以引入其他指标进行组合验证。
-
缺乏止损机制:目前策略没有设置止损,无法主动控制风险。应设置合理的点位或百分比止损。
-
参数不当可能失效:如果设置的参数不当,EMA交叉就失去实际意义。应谨慎评估参数的合理性。
优化方向
-
增加趋势过滤:可以在EMA交叉时检查价格整体趋势,避免在盘整中产生错误信号。
-
多指标验证:引入其他指标,如MACD、BOLL等与EMA组合使用,验证交易信号。
-
增加止损策略:根据历史回撤情况,设置合理的移动止损或百分比止损,主动控制风险。
-
参数优化:可以通过回测找出最佳的参数组合,也可以设定动态周期来优化参数。
总结
动量均线交叉策略整体思路清晰易懂,通过快慢EMA交叉形成交易信号,可自动跟踪趋势,降低人工工作量。但该策略也存在一定盈利风险,需要优化参数设置、增加信号过滤及止损机制来减少风险,提高策略稳定性。总体而言,该策略与理念简单,适合作为量化交易的入门策略之一。
||
Overview
The Momentum Moving Average Crossover strategy generates trading signals by calculating fast Exponential Moving Average (EMA) and slow EMA and observing their crossover. It will generate a buy signal when the fast EMA crosses above the slow EMA, and it will generate a sell signal when the fast EMA crosses below the slow EMA.
Strategy Principle
This strategy uses two EMAs as the main analytical tool - one fast EMA with a period of 7 and one slow EMA with a period of 21. EMA is a trend tracking indicator that can smooth price data and filter out market noise. The fast EMA is more sensitive than the slow EMA, so it can capture changes in price trends faster.
When the fast EMA crosses above the slow EMA, it indicates that the short-term trend begins to dominate the long-term trend, i.e. prices start to rise. At this point, the strategy will generate a buy signal and open a long position. On the contrary, when the fast EMA crosses below the slow EMA, it indicates that the short-term trend begins to decline and prices start to fall. At this point, the strategy will generate a sell signal and open a short position.
Using EMA crossover to form momentum trading signals is a widely used quantitative trading strategy. This strategy automatically tracks price trends without manual judgment, enabling efficient automated trading.
Advantage Analysis
-
Use extensively proven indicator: EMA is a simple but very commonly used technical indicator. This strategy is based on EMA, a mature and effective analytical tool, thus having higher reliability.
-
Automatically track trends: This strategy can automatically discover changes in price trends and make timely trading decisions without manual judgment, avoiding missing trades.
-
Simple and clear logic: The crossover principle is simple and easy to understand, making it easy to judge the signals generated, reducing risks.
-
Customizable parameters: Users can adjust EMA period parameters according to their own preferences to make the strategy fit personal styles better.
Risk Analysis
-
Possible wrong signals: EMA may generate multiple crossovers causing wrong signals when prices oscillate. This can be reduced by optimizing parameters or adding filtering conditions.
-
Reliance on single indicator: This strategy relies entirely on the EMA indicator. When EMA fails or lags, it will affect strategy performance. Other indicators can be introduced for combination verification.
-
Lack of stop loss mechanism: Currently there is no stop loss in the strategy, unable to actively control risks. Reasonable points or percentage stop loss should be set.
-
Improper parameters may fail: If the parameters set are improper, EMA crossover loses practical meaning. The reasonability of parameters should be carefully evaluated.
Optimization Directions
-
Add trend filtering: Check overall price trend when EMA crossover happens to avoid wrong signals during consolidations.
-
Multi-indicator verification: Introduce other indicators like MACD, BOLL etc. to combine with EMA to verify trading signals.
-
Add stop loss strategy: Set reasonable moving or percentage stop loss based on historical drawdown to actively control risks.
-
Parameter optimization: Find optimum parameter combinations through backtest, or set dynamic cycle to optimize parameters.
Summary
The Momentum Moving Average Crossover Strategy has a clear logic of forming trading signals through fast and slow EMA crossover, which can automatically track trends and reduce manual workload. But it also has certain profit risks. Adding signal filtering, stop loss mechanisms and optimizing parameter settings can reduce risks and improve strategy stability. Overall, it is a simple strategy suitable as a quantitative trading starter strategy.
[/trans]
Strategy Arguments
| Argument | Default | Description |
|---|---|---|
| v_input_1 | true | Quantity |
| v_input_2 | 2500 | Stoploss |
| v_input_3 | 7 | Fast EMA |
| v_input_4 | 21 | Slow EMA |
Source (PineScript)
/*backtest
start: 2022-11-30 00:00:00
end: 2023-12-06 00:00:00
period: 1d
basePeriod: 1h
exchanges: [{"eid":"Futures_Binance","currency":"BTC_USDT"}]
*/

// This Pine Script™ code is subject to the terms of the Mozilla Public License 2.0 at https://mozilla.org/MPL/2.0/
// © sandeepdezno

//@version=5
strategy("EMA_Crossover", overlay=true)

//Inputs
quantity = input(1, "Quantity")
slPoints = input(2500, "Stoploss")

fastEMA = input(7, "Fast EMA")
slowEMA = input(21, "Slow EMA")

//Defining EMAs
fema = ta.ema(close, fastEMA)
sema = ta.ema(close, slowEMA)

//Checking for Crossover
buyCrossover = ta.crossover(fema, sema) //Buy Signal
sellCrossover = ta.crossunder(fema, sema) //Sell Signal

plot(fema, title = "Fast_EMA", style = plot.style_line, linewidth = 1, color = color.red)
plot(sema, title = "Slow_EMA", style = plot.style_line, linewidth = 2, color = color.black)


//Generating Entries
if buyCrossover
    strategy.entry("Buy",strategy.long, qty = quantity)

if sellCrossover
    strategy.entry("Sell", strategy.short, qty = quantity)

//Stoploss Exit
strategy.exit("StopLoss", from_entry = "Buy", loss = slPoints, qty = quantity)
strategy.exit("StopLoss", from_entry = "Sell", loss = slPoints, qty = quantity)
Detail
https://www.fmz.com/strategy/434593
Last Modified
2023-12-07 17:00:52