
8.3 KiB
Name
EMA动态趋势追踪交易策略-EMA-Dynamic-Trend-Following-Trading-Strategy
Author
ChaoZhang
Strategy Description
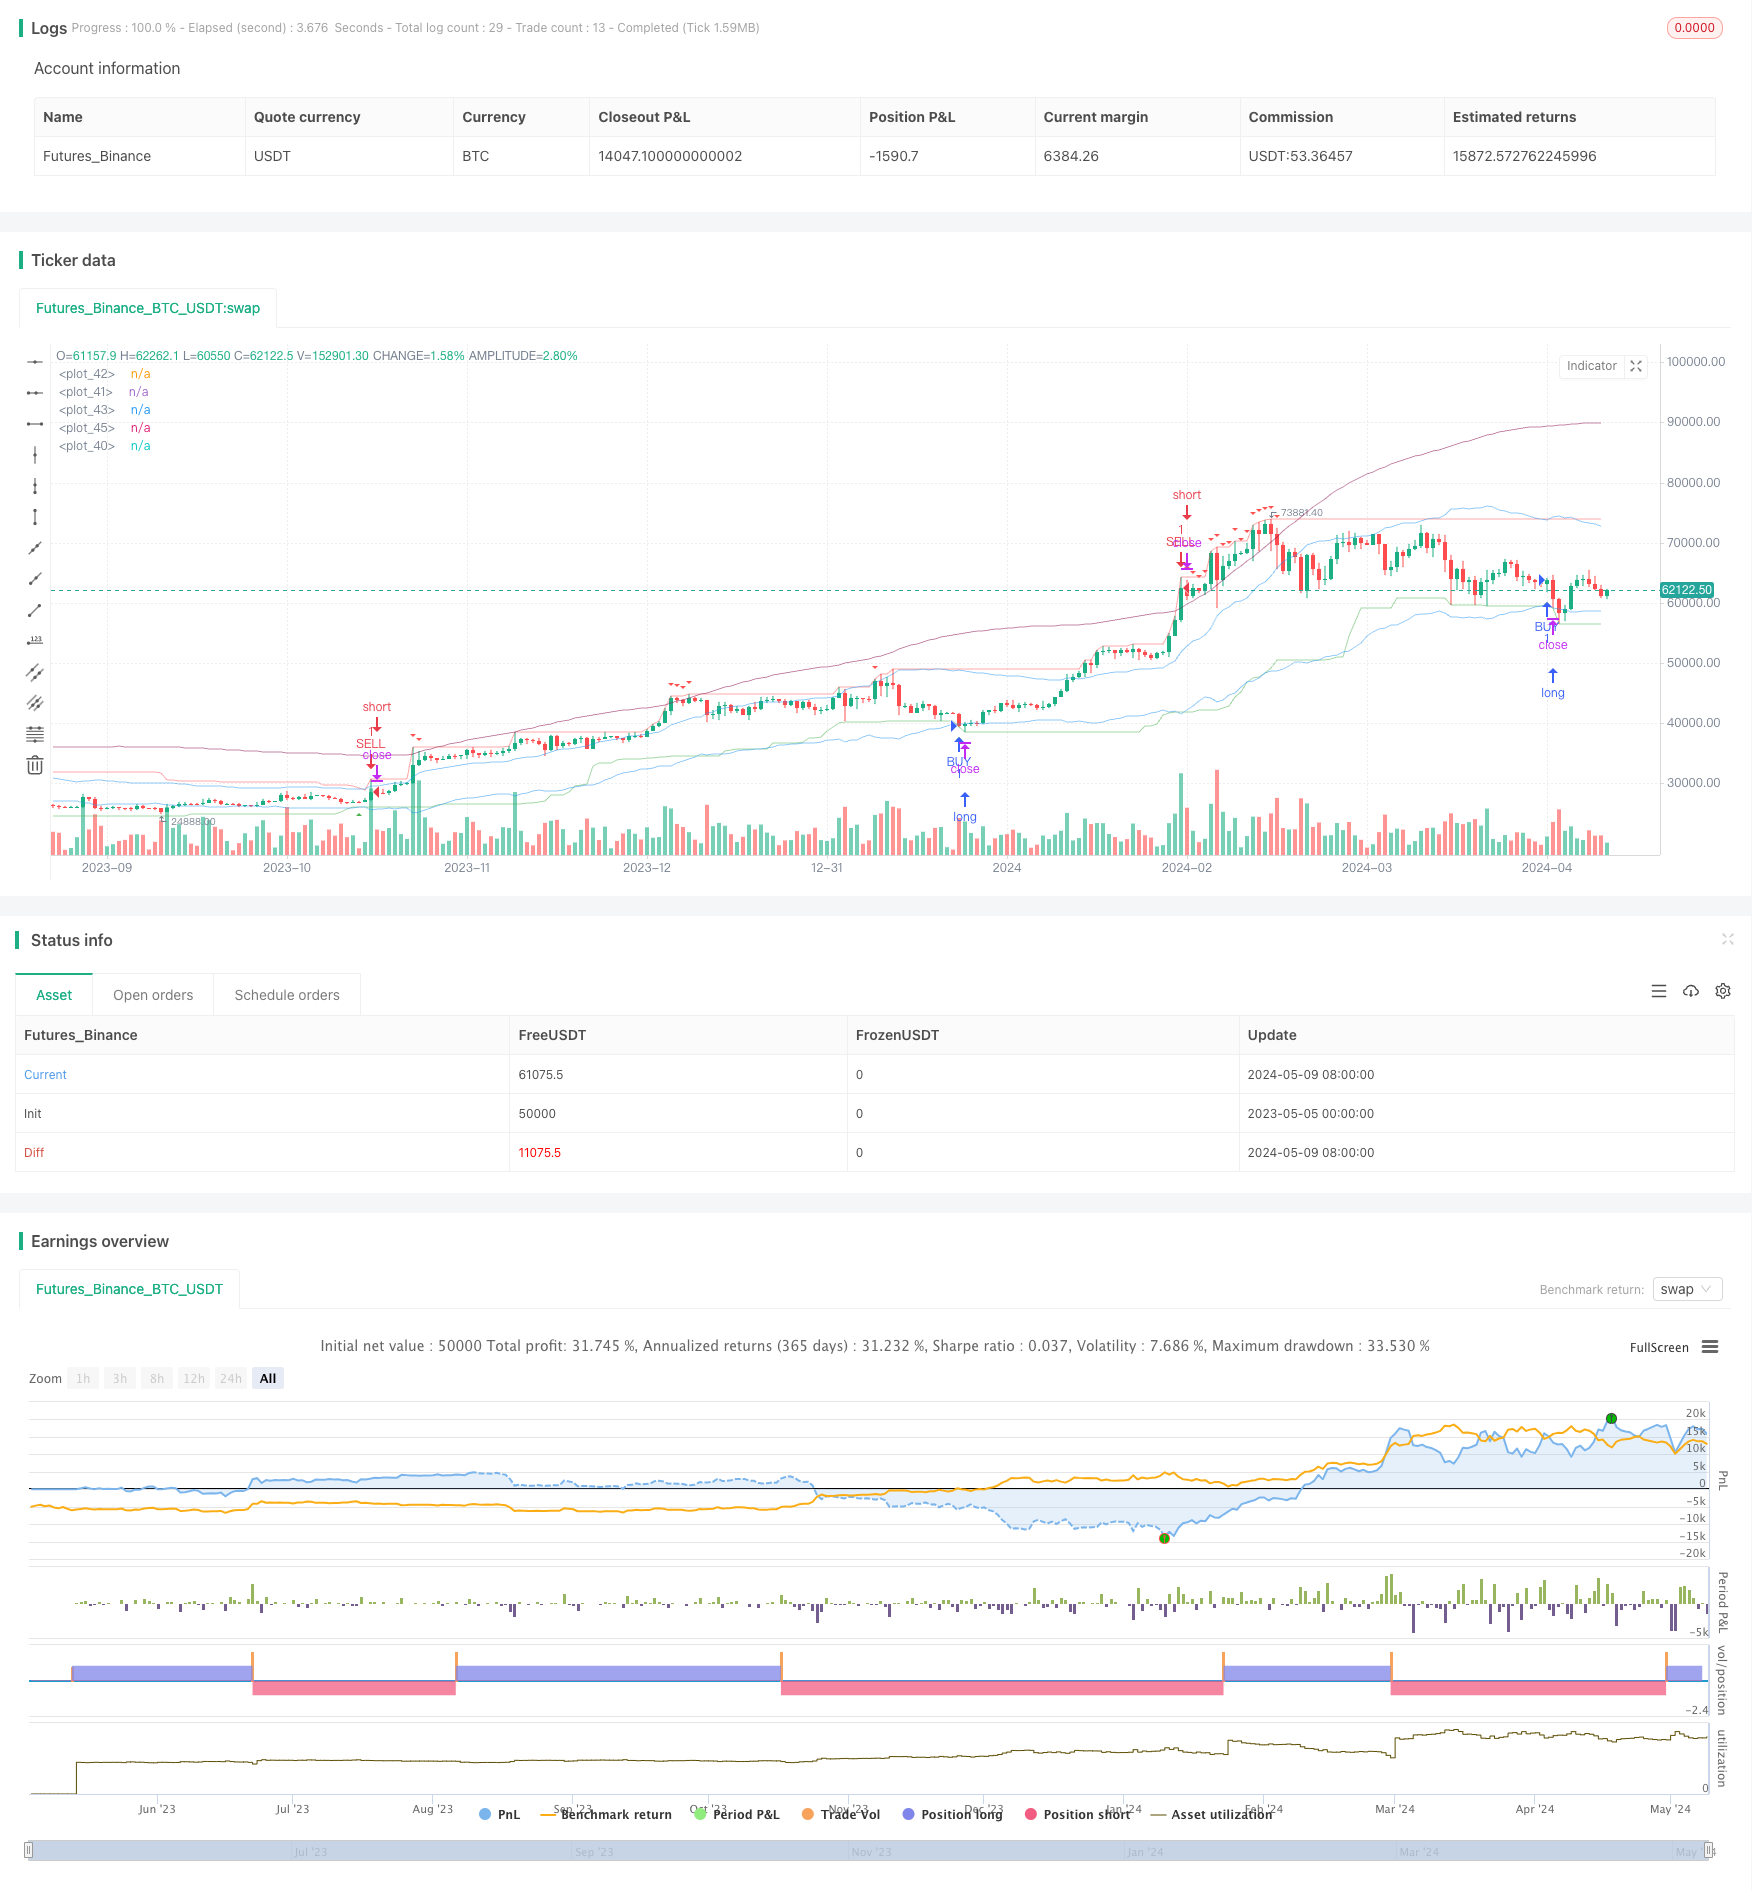
[trans] ####概述 该策略使用指数移动平均线(EMA)、最高价、最低价和平均真实波幅(ATR)等技术指标,通过判断价格与EMA、最高价和最低价的关系,识别当前的趋势方向,在向上突破最低价时买入,在向下突破最高价或触及动态阻力位时卖出,以捕捉趋势行情,获取超额收益。
####策略原理
- 计算ATR,用于衡量市场波动率,为构建动态通道提供依据。
- 计算最高价和最低价,作为判断趋势方向的基础。
- 计算EMA_HL,即最高价和最低价的EMA,作为动态通道的中轴线。
- 计算EMA_HIGHEST和EMA_LOWEST,即在EMA_HL的基础上加减ATR乘以一定比例得到的上下轨。
- 计算SELL_LINE,即在最高价的基础上加上ATR乘以一定比例得到的动态阻力位。
- 判断多头信号:当EMA_LOWEST向上突破最低价且收盘价低于EMA_MID时,产生买入信号。
- 判断空头信号:当EMA_HIGHEST向下突破最高价且收盘价高于EMA_MID时,或者最高价触及SELL_LINE时,产生卖出信号。
####策略优势
- 利用EMA、最高价、最低价等指标综合判断趋势,信号可靠性高。
- 引入ATR作为波动率衡量标准,构建动态通道,适应不同市场状态。
- 设置SELL_LINE动态阻力位,及时锁定利润,控制回撤风险。
- 参数可调,适应不同品种和周期,具有一定的普适性和灵活性。
####策略风险
- 趋势识别可能存在滞后,导致入场时机不够理想。
- 参数设置不当可能导致信号频繁,增加交易成本。
- 对于震荡市,策略表现可能不佳,需要结合其他方法判断。
- 极端行情下,如快速变盘,策略可能失效,需要设置止损。
####策略优化方向
- 引入更多指标,如成交量、波动率等,丰富趋势判断维度,提高信号可靠性。
- 对参数进行优化,如ATR倍数、EMA周期等,找到最优参数组合,提高策略稳定性。
- 加入仓位管理,如根据ATR动态调整仓位,控制单笔风险敞口。
- 设置止损和止盈,控制单笔最大亏损和最大收益,提高风险收益比。
- 结合其他策略,如突破策略、均值回归策略等,形成策略组合,提高整体稳健性。
####总结 该策略利用EMA、最高价、最低价等技术指标,结合ATR构建动态通道,通过突破最高价和最低价产生交易信号,以捕捉趋势行情,是一个简单实用的趋势追踪策略。策略参数可调,适应性和灵活性较好,但在震荡市表现可能欠佳,需要通过引入更多指标、优化参数、加入风控等方式进一步优化和改进。
||
####Overview This strategy uses technical indicators such as Exponential Moving Average (EMA), highest price, lowest price, and Average True Range (ATR) to identify the current trend direction by analyzing the relationship between price and EMA, highest price, and lowest price. It generates a buy signal when the price breaks above the lowest price and a sell signal when the price breaks below the highest price or reaches the dynamic resistance level, aiming to capture trend movements and achieve excess returns.
####Strategy Principle
- Calculate ATR to measure market volatility and provide a basis for constructing dynamic channels.
- Calculate the highest and lowest prices as the foundation for determining trend direction.
- Calculate EMA_HL, which is the EMA of the highest and lowest prices, as the centerline of the dynamic channel.
- Calculate EMA_HIGHEST and EMA_LOWEST by adding and subtracting a certain multiple of ATR from EMA_HL to obtain the upper and lower bands.
- Calculate SELL_LINE by adding a certain multiple of ATR to the highest price to create a dynamic resistance level.
- Generate a buy signal when EMA_LOWEST breaks above the lowest price and the closing price is below EMA_MID.
- Generate a sell signal when EMA_HIGHEST breaks below the highest price and the closing price is above EMA_MID, or when the highest price reaches SELL_LINE.
####Strategy Advantages
- Utilizes EMA, highest price, lowest price, and other indicators to comprehensively judge the trend, resulting in reliable signals.
- Incorporates ATR as a measure of volatility to construct dynamic channels, adapting to different market conditions.
- Sets SELL_LINE as a dynamic resistance level to timely lock in profits and control drawdown risk.
- Parameters are adjustable, making the strategy suitable for different instruments and timeframes, with certain universality and flexibility.
####Strategy Risks
- Trend identification may lag, leading to suboptimal entry timing.
- Improper parameter settings may result in frequent signals and increased trading costs.
- The strategy may not perform well in rangebound markets and requires additional methods for judgment.
- In extreme market conditions, such as rapid trend reversals, the strategy may fail, requiring stop-loss settings.
####Strategy Optimization Directions
- Introduce more indicators, such as trading volume and volatility, to enrich trend judgment dimensions and improve signal reliability.
- Optimize parameters, such as ATR multiples and EMA periods, to find the optimal parameter combination and enhance strategy stability.
- Incorporate position management, such as dynamically adjusting positions based on ATR, to control single-trade risk exposure.
- Set stop-loss and take-profit levels to control maximum loss and maximum profit per trade, improving the risk-reward ratio.
- Combine with other strategies, such as breakout strategies and mean reversion strategies, to form a strategy portfolio and improve overall robustness.
####Summary This strategy utilizes technical indicators like EMA, highest price, and lowest price, combined with ATR to construct dynamic channels. It generates trading signals by breaking above the lowest price and breaking below the highest price to capture trend movements. It is a simple and practical trend-following strategy with adjustable parameters, offering good adaptability and flexibility. However, its performance may be suboptimal in rangebound markets, requiring further optimization and improvement through introducing more indicators, optimizing parameters, and adding risk controls. [/trans]
Source (PineScript)
/*backtest
start: 2023-05-05 00:00:00
end: 2024-05-10 00:00:00
period: 1d
basePeriod: 1h
exchanges: [{"eid":"Futures_Binance","currency":"BTC_USDT"}]
*/

// This Pine Script™ code is subject to the terms of the Mozilla Public License 2.0 at https://mozilla.org/MPL/2.0/
// © Maboi_q

//@version=5
strategy("buy sell Trend", overlay=true)

atr_length = input.int(defval=14, title='atr length')
highest_length = input.int(defval=60, title='highest length')
highest_s_length = input.int(defval=60, title='sell highest length')
lowest_length = input.int(defval=30, title='lowest length')
sell_l_length = input.int(defval=55, title='sell line length')

f = 2.382
f2 = 5.618

atr = ta.atr(atr_length)
highest = ta.highest(highest_length)
lowest = ta.lowest(lowest_length)

f_atr = atr * f
ema_hl = ta.ema((highest[1] + lowest[1]) / 2, 14)
ema_highest = ema_hl + f_atr
ema_lowest = ema_hl - f_atr
ema_mid = (ema_highest + ema_lowest) / 2

bs_hi = ta.highest(highest_s_length)
f_atr2 = atr * f2
sell_line = ta.ema(bs_hi[1] + f_atr2, sell_l_length)

buy_cond = ta.crossover(ema_lowest, lowest) and close < ema_mid
sell_cond = (ta.crossunder(ema_highest, highest) and close > ema_mid) or high >= sell_line

if buy_cond
    strategy.entry('BUY', strategy.long)

if sell_cond
    strategy.entry('SELL', strategy.short)


plot(sell_line, color=color.new(color.maroon, 50))
plot(highest, color=color.new(color.red, 50))
plot(lowest, color=color.new(color.green, 50))
plot(ema_highest, color=color.new(color.blue, 50))
// plot(ema_mid, color=color.new(color.gray, 50))
plot(ema_lowest, color=color.new(color.blue, 50))

plotshape(buy_cond, title='buy', style=shape.triangleup, location=location.belowbar,
 color=color.green, textcolor=color.green, size=size.tiny)

plotshape(sell_cond, title='sell', style=shape.triangledown, location=location.abovebar,
 color=color.red, textcolor=color.red, size=size.tiny)
Detail
https://www.fmz.com/strategy/451023
Last Modified
2024-05-11 11:31:46