
18 KiB
Name
EMA交叉RSI中性区域动态风控策略-Dynamic-EMA-Crossover-RSI-Neutral-Zone-Strategy-with-ATR-Risk-Management
Author
ianzeng123
Strategy Description
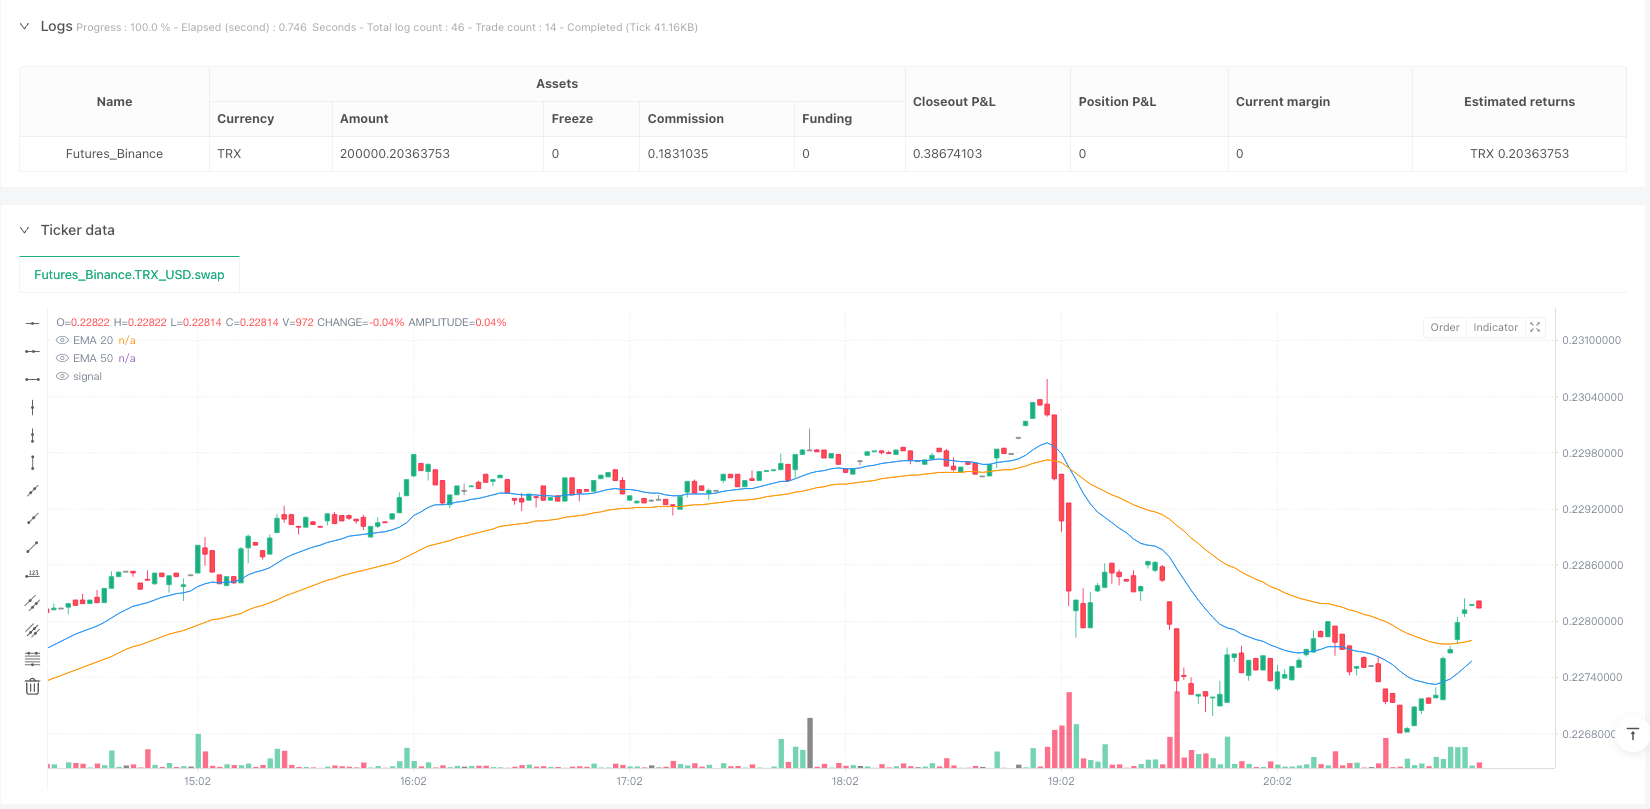
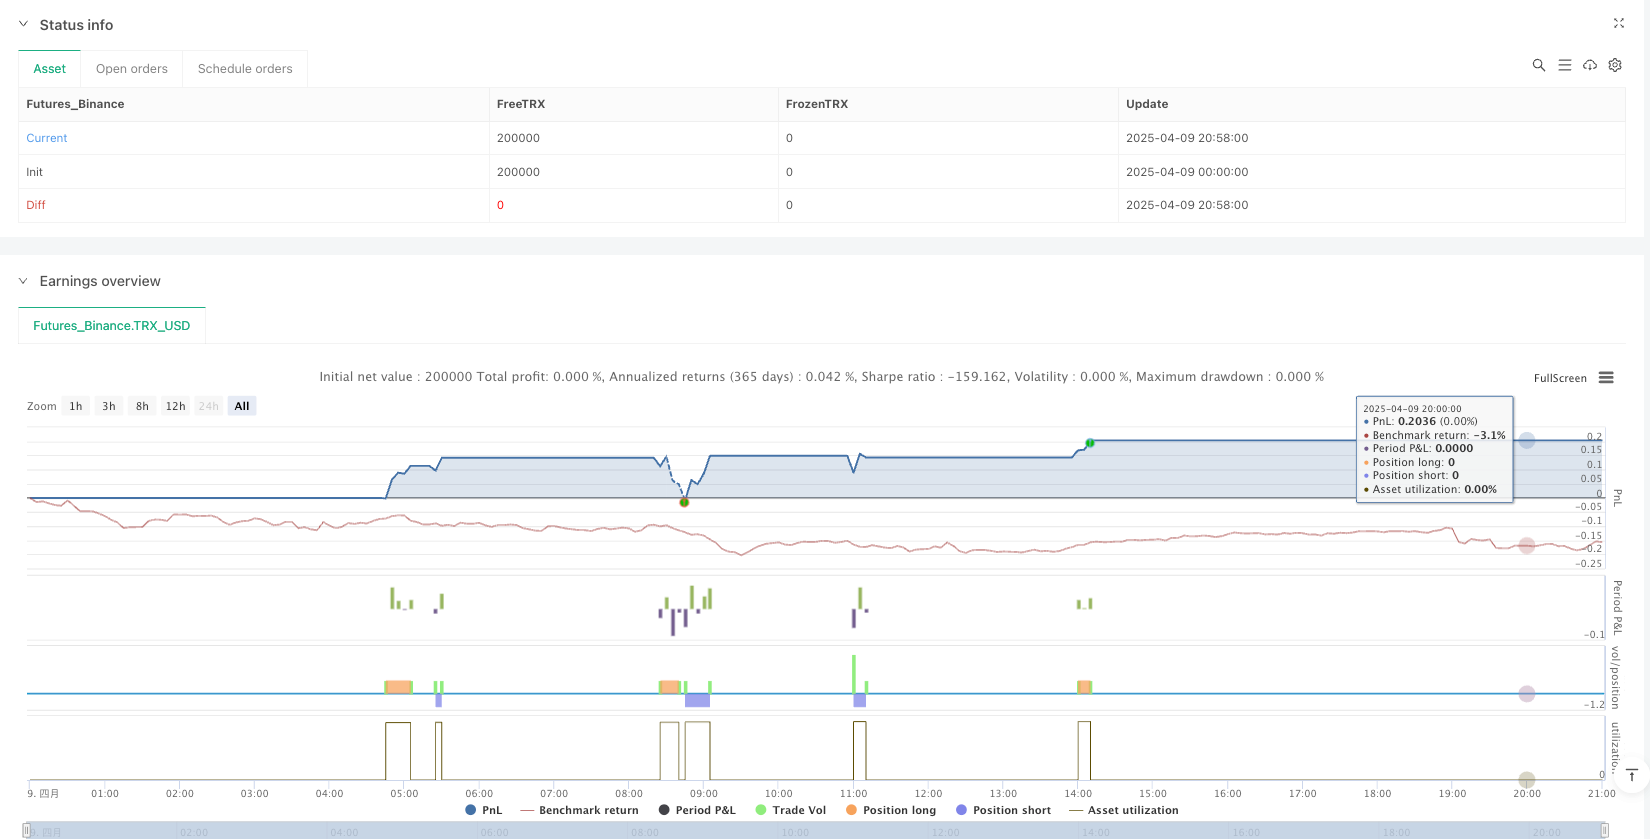
[trans]
策略概述
EMA交叉RSI中性区域动态风控策略是一种结合技术指标与风险管理的量化交易方法。该策略主要利用快速与慢速指数移动平均线(EMA)的交叉信号,并结合相对强弱指标(RSI)的中性区域过滤,同时采用平均真实范围(ATR)动态调整止损和止盈位置。这种组合使得策略既能捕捉市场趋势转变的关键时刻,又能避免在极端超买超卖区域入场,同时根据市场波动性自适应调整风险参数。
策略原理
该策略的核心原理基于以下几个关键组件的协同作用:
-
EMA交叉信号:快速EMA(默认20周期)与慢速EMA(默认50周期)的交叉被用作主要趋势方向指标。当快速EMA向上穿越慢速EMA时产生买入信号;当快速EMA向下穿越慢速EMA时产生卖出信号。这种交叉通常被视为趋势反转或确认的重要技术指标。
-
RSI中性区域过滤:策略引入了RSI指标(默认14周期)作为二级过滤条件,只在RSI处于中性区域时才执行交易。具体而言:
- 买入条件要求RSI大于40且小于70,避免在接近超买区域入场
- 卖出条件要求RSI小于60且大于30,避免在接近超卖区域入场 这种设计有效避免了在RSI极端区域交易,降低了逆势交易的风险。
-
ATR动态风险管理:策略使用ATR(14周期)作为波动性指标,并通过风险乘数(默认为1)动态计算止损和止盈位置:
- 止损距离 = ATR × 风险乘数
- 止盈距离 = ATR × 风险乘数 对于买入订单,止损设置在当前K线低点下方,止盈设置在当前K线高点上方;卖出订单则相反。
-
执行逻辑:当满足买入条件时,系统执行多头入场,并设置相应的止损和止盈;当满足卖出条件时,系统执行空头入场,同样设置止损和止盈。策略以图形化方式在图表上标注"BUY"和"SELL"信号,便于直观理解交易时机。
策略优势
深入分析该策略代码,可以总结出以下显著优势:
-
多指标确认:结合EMA交叉和RSI指标提供双重确认,降低了假信号风险。EMA交叉捕捉趋势变化,而RSI确保在相对安全的价格区域入场,避免追高杀低。
-
自适应风险管理:使用ATR动态调整止损和止盈距离,使策略能够适应不同市场环境和波动状况。在波动性高的市场中自动扩大止损范围,在波动性低的市场中相应缩小,保持风险比例一致性。
-
预设退出机制:策略包含明确的止损和止盈设置,确保每笔交易都有预定义的退出点,有效控制单笔交易风险,避免"希望交易"和情绪决策。
-
可视化交易信号:策略在图表上清晰标示买卖信号,便于回测分析和实时监控,提高策略透明度和可理解性。
-
参数可调整性:策略提供多个可调整参数,包括EMA周期、RSI阈值和风险乘数,使交易者能够根据不同市场条件和个人风险偏好进行优化和定制。
策略风险
尽管该策略设计合理,但仍存在以下潜在风险和挑战:
-
横盘市场效果不佳:在没有明确趋势的横盘市场中,EMA交叉可能产生频繁的假信号,导致连续亏损交易。解决方法是引入额外的横盘市场过滤器,例如波动率指标或ADX趋势强度指标。
-
快速行情反转风险:在急剧的市场反转中,策略的止损可能不够及时,导致较大损失。可以考虑实现追踪止损或引入更敏感的市场反转指标来缓解此风险。
-
参数优化过拟合:过度优化EMA周期、RSI阈值和风险乘数可能导致策略在历史数据上表现良好但实盘效果不佳。建议使用步进测试和样本外验证来减轻过拟合风险。
-
缺乏交易量过滤:当前策略未考虑交易量因素,可能在低流动性环境下产生不可执行的信号。建议增加交易量确认条件,确保信号质量。
-
固定乘数局限性:虽然ATR提供了波动性自适应能力,但固定的风险乘数可能不适合所有市场环境。考虑实现动态调整的风险乘数,根据市场状况和历史波动特征自动调整。
策略优化方向
基于代码分析,该策略有以下几个可能的优化方向:
-
增加趋势强度过滤:引入ADX(平均方向指数)作为趋势强度过滤器,仅在ADX高于某个阈值(如25)时才执行交易,避免在弱趋势或横盘市场中的假信号。
-
动态RSI阈值:当前RSI采用固定的中性区域判断,可以考虑根据市场波动状况动态调整RSI阈值,在波动剧烈的市场中扩大中性区域范围,在平稳市场中收窄。
-
实现追踪止损:用追踪止损替代固定止损,特别是在强趋势市场中,可以锁定更多利润并降低回撤。这可以通过监控价格移动并动态调整止损位置来实现。
-
优化风险回报比:当前策略的止损和止盈距离相等(都是ATR×乘数),可以考虑设置非对称的风险回报比,例如将止盈设为2倍或3倍的止损距离,提高期望收益。
-
时间过滤器:增加基于时间框架的过滤条件,例如仅在特定交易时段执行交易,或者根据市场的高波动性时间段调整参数,避开低效交易时段。
-
增加波动突破确认:在EMA交叉信号出现后,增加价格波动确认条件,例如要求价格在信号出现后的N个周期内突破前期高低点,提高信号质量。
-
资金管理优化:目前策略使用固定头寸大小,可以实现基于波动性的仓位管理,在低波动环境增加头寸,高波动环境减少头寸,保持风险敞口一致。
总结
EMA交叉RSI中性区域动态风控策略是一种结合趋势跟踪、动量过滤和自适应风险管理的综合性量化交易系统。它通过EMA交叉捕捉趋势转变点,用RSI中性区域过滤避免极端区域交易,并采用ATR动态调整风险参数,形成一个逻辑完整的交易框架。
该策略的优势在于多指标确认减少假信号、自适应风险管理适应不同市场环境,以及清晰的可视化信号展示。但同时也存在横盘市场表现不佳、快速反转风险等局限性。
通过增加趋势强度过滤、实现动态RSI阈值、采用追踪止损、优化风险回报比等方向的改进,可以进一步提升策略的稳健性和适应性。特别是引入更先进的市场状态识别机制,能够使策略在不同市场环境中灵活调整参数和执行逻辑。
总体而言,这是一个基础扎实、逻辑清晰的中长期趋势跟踪策略框架,适合进一步定制和优化。它不仅提供了交易信号生成机制,还包含完整的风险管理体系,为量化交易提供了良好的起点。 ||
Strategy Overview
The Dynamic EMA Crossover RSI Neutral Zone Strategy with ATR Risk Management is a quantitative trading approach that combines technical indicators with risk management principles. This strategy primarily utilizes the crossover signals between fast and slow Exponential Moving Averages (EMA), filtered by the Relative Strength Index (RSI) neutral zone, while employing Average True Range (ATR) for dynamic stop-loss and take-profit adjustments. This combination allows the strategy to capture key market trend reversals while avoiding entry during extreme overbought or oversold conditions, simultaneously adapting risk parameters based on market volatility.
Strategy Principles
The core principles of this strategy are based on the synchronized operation of several key components:
-
EMA Crossover Signals: The crossover between the fast EMA (default 20 periods) and slow EMA (default 50 periods) serves as the primary trend direction indicator. A buy signal is generated when the fast EMA crosses above the slow EMA; a sell signal is generated when the fast EMA crosses below the slow EMA. This crossover is typically viewed as an important technical indicator for trend reversal or confirmation.
-
RSI Neutral Zone Filtering: The strategy incorporates the RSI indicator (default 14 periods) as a secondary filter condition, executing trades only when RSI is within a neutral zone. Specifically:
- Buy conditions require RSI to be greater than 40 and less than 70, avoiding entry near overbought territory
- Sell conditions require RSI to be less than 60 and greater than 30, avoiding entry near oversold territory This design effectively prevents trading in extreme RSI zones, reducing the risk of counter-trend trading.
-
ATR Dynamic Risk Management: The strategy uses ATR (14 periods) as a volatility indicator and dynamically calculates stop-loss and take-profit levels through a risk multiplier (default 1):
- Stop-loss distance = ATR × Risk Multiplier
- Take-profit distance = ATR × Risk Multiplier For buy orders, the stop-loss is set below the current candle's low, and take-profit above the candle's high; for sell orders, it's the opposite.
-
Execution Logic: When buy conditions are met, the system executes a long entry with corresponding stop-loss and take-profit; when sell conditions are met, the system executes a short entry with similar risk parameters. The strategy visually marks "BUY" and "SELL" signals on the chart for intuitive understanding of trading opportunities.
Strategy Advantages
Through in-depth analysis of the strategy code, we can summarize the following significant advantages:
-
Multi-Indicator Confirmation: Combining EMA crossover and RSI indicators provides double confirmation, reducing the risk of false signals. EMA crossovers capture trend changes, while RSI ensures entry in relatively safe price zones, avoiding chasing highs or lows.
-
Adaptive Risk Management: Using ATR to dynamically adjust stop-loss and take-profit distances enables the strategy to adapt to different market environments and volatility conditions. It automatically widens stop-loss ranges in highly volatile markets and narrows them in low-volatility markets, maintaining consistent risk proportionality.
-
Predefined Exit Mechanisms: The strategy includes clear stop-loss and take-profit settings, ensuring that each trade has predefined exit points, effectively controlling single-trade risk and avoiding "hope trades" and emotional decision-making.
-
Visualized Trading Signals: The strategy clearly marks buy and sell signals on the chart, facilitating backtesting analysis and real-time monitoring, enhancing strategy transparency and comprehensibility.
-
Parametric Adjustability: The strategy provides multiple adjustable parameters, including EMA periods, RSI thresholds, and risk multipliers, allowing traders to optimize and customize according to different market conditions and personal risk preferences.
Strategy Risks
Despite its well-designed structure, the strategy still faces the following potential risks and challenges:
-
Poor Performance in Ranging Markets: In ranging markets without clear trends, EMA crossovers may generate frequent false signals, leading to consecutive losing trades. The solution is to introduce additional range-market filters, such as volatility indicators or ADX trend strength indicators.
-
Rapid Market Reversal Risk: In sharp market reversals, the strategy's stop-loss may not be timely enough, resulting in larger losses. Implementing trailing stops or introducing more sensitive market reversal indicators can mitigate this risk.
-
Parameter Optimization Overfitting: Excessive optimization of EMA periods, RSI thresholds, and risk multipliers may lead to good performance on historical data but poor results in live trading. Step-testing and out-of-sample validation are recommended to reduce overfitting risk.
-
Lack of Volume Filtering: The current strategy does not consider volume factors, potentially generating non-executable signals in low-liquidity environments. Adding volume confirmation conditions is recommended to ensure signal quality.
-
Fixed Multiplier Limitations: Although ATR provides volatility adaptability, a fixed risk multiplier may not be suitable for all market environments. Consider implementing a dynamically adjusting risk multiplier that automatically adapts based on market conditions and historical volatility characteristics.
Strategy Optimization Directions
Based on code analysis, the strategy has several potential optimization directions:
-
Add Trend Strength Filtering: Introduce ADX (Average Directional Index) as a trend strength filter, executing trades only when ADX is above a certain threshold (such as 25), avoiding false signals in weak trend or ranging markets.
-
Dynamic RSI Thresholds: The current RSI uses fixed neutral zone judgments. Consider dynamically adjusting RSI thresholds based on market volatility conditions, widening the neutral zone range in volatile markets and narrowing it in stable markets.
-
Implement Trailing Stops: Replace fixed stops with trailing stops, especially in strong trend markets, to lock in more profits and reduce drawdowns. This can be implemented by monitoring price movements and dynamically adjusting stop positions.
-
Optimize Risk-Reward Ratio: The current strategy has equal stop-loss and take-profit distances (both ATR × multiplier). Consider setting asymmetric risk-reward ratios, such as setting take-profit at 2x or 3x the stop-loss distance, improving expected returns.
-
Time Filters: Add time-frame based filtering conditions, such as executing trades only during specific trading sessions, or adjusting parameters based on high-volatility market periods, avoiding inefficient trading times.
-
Add Volatility Breakout Confirmation: After EMA crossover signals appear, add price volatility confirmation conditions, such as requiring prices to break through previous highs/lows within N periods after the signal appears, improving signal quality.
-
Money Management Optimization: The current strategy uses fixed position sizes. Implement volatility-based position management, increasing positions in low-volatility environments and decreasing them in high-volatility environments, maintaining consistent risk exposure.
Summary
The Dynamic EMA Crossover RSI Neutral Zone Strategy with ATR Risk Management is a comprehensive quantitative trading system combining trend following, momentum filtering, and adaptive risk management. It captures trend reversal points through EMA crossovers, filters extreme zone trading with RSI neutral zones, and employs ATR to dynamically adjust risk parameters, forming a logically complete trading framework.
The strategy's advantages lie in multi-indicator confirmation reducing false signals, adaptive risk management accommodating different market environments, and clear visualization of signals. However, it also has limitations such as poor performance in ranging markets and rapid reversal risks.
By adding trend strength filtering, implementing dynamic RSI thresholds, adopting trailing stops, optimizing risk-reward ratios, and other improvements, the strategy's robustness and adaptability can be further enhanced. Particularly, introducing more advanced market state recognition mechanisms would allow the strategy to flexibly adjust parameters and execution logic in different market environments.
Overall, this is a fundamentally sound, logically clear medium to long-term trend-following strategy framework suitable for further customization and optimization. It not only provides a trading signal generation mechanism but also includes a complete risk management system, offering a solid starting point for quantitative trading.[/trans]
Source (PineScript)
/*backtest
start: 2025-04-09 00:00:00
end: 2025-04-09 21:00:00
period: 2m
basePeriod: 2m
exchanges: [{"eid":"Futures_Binance","currency":"TRX_USD"}]
*/

// This Pine Script® code is subject to the terms of the Mozilla Public License 2.0 at https://mozilla.org/MPL/2.0/
// © MarketTipsy

//@version=5
strategy("ScalpSwing Backtest Strategy", overlay=true, default_qty_type=strategy.fixed, default_qty_value=1)

// === Inputs ===
emaFastLength = input.int(20, title="Fast EMA")
emaSlowLength = input.int(50, title="Slow EMA")
rsiLength = input.int(14, title="RSI Length")
rsiOB = input.int(70, title="RSI Overbought")
rsiOS = input.int(30, title="RSI Oversold")
riskMultiplier = input.float(1, title="Risk Multiplier (x ATR)", minval=0.1, maxval=5.0)

// === Calculations ===
emaFast = ta.ema(close, emaFastLength)
emaSlow = ta.ema(close, emaSlowLength)
rsi = ta.rsi(close, rsiLength)

// === ATR Stop Loss/Take Profit ===
atr = ta.atr(14)
sl = atr * riskMultiplier
tp = atr * riskMultiplier

// === Entry Conditions ===
buyCond = ta.crossover(emaFast, emaSlow) and (rsi > 40 and rsi < rsiOB)
sellCond = ta.crossunder(emaFast, emaSlow) and (rsi < 60 and rsi > rsiOS)

// === Plot EMAs ===
plot(emaFast, title="EMA 20", color=color.blue)
plot(emaSlow, title="EMA 50", color=color.orange)

// === Buy/Sell signals ===
plotshape(buyCond, title="Buy Signal", location=location.belowbar, color=color.green, style=shape.labelup, text="BUY")
plotshape(sellCond, title="Sell Signal", location=location.abovebar, color=color.red, style=shape.labeldown, text="SELL")

// === Strategy Execution ===
if (buyCond)
    strategy.entry("Buy", strategy.long, stop=low - sl, limit=high + tp)

if (sellCond)
    strategy.entry("Sell", strategy.short, stop=high + sl, limit=low - tp)

// === Strategy Performance Metrics ===
strategy.exit("Exit Buy", from_entry="Buy", stop=low - sl, limit=high + tp)
strategy.exit("Exit Sell", from_entry="Sell", stop=high + sl, limit=low - tp)
Detail
https://www.fmz.com/strategy/490916
Last Modified
2025-04-17 14:38:00