
8.8 KiB
Name
EMA交叉策略与RSI背离30分钟趋势识别和价格竭尽-EMA-Cross-Strategy-with-RSI-Divergence-30-Minute-Trend-Identification-and-Price-Exhaustion
Author
ChaoZhang
Strategy Description
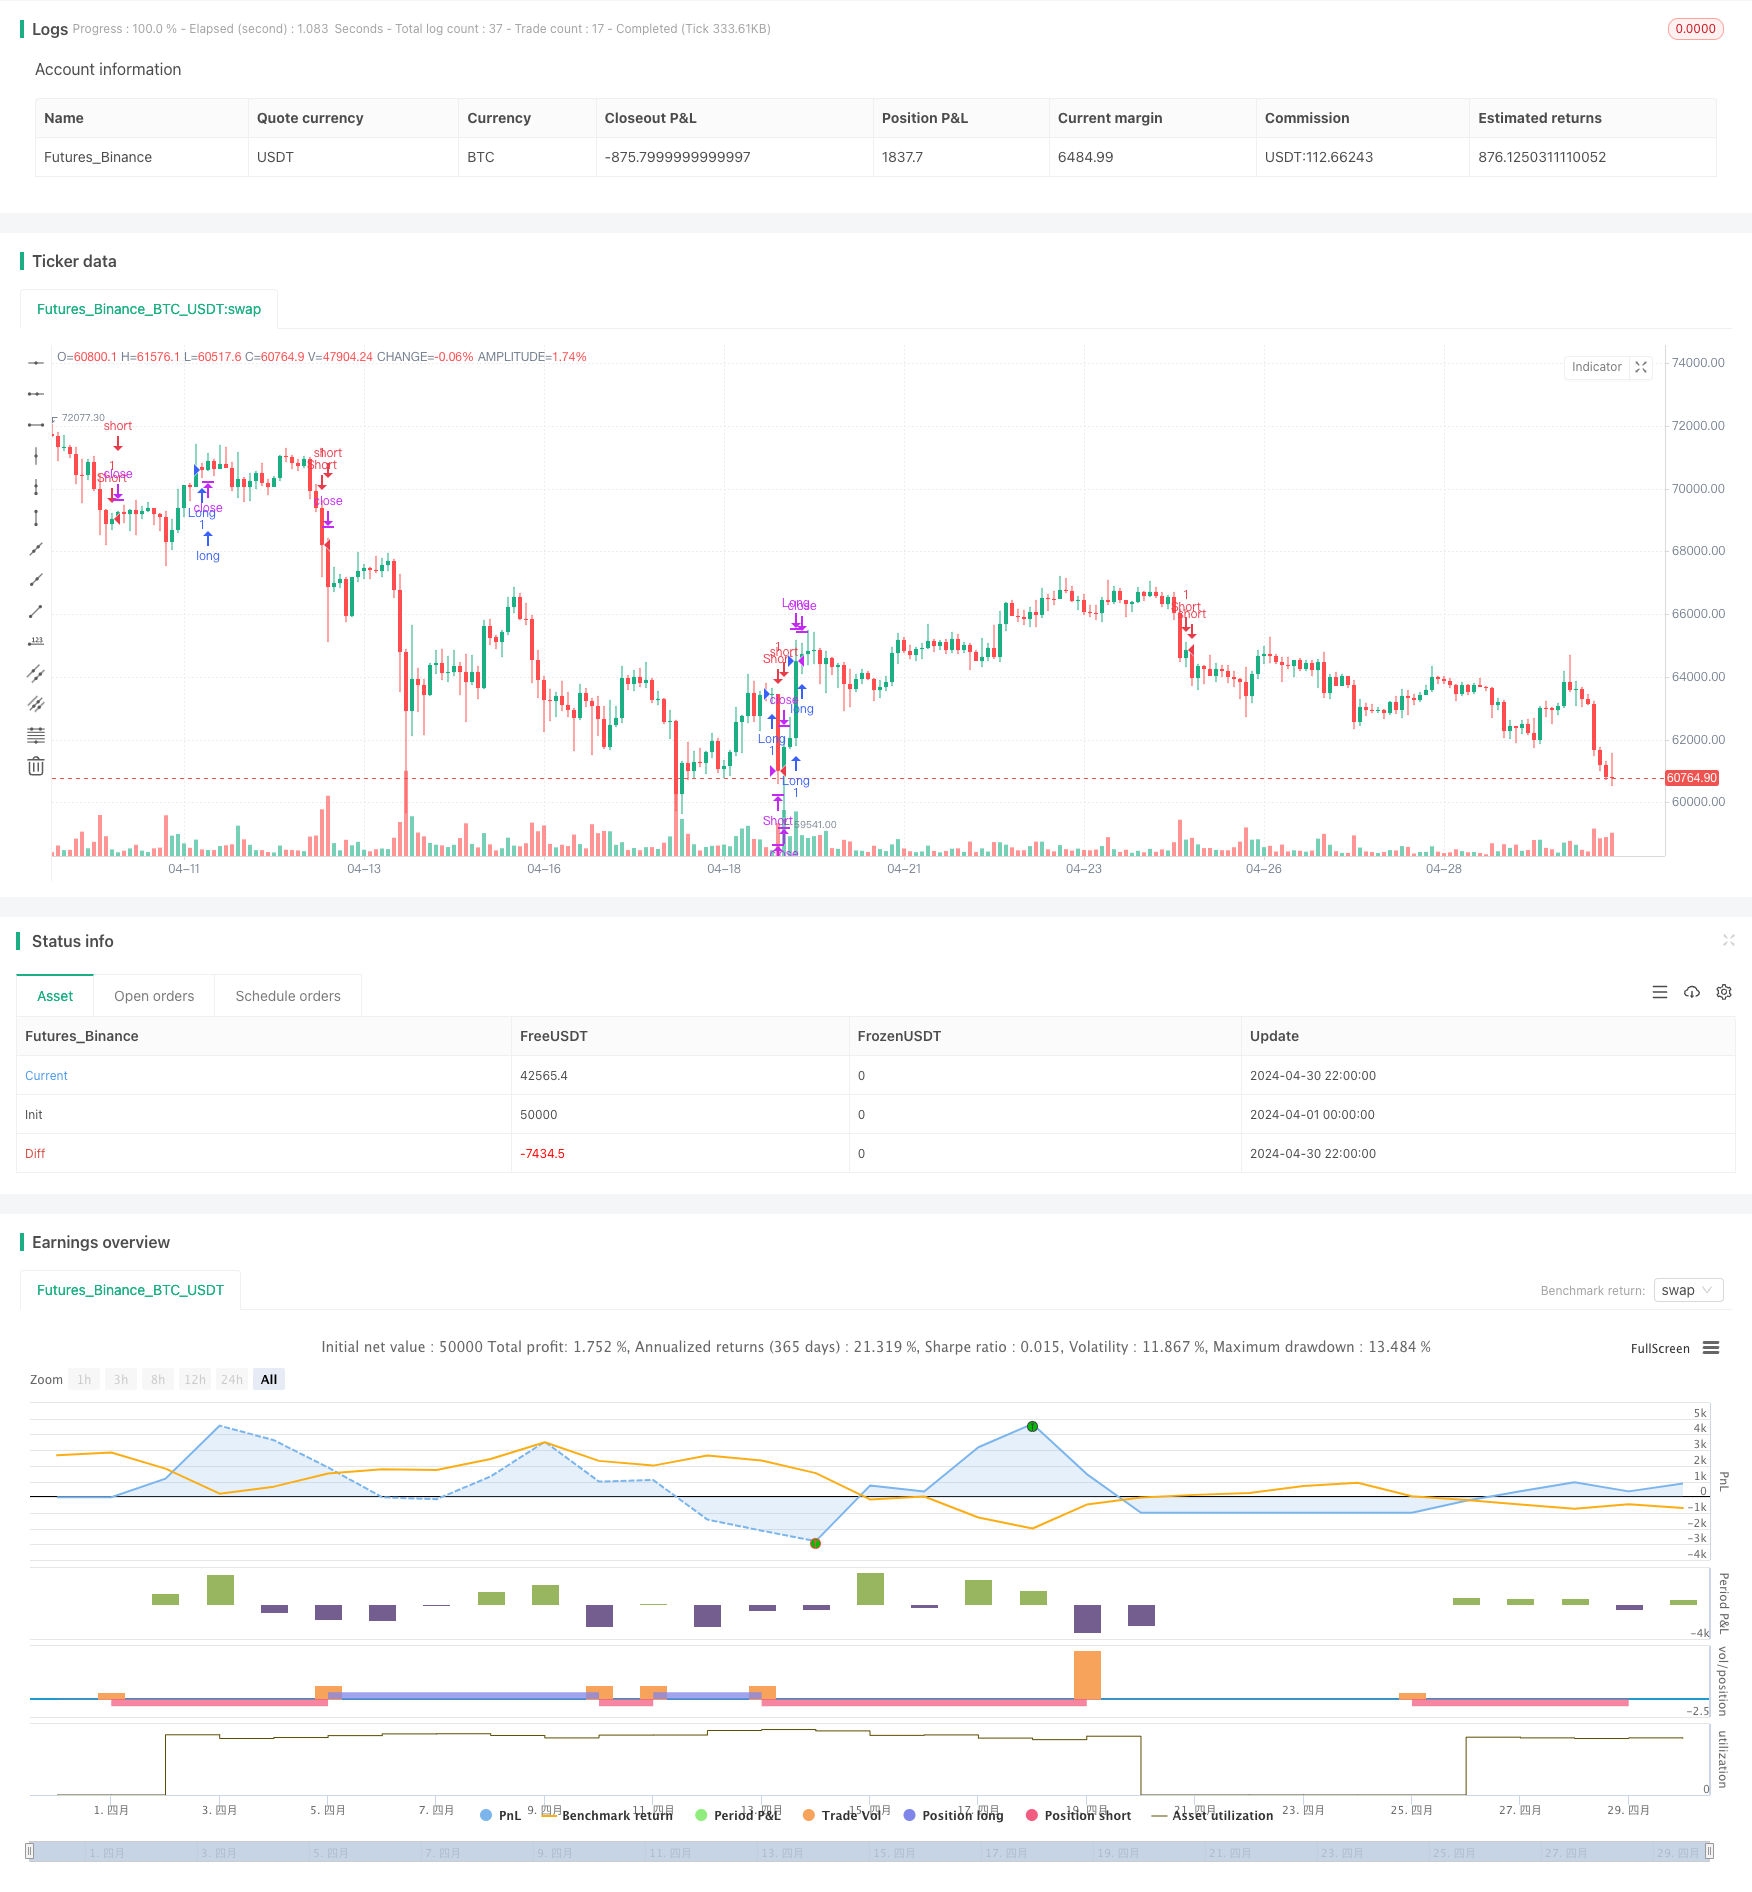 [trans]
概述
该策略结合了EMA交叉、RSI背离、30分钟趋势识别和价格竭尽等技术指标,旨在捕捉市场趋势和价格拐点。策略通过EMA13和EMA26的交叉来确定趋势方向,利用RSI背离来识别潜在的趋势反转,同时考虑30分钟时间框架内的趋势状态和价格竭尽情况,以优化进场点位。
策略原理
- EMA交叉:当EMA13上穿EMA26时产生买入信号,下穿时产生卖出信号。
- RSI背离:当价格创新低而RSI未创新低时,产生看涨背离;当价格创新高而RSI未创新高时,产生看跌背离。
- 30分钟趋势识别:通过比较收盘价与30分钟EMA5和EMA10的关系,判断当前30分钟时间框架内的趋势状态。
- 价格竭尽:利用RSI指标识别价格的超买和超卖状态。
- 交易信号:综合以上因素,在EMA交叉、RSI背离、30分钟上升趋势且价格超卖时产生买入信号;在EMA交叉、RSI背离、30分钟下降趋势且价格超买时产生卖出信号。
策略优势
- 多维度分析:结合趋势、动量和价格竭尽等多个维度,提高信号准确性。
- 趋势确认:通过30分钟时间框架内的趋势判断,避免在震荡市中频繁交易。
- 拐点捕捉:利用RSI背离和价格竭尽,捕捉潜在的趋势反转点。
- 风险控制:在趋势确认和拐点信号出现后再进行交易,降低风险。
策略风险
- 参数优化:策略中使用的EMA周期、RSI周期等参数可能需要根据不同市场和资产进行优化。
- 趋势转换:在趋势转换初期,EMA交叉和RSI背离信号可能会出现延迟或误导。
- 假信号:某些情况下,RSI背离可能产生假信号,导致错误交易。
- 突发事件:策略可能无法应对市场中的突发事件和非理性波动。
策略优化方向
- 动态参数优化:根据市场状态和波动率,动态调整EMA和RSI周期等参数。
- 趋势强度过滤:引入ADX等趋势强度指标,过滤弱趋势或震荡市中的信号。
- 多时间框架确认:结合多个时间框架的趋势和信号,提高信号可靠性。
- 止损和止盈:引入合适的止损和止盈策略,进一步控制风险和优化收益。
总结
该策略通过结合EMA交叉、RSI背离、30分钟趋势识别和价格竭尽等技术指标,在多个维度上分析市场,以捕捉趋势和潜在的拐点。策略优势在于多维度分析、趋势确认、拐点捕捉和风险控制,但同时也存在参数优化、趋势转换、假信号和突发事件等风险。未来可以通过动态参数优化、趋势强度过滤、多时间框架确认以及止损和止盈等方面对策略进行优化,以进一步提高策略的稳健性和盈利能力。
||
Overview
This strategy combines technical indicators such as EMA crossover, RSI divergence, 30-minute trend identification, and price exhaustion to capture market trends and price turning points. The strategy determines the trend direction using the crossover of EMA13 and EMA26, identifies potential trend reversals using RSI divergence, and considers the trend status within the 30-minute timeframe and price exhaustion conditions to optimize entry points.
Strategy Principles
- EMA Crossover: A buy signal is generated when EMA13 crosses above EMA26, and a sell signal is generated when it crosses below.
- RSI Divergence: A bullish divergence occurs when the price makes a new low, but RSI does not; a bearish divergence occurs when the price makes a new high, but RSI does not.
- 30-Minute Trend Identification: The current trend status within the 30-minute timeframe is determined by comparing the closing price with the 30-minute EMA5 and EMA10.
- Price Exhaustion: The RSI indicator is used to identify overbought and oversold conditions.
- Trading Signals: Combining the above factors, a buy signal is generated when there is an EMA crossover, RSI divergence, an uptrend in the 30-minute timeframe, and oversold conditions; a sell signal is generated when there is an EMA crossover, RSI divergence, a downtrend in the 30-minute timeframe, and overbought conditions.
Strategy Advantages
- Multi-dimensional Analysis: Combining multiple dimensions such as trend, momentum, and price exhaustion improves signal accuracy.
- Trend Confirmation: Avoids frequent trading in choppy markets by confirming trends within the 30-minute timeframe.
- Turning Point Capture: Captures potential trend reversal points using RSI divergence and price exhaustion.
- Risk Control: Reduces risk by trading only after trend confirmation and turning point signals appear.
Strategy Risks
- Parameter Optimization: The parameters used in the strategy, such as EMA and RSI periods, may need to be optimized for different markets and assets.
- Trend Transitions: During the early stages of a trend transition, EMA crossover and RSI divergence signals may be delayed or misleading.
- False Signals: In some cases, RSI divergence may generate false signals, leading to incorrect trades.
- Unexpected Events: The strategy may not be able to handle unexpected events and irrational market fluctuations.
Strategy Optimization Directions
- Dynamic Parameter Optimization: Dynamically adjust parameters such as EMA and RSI periods based on market conditions and volatility.
- Trend Strength Filtering: Introduce trend strength indicators like ADX to filter signals in weak trends or choppy markets.
- Multi-Timeframe Confirmation: Combine trends and signals from multiple timeframes to improve signal reliability.
- Stop Loss and Take Profit: Implement appropriate stop loss and take profit strategies to further control risk and optimize returns.
Summary
This strategy analyzes the market from multiple dimensions by combining technical indicators such as EMA crossover, RSI divergence, 30-minute trend identification, and price exhaustion to capture trends and potential turning points. The strategy's advantages lie in multi-dimensional analysis, trend confirmation, turning point capture, and risk control. However, it also faces risks such as parameter optimization, trend transitions, false signals, and unexpected events. In the future, the strategy can be optimized through dynamic parameter optimization, trend strength filtering, multi-timeframe confirmation, and the implementation of stop loss and take profit strategies to further improve its robustness and profitability. [/trans]
Source (PineScript)
/*backtest
start: 2024-04-01 00:00:00
end: 2024-04-30 23:59:59
period: 2h
basePeriod: 15m
exchanges: [{"eid":"Futures_Binance","currency":"BTC_USDT"}]
*/

//@version=5
strategy("EMA Cross Strategy with RSI Divergence, 30-Minute Trend Identification, and Price Exhaustion", overlay=true)

// Definição das médias móveis exponenciais para tendência de curto prazo (30 minutos)
EMA5_30min = ta.ema(close, 5)
EMA10_30min = ta.ema(close, 10)

// Definição das médias móveis exponenciais
EMA13 = ta.ema(close, 13)
EMA26 = ta.ema(close, 26)

// RSI com período padrão de 7
rsi = ta.rsi(close, 7)

// Detecção do cruzamento das EMAs
crossUp = ta.crossover(EMA13, EMA26)
crossDown = ta.crossunder(EMA13, EMA26)

// Detecção de divergência no RSI
bullishDivergence = ta.crossunder(close, EMA13) and ta.crossunder(rsi, 30)
bearishDivergence = ta.crossover(close, EMA13) and ta.crossover(rsi, 70)

// Geração de sinais de entrada
entrySignal = crossUp ? 1 : (crossDown ? -1 : 0)

// Abertura da posição
if (entrySignal == 1)
    strategy.entry("Long", strategy.long)
else if (entrySignal == -1)
    strategy.entry("Short", strategy.short)

// Fechamento da posição
if (entrySignal == 1 and ta.crossover(close, EMA26))
    strategy.close("Long")
else if (entrySignal == -1 and ta.crossunder(close, EMA26))
    strategy.close("Short")

// Comando de compra e venda
buySignal = crossUp and close > EMA13 and close > EMA26
sellSignal = crossDown and close < EMA13 and close < EMA26

// Aplicando a lógica de divergência RSI
if (bullishDivergence)
    strategy.entry("Bullish Divergence", strategy.long)
if (bearishDivergence)
    strategy.entry("Bearish Divergence", strategy.short)

// Identificação de tendência nos últimos 30 minutos
isUptrend30min = close > EMA5_30min and close > EMA10_30min
isDowntrend30min = close < EMA5_30min and close < EMA10_30min

// Identificação de exaustão do preço com base no RSI
isOversold = rsi < 30
isOverbought = rsi > 70

// Executando os sinais de compra e venda
if (buySignal and isUptrend30min and isOversold)
    strategy.entry("Buy", strategy.long)
if (sellSignal and isDowntrend30min and isOverbought)
    strategy.entry("Sell", strategy.short)
Detail
https://www.fmz.com/strategy/451399
Last Modified
2024-05-14 16:23:48