
9.6 KiB
Name
EMA与RSI交叉策略-EMA-RSI-Crossover-Strategy
Author
ChaoZhang
Strategy Description
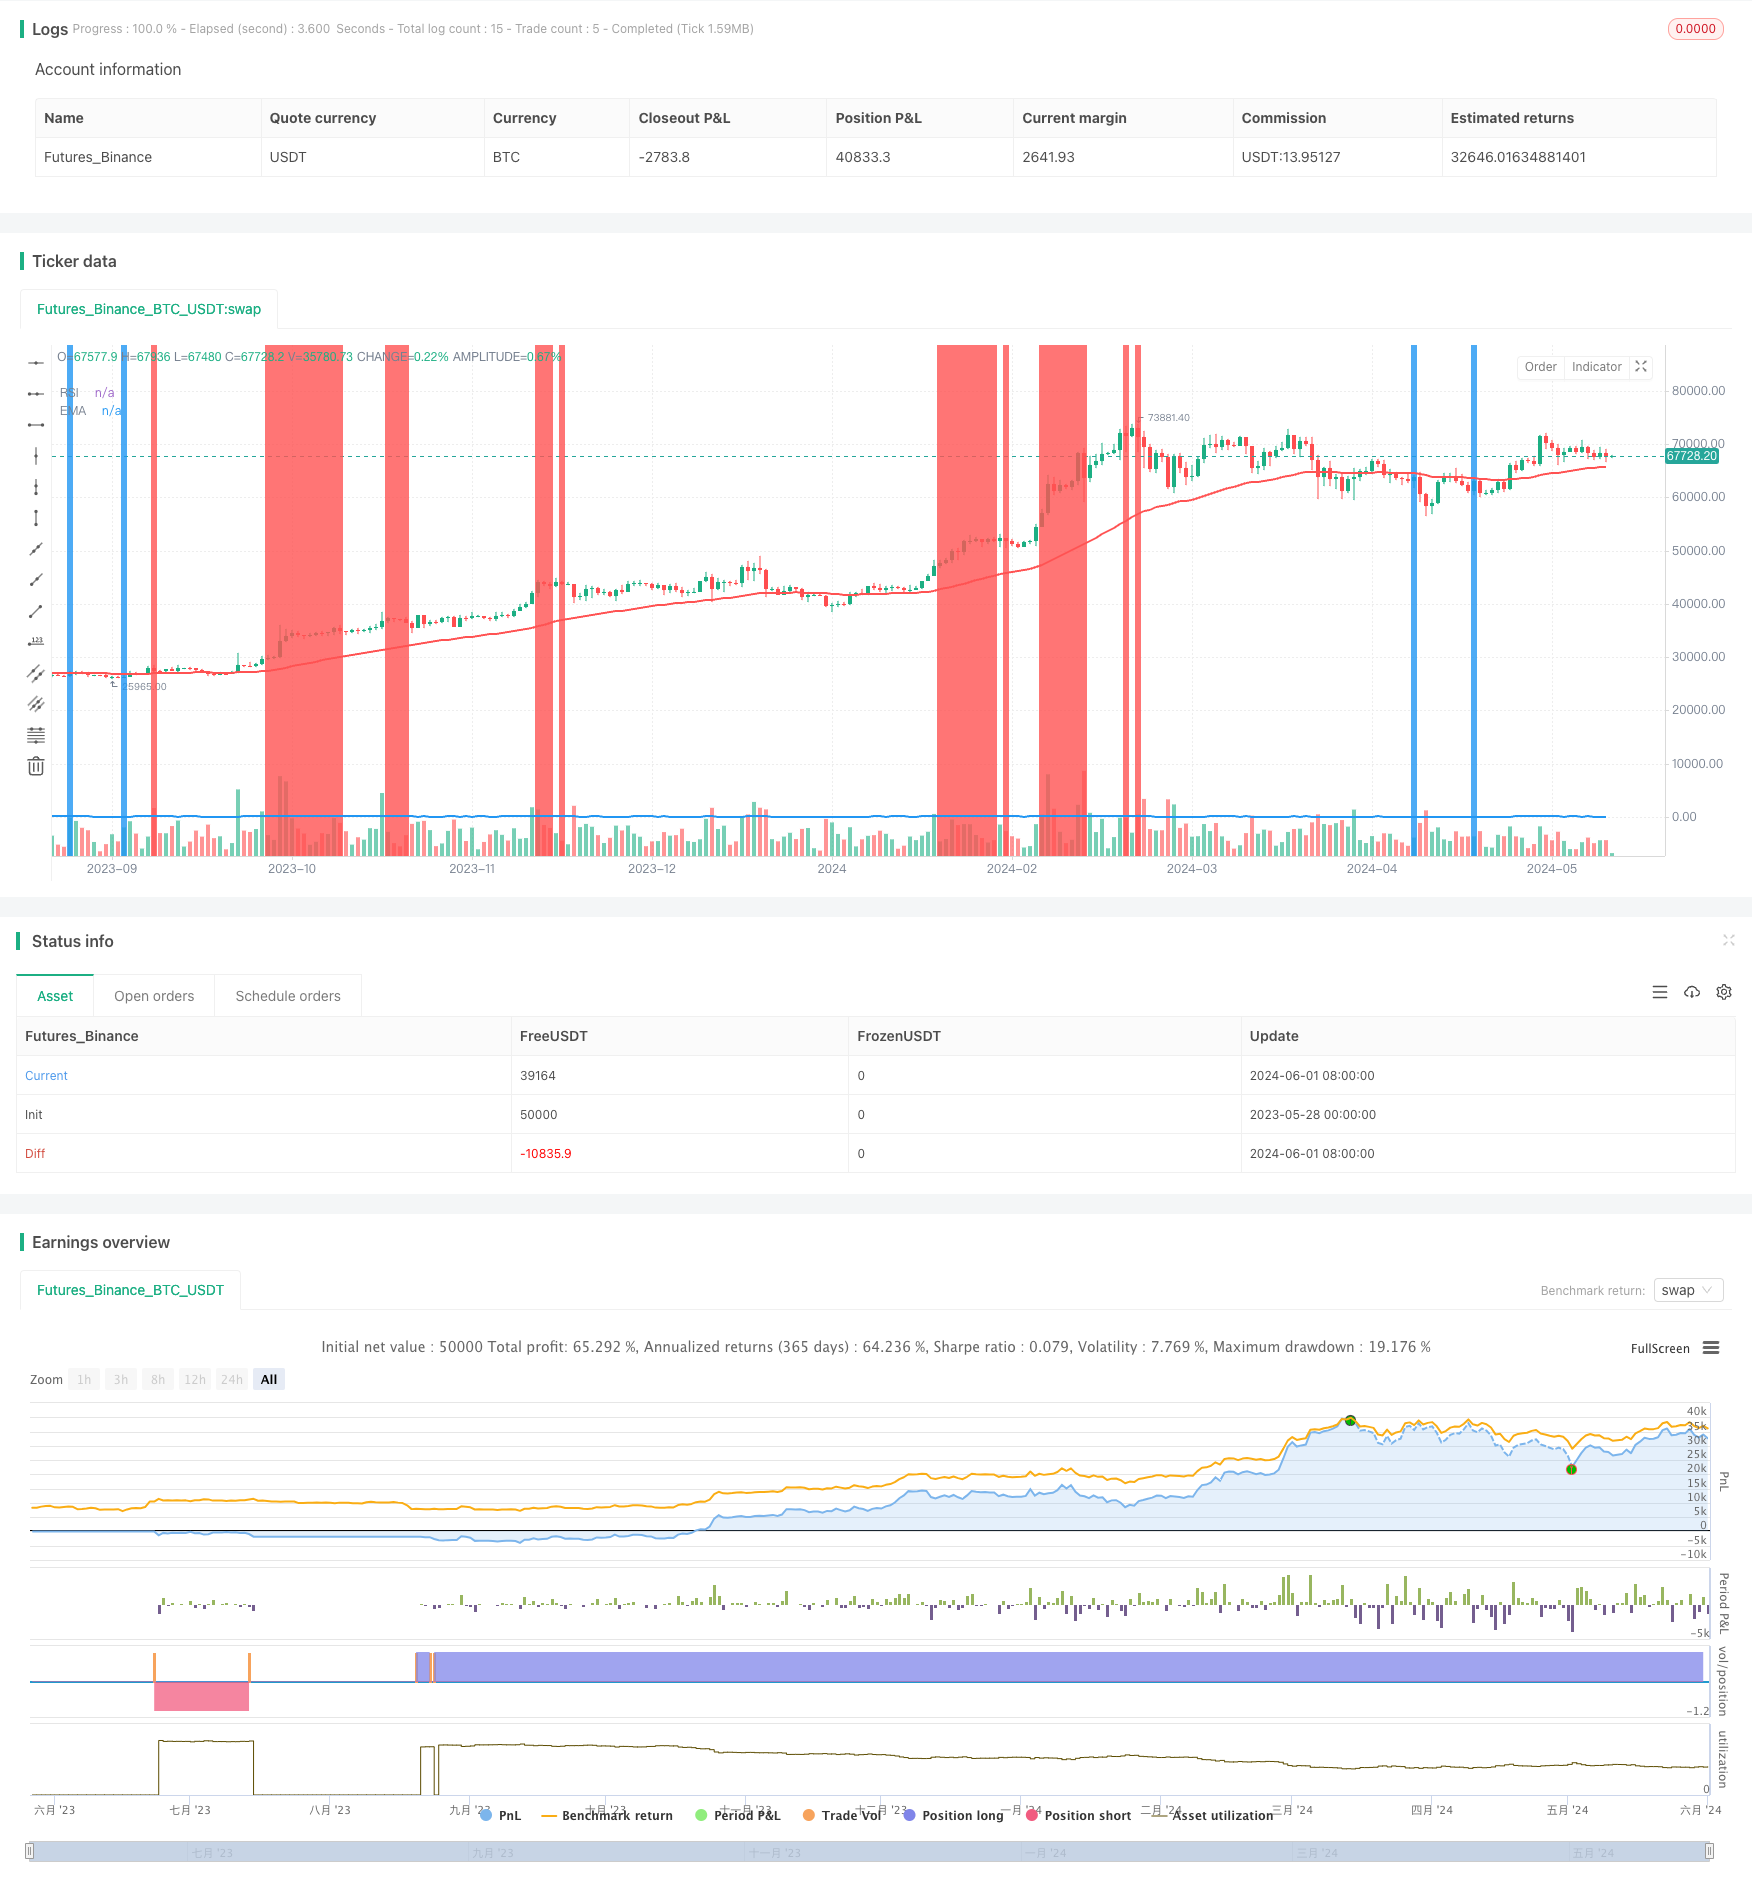 [trans]
概述
EMA与RSI交叉策略通过结合指数移动平均线(EMA)和相对强弱指数(RSI)两个技术指标,来识别潜在的买入或卖出信号。当EMA和RSI出现交叉时,表明市场动量可能发生变化。例如,当较短周期的EMA上穿较长周期的EMA,同时RSI上穿某一阈值,就表明可能出现上升趋势,称为看涨交叉。反之,当较短周期的EMA下穿较长周期的EMA,同时RSI下穿某一阈值,就表明可能出现下降趋势,称为看跌交叉。交易者通常根据这些交叉信号进行入场或离场操作,以把握趋势和市场反转。
策略原理
- 计算指定周期的RSI指标值,并绘制在图表上。
- 计算指定周期的EMA指标值,并绘制在图表上。
- 当价格低于EMA且RSI小于20时,视为买入信号;当价格高于EMA且RSI大于80时,视为卖出信号。
- 当出现买入信号且当前蜡烛线收盘价高于前一根蜡烛线时,开仓做多;当出现卖出信号且当前蜡烛线收盘价低于前一根蜡烛线时,开仓做空。
- 使用平均真实波动幅度(ATR)计算止损和止盈价位。止损价位为开仓价格减去(ATR+蜡烛线实体长度),止盈价位为开仓价格加上(1.2*(ATR+蜡烛线实体长度))。
策略优势
- 结合了趋势跟踪指标EMA和动量指标RSI,能够更全面地判断市场走势。
- 在趋势形成初期即可发出交易信号,有助于尽早把握趋势机会。
- 使用ATR动态调整止损和止盈距离,可以更好地适应市场波动。
- 同时考虑了价格与指标的位置关系和蜡烛线的形态,提高了信号的可靠性。
策略风险
- EMA和RSI指标都有一定的滞后性,可能出现指标交叉而价格并未立即反转的情况,导致虚假信号。
- RSI指标在震荡市中频繁产生交叉信号,可能导致过度交易。
- 固定的RSI阈值可能不适用于所有市场状况,需要根据市场特点进行调整。
- 策略heavily依赖ATR计算止损和止盈,但ATR值可能受到价格突然大幅波动的影响而失真。
策略优化方向
- 对EMA和RSI的参数进行优化,找到最适合当前市场的参数组合。
- 在震荡市中加入其他过滤条件,如交易量变化、波动率等,以过滤掉频繁的虚假信号。
- 对RSI的上下阈值进行自适应调整,使其能够适应不同的市场状态。
- 采用多种止损和止盈方法,如基于支撑阻力位的止损止盈,或结合趋势方向的移动止损,以提高风险控制能力。
- 加入仓位管理模块,根据市场波动和账户风险状况动态调整每笔交易的仓位大小。
总结
EMA与RSI交叉策略是一个简单易用的趋势跟踪策略,通过结合趋势和动量两个维度的指标,可以比较全面地判断市场走向。同时,该策略采用了一些过滤条件和动态止损止盈方法,以提高信号质量和风险控制能力。但是,该策略也存在一些局限性,如指标滞后、频繁交易等问题。因此,在实际应用中,还需要根据具体市场特点和个人风险偏好,对策略进行进一步的优化和改进。
||
Overview
The EMA RSI Crossover strategy combines the Exponential Moving Average (EMA) and Relative Strength Index (RSI) technical indicators to identify potential buy or sell signals. When the EMA and RSI lines intersect, indicating a crossover, it suggests a potential change in market momentum. For instance, a bullish crossover occurs when the shorter EMA crosses above the longer EMA, accompanied by the RSI crossing above a certain threshold, signaling a potential uptrend. Conversely, a bearish crossover indicates a potential downtrend when the shorter EMA crosses below the longer EMA, with the RSI crossing below a specified level. Traders often use this strategy to enter or exit positions based on these crossover signals, aiming to capitalize on trends and market reversals.
Strategy Principles
- Calculate the RSI indicator value for the specified period and plot it on the chart.
- Calculate the EMA indicator value for the specified period and plot it on the chart.
- Consider it a buy signal when the price is below the EMA and the RSI is less than 20; consider it a sell signal when the price is above the EMA and the RSI is greater than 80.
- When a buy signal appears and the current candle's close price is higher than the previous candle's, open a long position; when a sell signal appears and the current candle's close price is lower than the previous candle's, open a short position.
- Use the Average True Range (ATR) to calculate stop loss and take profit levels. The stop loss level is the entry price minus (ATR + candle body length), and the take profit level is the entry price plus (1.2 * (ATR + candle body length)).
Strategy Advantages
- Combines the trend-following EMA indicator and the momentum-based RSI indicator for a more comprehensive assessment of market trends.
- Can generate trading signals early in the formation of a trend, helping to capture trend opportunities promptly.
- Uses ATR to dynamically adjust stop loss and take profit distances, better adapting to market volatility.
- Considers both the relationship between price and indicators and the candlestick patterns, improving the reliability of signals.
Strategy Risks
- Both EMA and RSI indicators have a certain degree of lag, which may lead to false signals where the indicators cross but the price does not immediately reverse.
- The RSI indicator frequently generates crossover signals in range-bound markets, potentially leading to overtrading.
- Fixed RSI thresholds may not be suitable for all market conditions and may require adjustment based on market characteristics.
- The strategy heavily relies on ATR for calculating stop loss and take profit, but ATR values may be distorted by sudden large price fluctuations.
Strategy Optimization Directions
- Optimize the parameters of EMA and RSI to find the most suitable combination for the current market.
- Add other filtering conditions in range-bound markets, such as changes in trading volume or volatility, to filter out frequent false signals.
- Make adaptive adjustments to the upper and lower thresholds of RSI to adapt to different market states.
- Employ multiple stop loss and take profit methods, such as stop loss and take profit based on support and resistance levels, or trailing stop loss based on trend direction, to improve risk control capabilities.
- Incorporate a position sizing module to dynamically adjust the position size of each trade based on market volatility and account risk status.
Summary
The EMA RSI Crossover strategy is a simple and easy-to-use trend-following strategy that combines indicators from both trend and momentum dimensions to comprehensively assess market direction. The strategy also employs some filtering conditions and dynamic stop loss and take profit methods to improve signal quality and risk control capabilities. However, the strategy has some limitations, such as indicator lag and frequent trading. Therefore, in practical application, it is necessary to further optimize and improve the strategy based on specific market characteristics and personal risk preferences. [/trans]
Source (PineScript)
/*backtest
start: 2023-05-28 00:00:00
end: 2024-06-02 00:00:00
period: 1d
basePeriod: 1h
exchanges: [{"eid":"Futures_Binance","currency":"BTC_USDT"}]
*/

// This Pine Script™ code is subject to the terms of the Mozilla Public License 2.0 at https://mozilla.org/MPL/2.0/
// © pritom980

//@version=5
strategy("EMA RSI Cross", overlay=true, margin_long=100, margin_short=100)

// add RSI

rsi_period = input.int(7,"RSI Period")
rsi_val =  ta.rsi(close[1],rsi_period)
plot(rsi_val, color=color.blue, linewidth=2, title="RSI")

buyRsiFlag = rsi_val < 20
sellRsiFlag = rsi_val > 80

// add EMA
ema = ta.ema(close, 50)
plot(ema, color=color.red, linewidth=2, title="EMA")


// check buy

// buy when the price is below ema
buyFlag = ema > close ? true : false

// sell when the price is above ema
sellFlag = ema < close ? true : false


bgcolor(buyFlag and buyRsiFlag ? color.green : na )
bgcolor(sellFlag and sellRsiFlag ? color.red : na )


// Check if current candle's body is bigger than previous candle's body and of opposite color
is_body_bigger_long = math.abs(close - open) > math.abs(close[1] - open[1]) and close > open != close[1] > open[1]


greenCandle = close > close[1]
redCandle = close < close[1]
// Mark the candle
bgcolor(is_body_bigger_long and greenCandle and buyFlag  ? color.blue : na, transp=70)


// ENTRY ---------------------

// Input for ATR period
atr_length = input(14, title="ATR Length")

// Calculate ATR
atr_value = ta.atr(atr_length)

// Calculate stop loss and take profit levels
candleBody = math.abs(close-open)
slDist = atr_value + candleBody

stop_loss_long = close - slDist
take_profit_long = close + (1.2 * slDist)


stop_loss_short = high + slDist
take_profit_short = high - (1.2 * slDist)

// Entry and exit conditions
if (buyFlag and buyRsiFlag  and strategy.opentrades >= 0 and greenCandle)
    strategy.entry("Long", strategy.long)
    strategy.exit("Take Profit/Stop Loss", "Long", stop=stop_loss_long, limit=take_profit_long)

// Entry and exit conditions
if (sellFlag and sellRsiFlag   and strategy.opentrades <= 0 and redCandle)
    strategy.entry("Short", strategy.short)
    strategy.exit("Take Profit/Stop Loss", "Short", stop=stop_loss_short, limit=take_profit_short)
Detail
https://www.fmz.com/strategy/453238
Last Modified
2024-06-03 11:08:30