
10 KiB
Name
EMA与超级趋势相结合的量化交易策略-EMA-and-Supertrend-Combination-Quantitative-Trading-Strategy
Author
ChaoZhang
Strategy Description
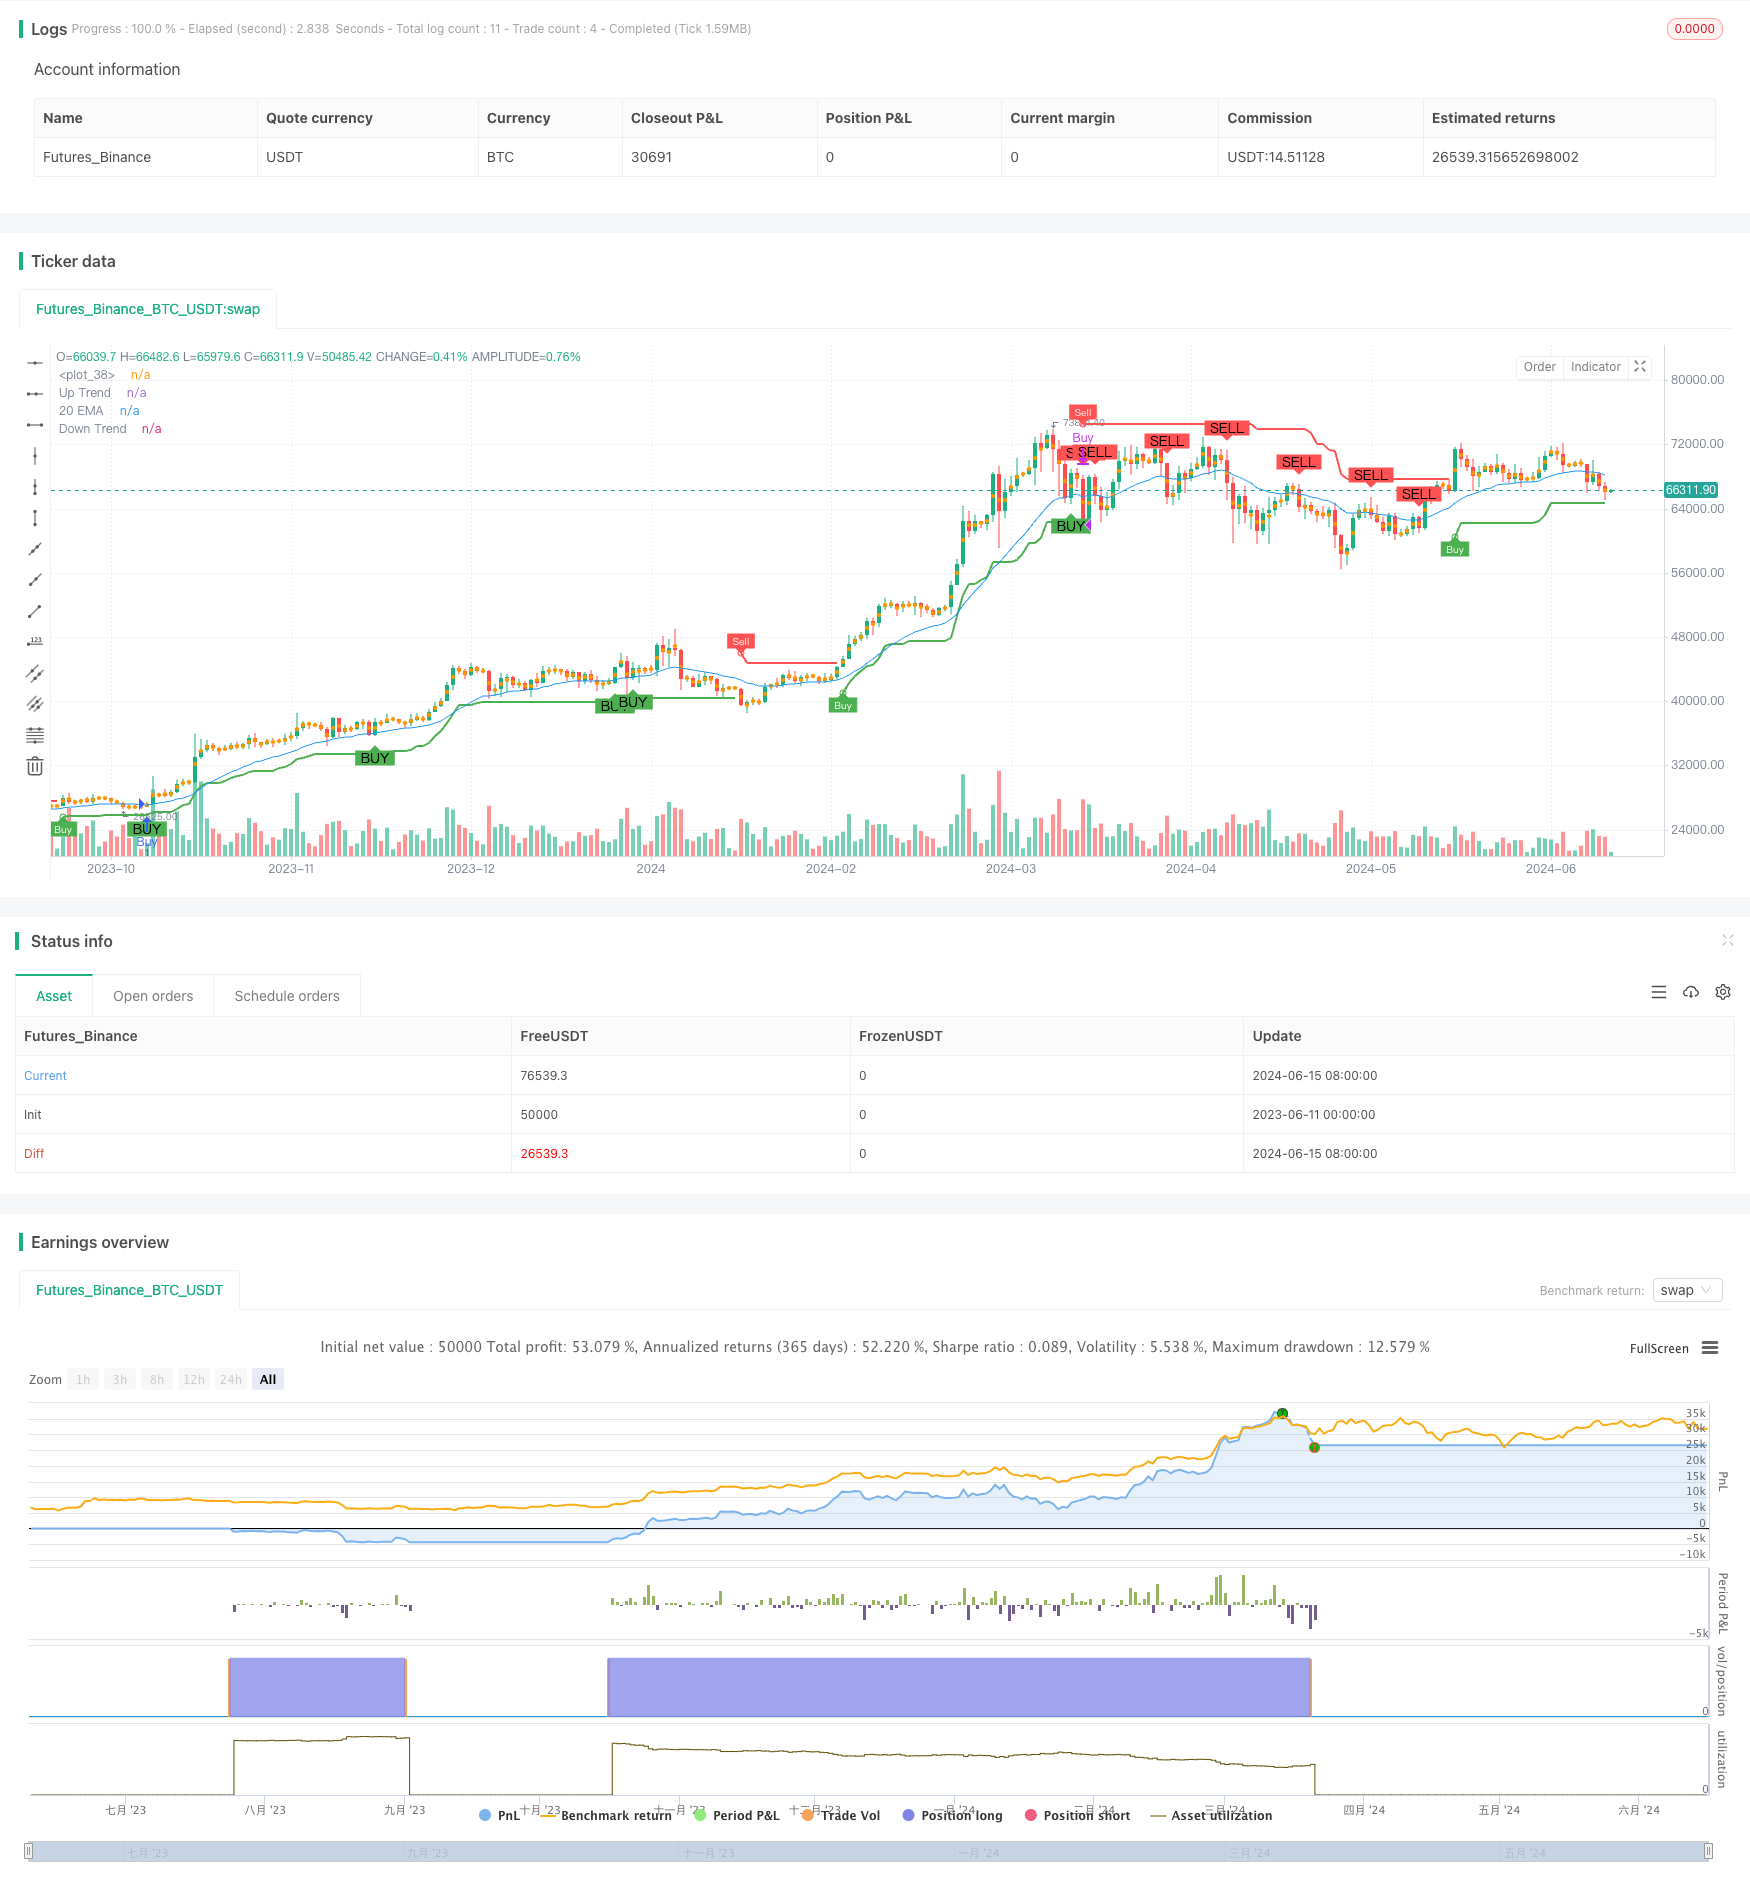 [trans]
概述
该策略结合了指数移动平均线(EMA)和超级趋势指标(Supertrend)来生成买卖信号。当价格从上方突破20日EMA且超级趋势指标处于看涨趋势时,会产生买入信号;当价格从下方跌破20日EMA且超级趋势指标处于看跌趋势时,会产生卖出信号。该策略旨在捕捉趋势性行情,同时利用EMA作为过滤条件以减少假信号。
策略原理
- 计算20日EMA作为趋势判断的过滤条件。
- 计算超级趋势指标,该指标基于平均真实范围(ATR)和多空趋势来绘制上下轨。
- 根据超级趋势指标的趋势方向和价格与20日EMA的相对位置来生成买卖信号:
- 当价格从上方突破20日EMA且超级趋势指标处于看涨趋势时,产生买入信号。
- 当价格从下方跌破20日EMA且超级趋势指标处于看跌趋势时,产生卖出信号。
- 策略根据买入信号开仓做多,根据卖出信号平仓。
策略优势
- 结合EMA和超级趋势指标,可以有效地捕捉趋势性行情,减少假信号。
- 超级趋势指标基于ATR,能够动态调整上下轨距离,适应不同的市场波动率。
- EMA作为趋势判断的过滤条件,可以确保在趋势方向上开仓,提高策略的胜率。
- 策略逻辑简单明了,易于理解和实现。
策略风险
- 在震荡市场下,该策略可能会频繁产生买卖信号,导致过多的交易次数和手续费损耗。
- 策略依赖于EMA和超级趋势指标,在某些市场条件下,这些指标可能会失效或滞后。
- 策略没有考虑风险管理,如止损和仓位管理,这可能导致在市场剧烈波动时出现较大的回撤。
策略优化方向
- 加入止损机制,如根据ATR设置动态止损,以控制单笔交易的最大亏损。
- 优化EMA和超级趋势指标的参数,如使用参数优化方法找到最佳参数组合,提高策略的适应性和稳定性。
- 引入仓位管理,根据市场波动率或账户盈亏情况动态调整仓位大小,以控制整体风险。
- 考虑加入其他过滤条件,如交易量、波动率等,以进一步减少假信号。
总结
该策略通过结合20日EMA和超级趋势指标来生成买卖信号,旨在捕捉趋势性行情。策略优势在于逻辑简单,结合EMA和超级趋势指标可以有效减少假信号。但在震荡市场下,策略可能会频繁交易,且缺乏风险管理措施。未来可以考虑加入止损、仓位管理和参数优化等方法来改进策略。总体而言,该策略为趋势交易提供了一种简单有效的思路,但在实际应用中还需要进一步优化和完善。
||
Overview
This strategy combines the Exponential Moving Average (EMA) and the Supertrend indicator to generate buy and sell signals. A buy signal is generated when the price breaks above the 20-day EMA and the Supertrend indicator is in a bullish trend. A sell signal is generated when the price breaks below the 20-day EMA and the Supertrend indicator is in a bearish trend. The strategy aims to capture trending market conditions while using the EMA as a filtering condition to reduce false signals.
Strategy Principle
- Calculate the 20-day EMA as a filtering condition for trend determination.
- Calculate the Supertrend indicator, which plots upper and lower bands based on the Average True Range (ATR) and the bullish/bearish trend.
- Generate buy and sell signals based on the trend direction of the Supertrend indicator and the relative position of the price to the 20-day EMA:
- A buy signal is generated when the price breaks above the 20-day EMA and the Supertrend indicator is in a bullish trend.
- A sell signal is generated when the price breaks below the 20-day EMA and the Supertrend indicator is in a bearish trend.
- The strategy enters a long position on a buy signal and exits on a sell signal.
Strategy Advantages
- By combining the EMA and the Supertrend indicator, the strategy can effectively capture trending market conditions while reducing false signals.
- The Supertrend indicator is based on ATR, which allows it to dynamically adjust the distance between the upper and lower bands, adapting to different market volatilities.
- Using the EMA as a filtering condition for trend determination ensures that positions are opened in the direction of the trend, increasing the win rate of the strategy.
- The strategy logic is simple and straightforward, making it easy to understand and implement.
Strategy Risks
- In a choppy market, the strategy may generate frequent buy and sell signals, leading to excessive trading and transaction cost erosion.
- The strategy relies on the EMA and the Supertrend indicator, which may become ineffective or lag in certain market conditions.
- The strategy does not consider risk management, such as stop-loss and position sizing, which may result in significant drawdowns during highly volatile market conditions.
Strategy Optimization Directions
- Incorporate a stop-loss mechanism, such as setting a dynamic stop-loss based on ATR, to control the maximum loss per trade.
- Optimize the parameters of the EMA and the Supertrend indicator, such as using parameter optimization methods to find the optimal parameter combination, enhancing the adaptability and stability of the strategy.
- Introduce position sizing by dynamically adjusting the position size based on market volatility or account profit and loss, to manage overall risk.
- Consider adding other filtering conditions, such as trading volume, volatility, etc., to further reduce false signals.
Summary
This strategy generates buy and sell signals by combining the 20-day EMA and the Supertrend indicator, aiming to capture trending market conditions. The strategy's advantages lie in its simplicity and the combination of EMA and Supertrend indicator, which can effectively reduce false signals. However, in choppy markets, the strategy may trade frequently and lacks risk management measures. Future improvements can consider incorporating stop-loss, position sizing, and parameter optimization methods to enhance the strategy. Overall, this strategy provides a simple and effective approach to trend trading, but further optimization and refinement are needed for practical application. [/trans]
Source (PineScript)
/*backtest
start: 2023-06-11 00:00:00
end: 2024-06-16 00:00:00
period: 1d
basePeriod: 1h
exchanges: [{"eid":"Futures_Binance","currency":"BTC_USDT"}]
*/

//@version=5
strategy("20 EMA and Supertrend Strategy", overlay=true)

// Inputs
emaLength = input(20, title="EMA Length")
supertrendMultiplier = input.float(3.0, title="Supertrend Multiplier")
supertrendPeriod = input(10, title="Supertrend Period")

// EMA Calculation
ema = ta.ema(close, emaLength)

// Supertrend Calculation
Periods = supertrendPeriod
src = hl2
Multiplier = supertrendMultiplier
changeATR= input.bool(true, title="Change ATR Calculation Method?")
showsignals = input.bool(true, title="Show Buy/Sell Signals?")
highlighting = input.bool(true, title="Highlighter On/Off?")
atr2 = ta.sma(ta.tr, Periods)
atr = changeATR ? ta.atr(Periods) : atr2
up = src - (Multiplier * atr)
up1 = na(up[1]) ? up : up[1]
up := close[1] > up1 ? math.max(up, up1) : up
dn = src + (Multiplier * atr)
dn1 = na(dn[1]) ? dn : dn[1]
dn := close[1] < dn1 ? math.min(dn, dn1) : dn
trend = 1
trend := na(trend[1]) ? trend : trend[1]
trend := trend == -1 and close > dn1 ? 1 : trend == 1 and close < up1 ? -1 : trend
upPlot = plot(trend == 1 ? up : na, title="Up Trend", style=plot.style_linebr, linewidth=2, color=color.green)
buySignal = trend == 1 and trend[1] == -1
plotshape(series=buySignal ? up : na, title="UpTrend Begins", location=location.absolute, style=shape.circle, size=size.tiny, color=color.new(color.green, 0))
plotshape(series=buySignal and showsignals ? up : na, title="Buy", text="Buy", location=location.absolute, style=shape.labelup, size=size.tiny, color=color.new(color.green, 0), textcolor=color.white)
dnPlot = plot(trend == 1 ? na : dn, title="Down Trend", style=plot.style_linebr, linewidth=2, color=color.red)
sellSignal = trend == -1 and trend[1] == 1
plotshape(series=sellSignal ? dn : na, title="DownTrend Begins", location=location.absolute, style=shape.circle, size=size.tiny, color=color.new(color.red, 0))
plotshape(series=sellSignal and showsignals ? dn : na, title="Sell", text="Sell", location=location.absolute, style=shape.labeldown, size=size.tiny, color=color.new(color.red, 0), textcolor=color.white)
mPlot = plot(ohlc4, title="", style=plot.style_circles, linewidth=1)
longFillColor = highlighting ? (trend == 1 ? color.new(color.green, 90) : color.new(color.white, 0)) : color.new(color.white, 0)
shortFillColor = highlighting ? (trend == -1 ? color.new(color.red, 90) : color.new(color.white, 0)) : color.new(color.white, 0)
fill(mPlot, upPlot, title="UpTrend Highlighter", color=longFillColor)
fill(mPlot, dnPlot, title="DownTrend Highlighter", color=shortFillColor)
alertcondition(buySignal, title="SuperTrend Buy", message="SuperTrend Buy!")
alertcondition(sellSignal, title="SuperTrend Sell", message="SuperTrend Sell!")
changeCond = trend != trend[1]
alertcondition(changeCond, title="SuperTrend Direction Change", message="SuperTrend has changed direction!")

// Buy and Sell Signals based on EMA and Supertrend
buySignalEMA = ta.crossover(close, ema) and trend == 1
sellSignalEMA = ta.crossunder(close, ema) and trend == -1

// Plot EMA
plot(ema, color=color.blue, title="20 EMA")

// Plot Buy and Sell Signals
plotshape(series=buySignalEMA, location=location.belowbar, color=color.green, style=shape.labelup, title="Buy Signal", text="BUY")
plotshape(series=sellSignalEMA, location=location.abovebar, color=color.red, style=shape.labeldown, title="Sell Signal", text="SELL")

// Strategy Entries and Exits
if (buySignalEMA)
    strategy.entry("Buy", strategy.long)

if (sellSignalEMA)
    strategy.close("Buy")
Detail
https://www.fmz.com/strategy/454366
Last Modified
2024-06-17 16:52:17