
15 KiB
Name
Darvas-Box-Breakout-and-Risk-Management-Strategy-Darvas-盒子突破与风险管理策略
Author
ChaoZhang
Strategy Description
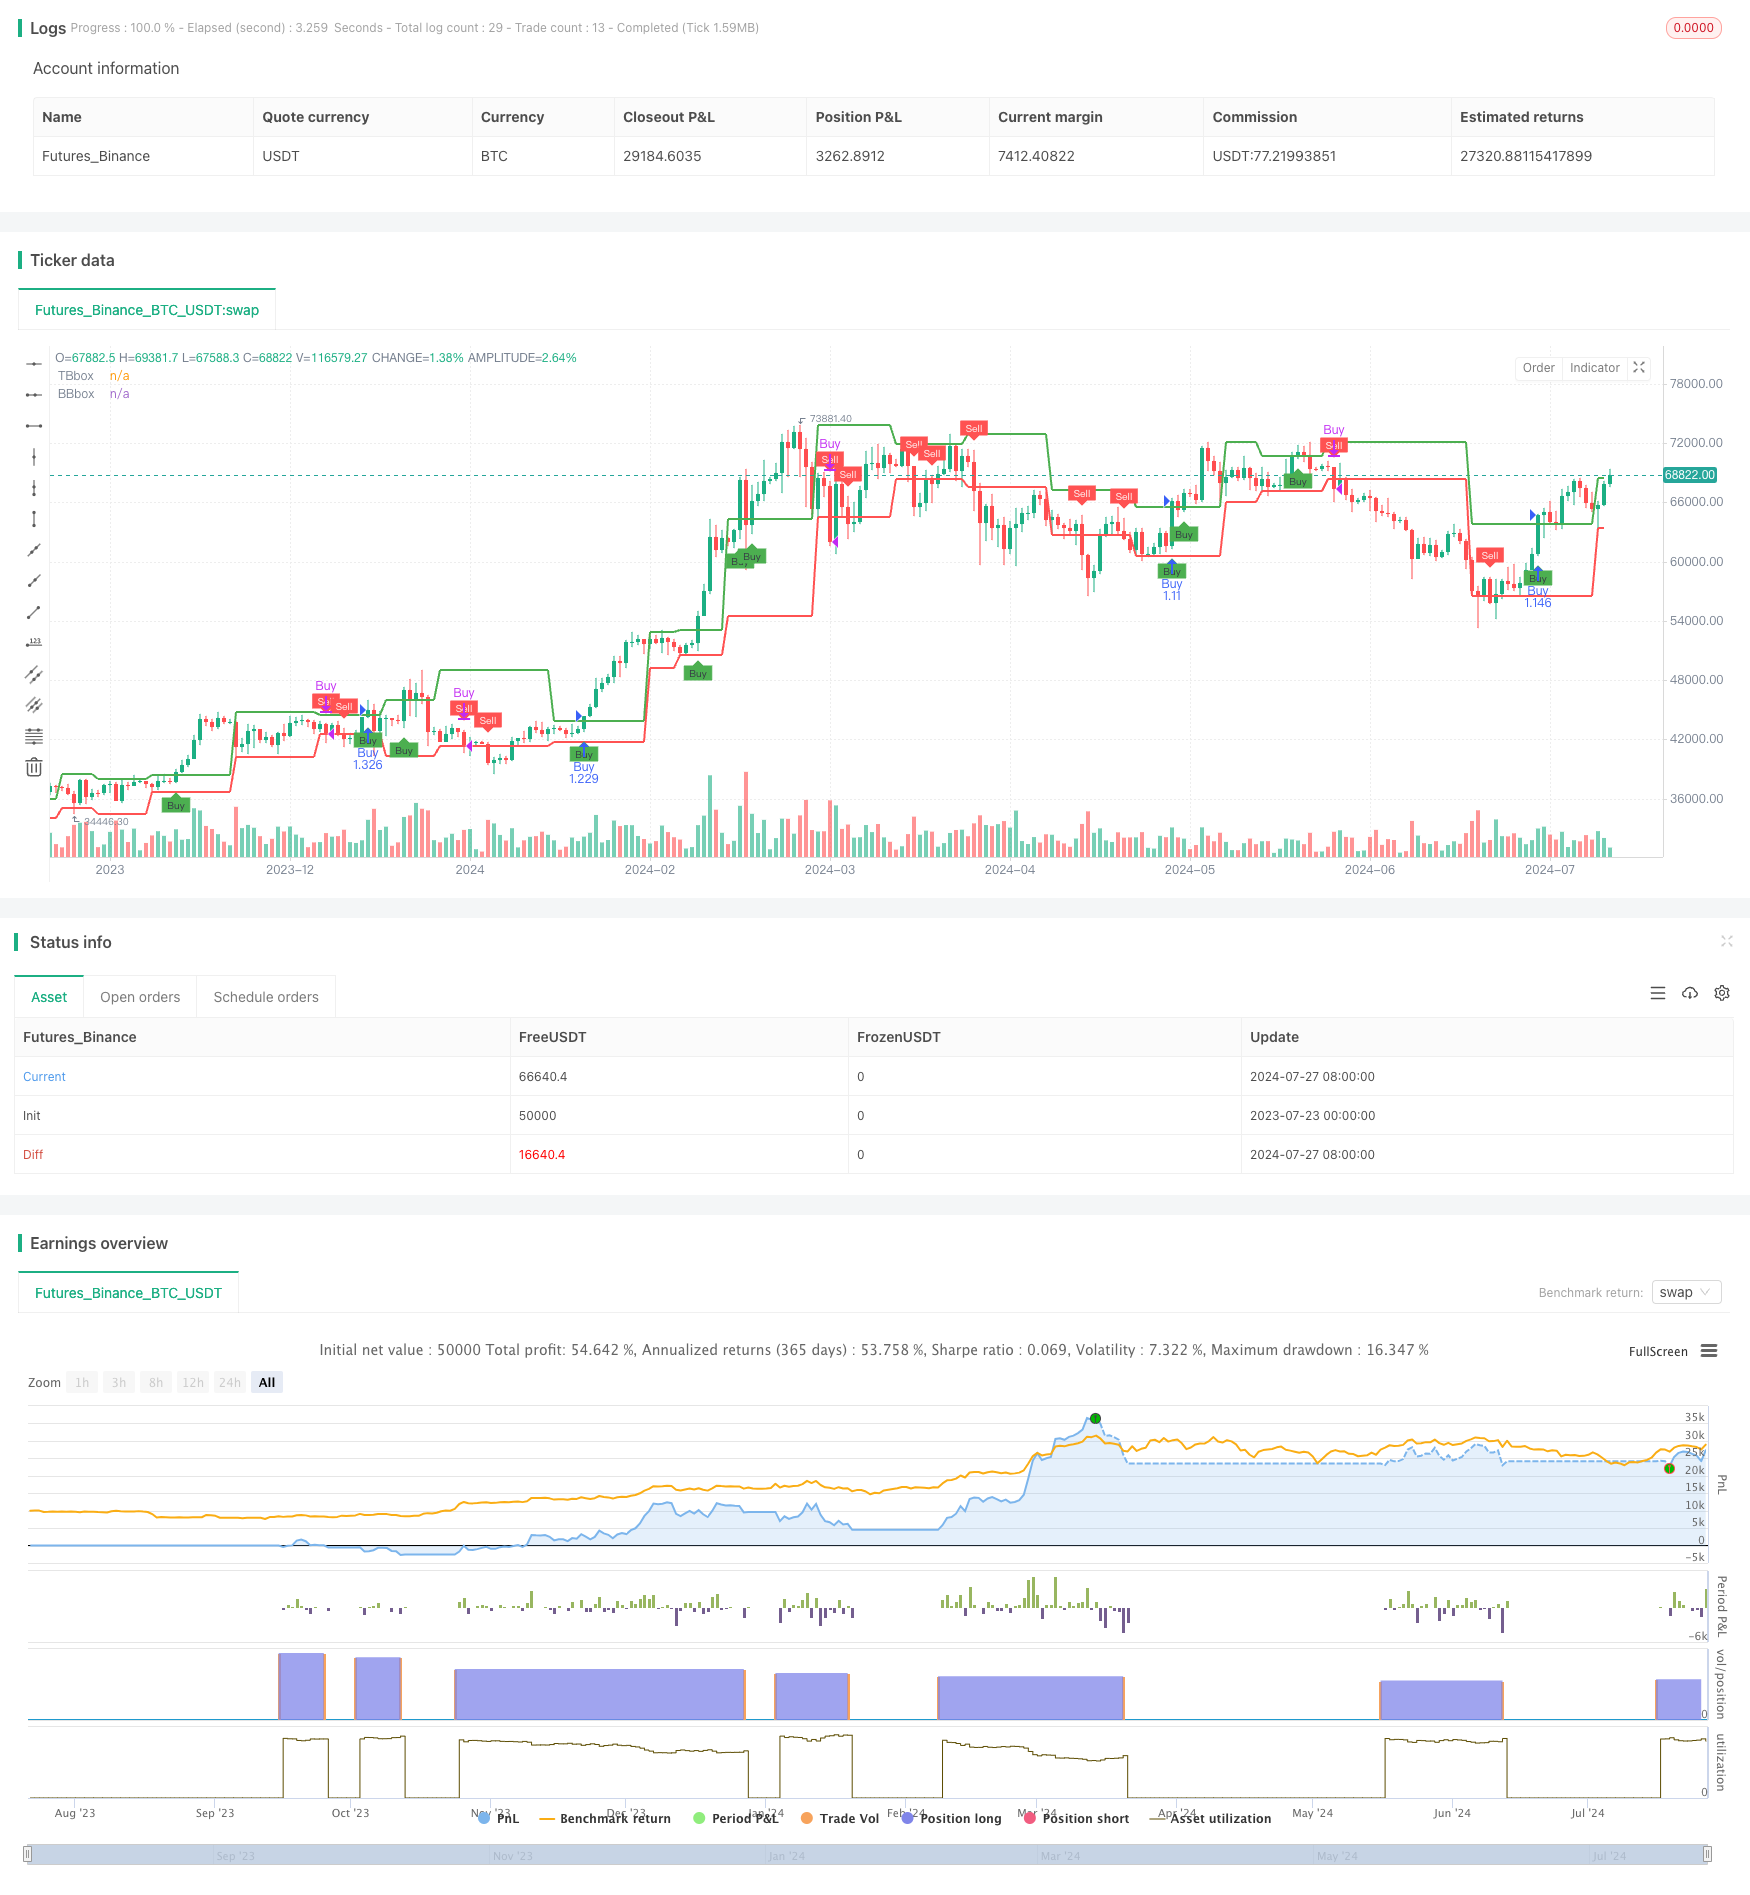 [trans]
概述
Darvas盒子突破与风险管理策略是一种结合了技术分析和风险管理的量化交易方法。该策略基于Nicholas Darvas开发的Darvas盒子理论,通过识别价格突破历史高点的模式来捕捉潜在的上升趋势。策略还整合了多项技术指标和风险控制措施,旨在提高交易的准确性和安全性。
通过分析提供的代码,我们可以看到该策略的核心是构建Darvas盒子,并在价格突破盒子上沿时产生买入信号,在价格跌破盒子下沿时产生卖出信号。策略还使用了移动平均线、MACD和RSI等技术指标来确认交易信号,并采用了百分比止损和风险回报比等风险管理技巧来控制每笔交易的风险。
策略原理
-
Darvas盒子构建:
- 使用input.int()函数设置盒子周期(boxp),默认为5个周期。
- 计算周期内的最低价(LL)和最高价(k1, k2, k3)。
- 确定新高(NH)和盒子形成条件(box1)。
- 定义盒子上沿(TopBox)和下沿(BottomBox)。
-
交易信号生成:
- 买入信号(Buy): 当收盘价上穿盒子上沿时触发。
- 卖出信号(Sell): 当收盘价下穿盒子下沿时触发。
-
策略执行:
- 使用strategy.entry()函数在买入信号出现时开仓做多。
- 使用strategy.close()函数在卖出信号出现时平仓。
-
可视化:
- 使用plot()函数绘制Darvas盒子的上下边界。
- 使用plotshape()函数在图表上标注买入和卖出信号。
-
风险管理:
- 通过default_qty_type和default_qty_value参数设置每次交易的资金比例。
- 可以通过调整boxp参数来控制盒子的大小,间接影响止损幅度。
策略优势
-
趋势跟踪: Darvas盒子策略能够有效捕捉市场的上升趋势,特别适合在强势市场中获得可观收益。
-
客观性强: 策略基于明确的数学模型和技术指标,减少了主观判断带来的偏差。
-
风险控制: 通过设置固定的资金比例进行交易,有效控制了单笔交易的风险敞口。
-
灵活性: 策略参数可调,适应不同市场环境和交易品种。
-
可视化支持: 通过在图表上直观显示Darvas盒子和交易信号,便于交易者理解和监控策略执行情况。
-
自动化交易: 策略可以轻松集成到自动交易系统中,减少人为干预。
策略风险
-
假突破风险: 在震荡市场中,可能会出现频繁的假突破,导致过多的错误信号。
-
滞后性: Darvas盒子的形成需要一定时间,可能会错过一些快速的市场机会。
-
回撤风险: 在剧烈波动的市场中,价格可能在触发买入信号后快速回落,造成较大损失。
-
参数敏感性: 策略性能对boxp参数的设置较为敏感,不当的参数可能导致策略表现不佳。
-
缺乏止盈机制: 当前策略没有明确的止盈机制,可能导致错过获利了结的最佳时机。
为了降低这些风险,可以考虑以下措施:
- 结合其他技术指标如移动平均线或RSI来过滤假突破信号。
- 采用动态止损策略,如跟踪止损,以更好地保护盈利。
- 引入波动率指标,在高波动期调整交易规模或暂停交易。
- 通过回测优化boxp参数,找到最适合目标市场的设置。
- 增加止盈条件,如在价格达到一定盈利水平时自动平仓。
策略优化方向
-
信号确认:
- 整合移动平均线交叉或MACD指标来确认突破的有效性。
- 引入成交量分析,只有在成交量显著增加时才确认突破信号。
-
动态参数调整:
- 根据市场波动率动态调整boxp参数,在低波动期使用较大的boxp,高波动期使用较小的boxp。
- 实现自适应的Darvas盒子大小,使其能够根据近期价格波动自动调整。
-
风险管理优化:
- 增加动态止损机制,如百分比跟踪止损或ATR止损。
- 实现基于风险回报比的仓位管理,在高风险回报比时增加仓位,低风险回报比时减少仓位。
-
多时间框架分析:
- 在较大的时间框架上构建Darvas盒子,用于确定整体趋势。
- 在较小的时间框架上寻找入场机会,提高交易精度。
-
机器学习集成:
- 使用机器学习算法预测Darvas盒子突破的成功概率。
- 通过深度学习模型优化策略参数,提高策略的整体性能。
-
市场环境适应:
- 引入市场环境识别机制,在不同的市场状态(趋势、震荡、反转)下采用不同的交易策略。
- 在高波动期自动调整交易频率和规模,以适应市场变化。
这些优化方向旨在提高策略的稳定性和盈利能力,同时降低风险。通过引入更多的技术分析工具和风险管理技巧,策略可以更好地适应不同的市场环境,提高长期盈利的可能性。
总结
Darvas盒子突破与风险管理策略是一种结合了经典技术分析方法和现代风险控制理念的量化交易策略。它利用Darvas盒子理论捕捉价格突破,通过严格的风险管理来控制交易风险。策略的优势在于其客观性、趋势跟踪能力和风险控制,但也面临假突破和参数敏感性等挑战。
通过深入分析和优化,我们提出了多个改进方向,包括信号确认、动态参数调整、风险管理优化、多时间框架分析、机器学习集成和市场环境适应等。这些优化措施有望提高策略的稳定性和盈利能力,使其更好地适应不同的市场环境。
对于交易者而言,理解并正确实施这一策略需要深入的市场知识和技术分析能力。同时,持续的回测和参数优化也是保持策略有效性的关键。随着市场环境的不断变化,策略也需要不断evolve以保持其竞争力。通过不断学习和改进,Darvas盒子突破与风险管理策略有潜力成为交易者武器库中的有力工具。
||
Overview
The Darvas Box Breakout and Risk Management Strategy is a quantitative trading approach that combines technical analysis with risk management. Based on Nicholas Darvas's Darvas Box theory, this strategy aims to capture potential uptrends by identifying price breakouts above historical highs. The strategy also incorporates multiple technical indicators and risk control measures to enhance trading accuracy and safety.
Analyzing the provided code, we can see that the core of this strategy is to construct Darvas boxes, generating buy signals when the price breaks above the box's upper boundary and sell signals when it falls below the lower boundary. The strategy also utilizes technical indicators such as moving averages, MACD, and RSI to confirm trading signals, and employs risk management techniques like percentage stop-loss and risk-reward ratios to control the risk of each trade.
Strategy Principles
-
Darvas Box Construction:
- Use the input.int() function to set the box period (boxp), defaulting to 5 periods.
- Calculate the lowest low (LL) and highest highs (k1, k2, k3) within the period.
- Determine new highs (NH) and box formation conditions (box1).
- Define the top (TopBox) and bottom (BottomBox) of the box.
-
Trading Signal Generation:
- Buy signal (Buy): Triggered when the closing price crosses above the box's upper boundary.
- Sell signal (Sell): Triggered when the closing price crosses below the box's lower boundary.
-
Strategy Execution:
- Use strategy.entry() function to open a long position when a buy signal appears.
- Use strategy.close() function to close the position when a sell signal appears.
-
Visualization:
- Use plot() function to draw the upper and lower boundaries of the Darvas box.
- Use plotshape() function to mark buy and sell signals on the chart.
-
Risk Management:
- Set the proportion of funds for each trade using default_qty_type and default_qty_value parameters.
- Control the size of the box, indirectly affecting stop-loss range, by adjusting the boxp parameter.
Strategy Advantages
-
Trend Following: The Darvas Box strategy effectively captures market uptrends, particularly suitable for generating substantial returns in strong markets.
-
Objectivity: The strategy is based on clear mathematical models and technical indicators, reducing biases from subjective judgments.
-
Risk Control: By setting a fixed proportion of funds for trading, it effectively controls the risk exposure of individual trades.
-
Flexibility: Strategy parameters are adjustable, adapting to different market environments and trading instruments.
-
Visual Support: By intuitively displaying Darvas boxes and trading signals on the chart, it facilitates traders' understanding and monitoring of strategy execution.
-
Automated Trading: The strategy can be easily integrated into automated trading systems, reducing human intervention.
Strategy Risks
-
False Breakout Risk: In oscillating markets, frequent false breakouts may occur, leading to excessive erroneous signals.
-
Lag: The formation of Darvas boxes takes time, potentially missing some rapid market opportunities.
-
Drawdown Risk: In highly volatile markets, prices may quickly retreat after triggering a buy signal, causing significant losses.
-
Parameter Sensitivity: Strategy performance is relatively sensitive to the boxp parameter setting; improper parameters may lead to poor strategy performance.
-
Lack of Profit-Taking Mechanism: The current strategy lacks a clear profit-taking mechanism, potentially missing optimal profit realization opportunities.
To mitigate these risks, consider the following measures:
- Combine other technical indicators like moving averages or RSI to filter false breakout signals.
- Adopt dynamic stop-loss strategies, such as trailing stops, to better protect profits.
- Introduce volatility indicators to adjust trading size or pause trading during high volatility periods.
- Optimize the boxp parameter through backtesting to find the most suitable setting for the target market.
- Add profit-taking conditions, such as automatically closing positions when prices reach certain profit levels.
Strategy Optimization Directions
-
Signal Confirmation:
- Integrate moving average crossovers or MACD indicators to confirm the validity of breakouts.
- Introduce volume analysis, confirming breakout signals only when accompanied by significant volume increases.
-
Dynamic Parameter Adjustment:
- Dynamically adjust the boxp parameter based on market volatility, using larger boxp in low volatility periods and smaller boxp in high volatility periods.
- Implement adaptive Darvas box sizes that automatically adjust based on recent price volatility.
-
Risk Management Optimization:
- Add dynamic stop-loss mechanisms, such as percentage trailing stops or ATR stops.
- Implement position sizing based on risk-reward ratios, increasing positions for high risk-reward ratios and decreasing for low ones.
-
Multi-Timeframe Analysis:
- Construct Darvas boxes on larger timeframes to determine overall trends.
- Look for entry opportunities on smaller timeframes to improve trading precision.
-
Machine Learning Integration:
- Use machine learning algorithms to predict the success probability of Darvas box breakouts.
- Optimize strategy parameters through deep learning models to enhance overall strategy performance.
-
Market Environment Adaptation:
- Introduce market environment recognition mechanisms, adopting different trading strategies for various market states (trending, oscillating, reversing).
- Automatically adjust trading frequency and size during high volatility periods to adapt to market changes.
These optimization directions aim to improve the strategy's stability and profitability while reducing risks. By introducing more technical analysis tools and risk management techniques, the strategy can better adapt to different market environments, increasing the likelihood of long-term profitability.
Conclusion
The Darvas Box Breakout and Risk Management Strategy is a quantitative trading approach that combines classic technical analysis methods with modern risk control concepts. It utilizes Darvas Box theory to capture price breakouts while implementing strict risk management to control trading risks. The strategy's strengths lie in its objectivity, trend-following ability, and risk control, but it also faces challenges such as false breakouts and parameter sensitivity.
Through in-depth analysis and optimization, we have proposed several improvement directions, including signal confirmation, dynamic parameter adjustment, risk management optimization, multi-timeframe analysis, machine learning integration, and market environment adaptation. These optimization measures are expected to enhance the strategy's stability and profitability, enabling it to better adapt to various market environments.
For traders, understanding and correctly implementing this strategy requires deep market knowledge and technical analysis skills. Continuous backtesting and parameter optimization are also key to maintaining the strategy's effectiveness. As market environments constantly change, the strategy needs to evolve continuously to maintain its competitiveness. Through ongoing learning and improvement, the Darvas Box Breakout and Risk Management Strategy has the potential to become a powerful tool in a trader's arsenal.
[/trans]
Source (PineScript)
/*backtest
start: 2023-07-23 00:00:00
end: 2024-07-28 00:00:00
period: 1d
basePeriod: 1h
exchanges: [{"eid":"Futures_Binance","currency":"BTC_USDT"}]
*/

//@version=5
strategy("Darvas Box Strategy", overlay=true, default_qty_type=strategy.percent_of_equity, default_qty_value=100)

// Input settings
boxp = input.int(defval=5, title="Length", minval=1, maxval=500)

// Calculate the lowest low and highest highs
LL = ta.lowest(low, boxp)
k1 = ta.highest(high, boxp)
k2 = ta.highest(high, boxp - 1)
k3 = ta.highest(high, boxp - 2)

// Calculate New High (NH)
NH = ta.valuewhen(high > k1[1], high, 0)
box1 = k3 < k2

// Define the top and bottom of the Darvas Box
TopBox = ta.valuewhen(ta.barssince(high > k1[1]) == boxp - 2 and box1, NH, 0)
BottomBox = ta.valuewhen(ta.barssince(high > k1[1]) == boxp - 2 and box1, LL, 0)

// Plot the Darvas Box
plot(TopBox, linewidth=2, color=color.new(color.green, 0), title="TBbox")
plot(BottomBox, linewidth=2, color=color.new(color.red, 0), title="BBbox")

// Buy and Sell signals
Buy = ta.crossover(close, TopBox)
Sell = ta.crossunder(close, BottomBox)

// Set strategy orders
if (Buy)
    strategy.entry("Buy", strategy.long)
if (Sell)
    strategy.close("Buy")

// Alert conditions
alertcondition(Buy, title="Buy Signal", message="Buy")
alertcondition(Sell, title="Sell Signal", message="Sell")

// Plot Buy and Sell signals
plotshape(Buy, style=shape.labelup, location=location.belowbar, color=color.new(color.green, 0), size=size.tiny, title="Buy Signal", text="Buy", textcolor=color.black)
plotshape(Sell, style=shape.labeldown, location=location.abovebar, color=color.new(color.red, 0), size=size.tiny, title="Sell Signal", text="Sell", textcolor=color.white)
Detail
https://www.fmz.com/strategy/458041
Last Modified
2024-07-29 14:22:29