
7.2 KiB
Name
DEMA波动率指标策略DEMA-Volatility-Index-Strategy
Author
ChaoZhang
Strategy Description
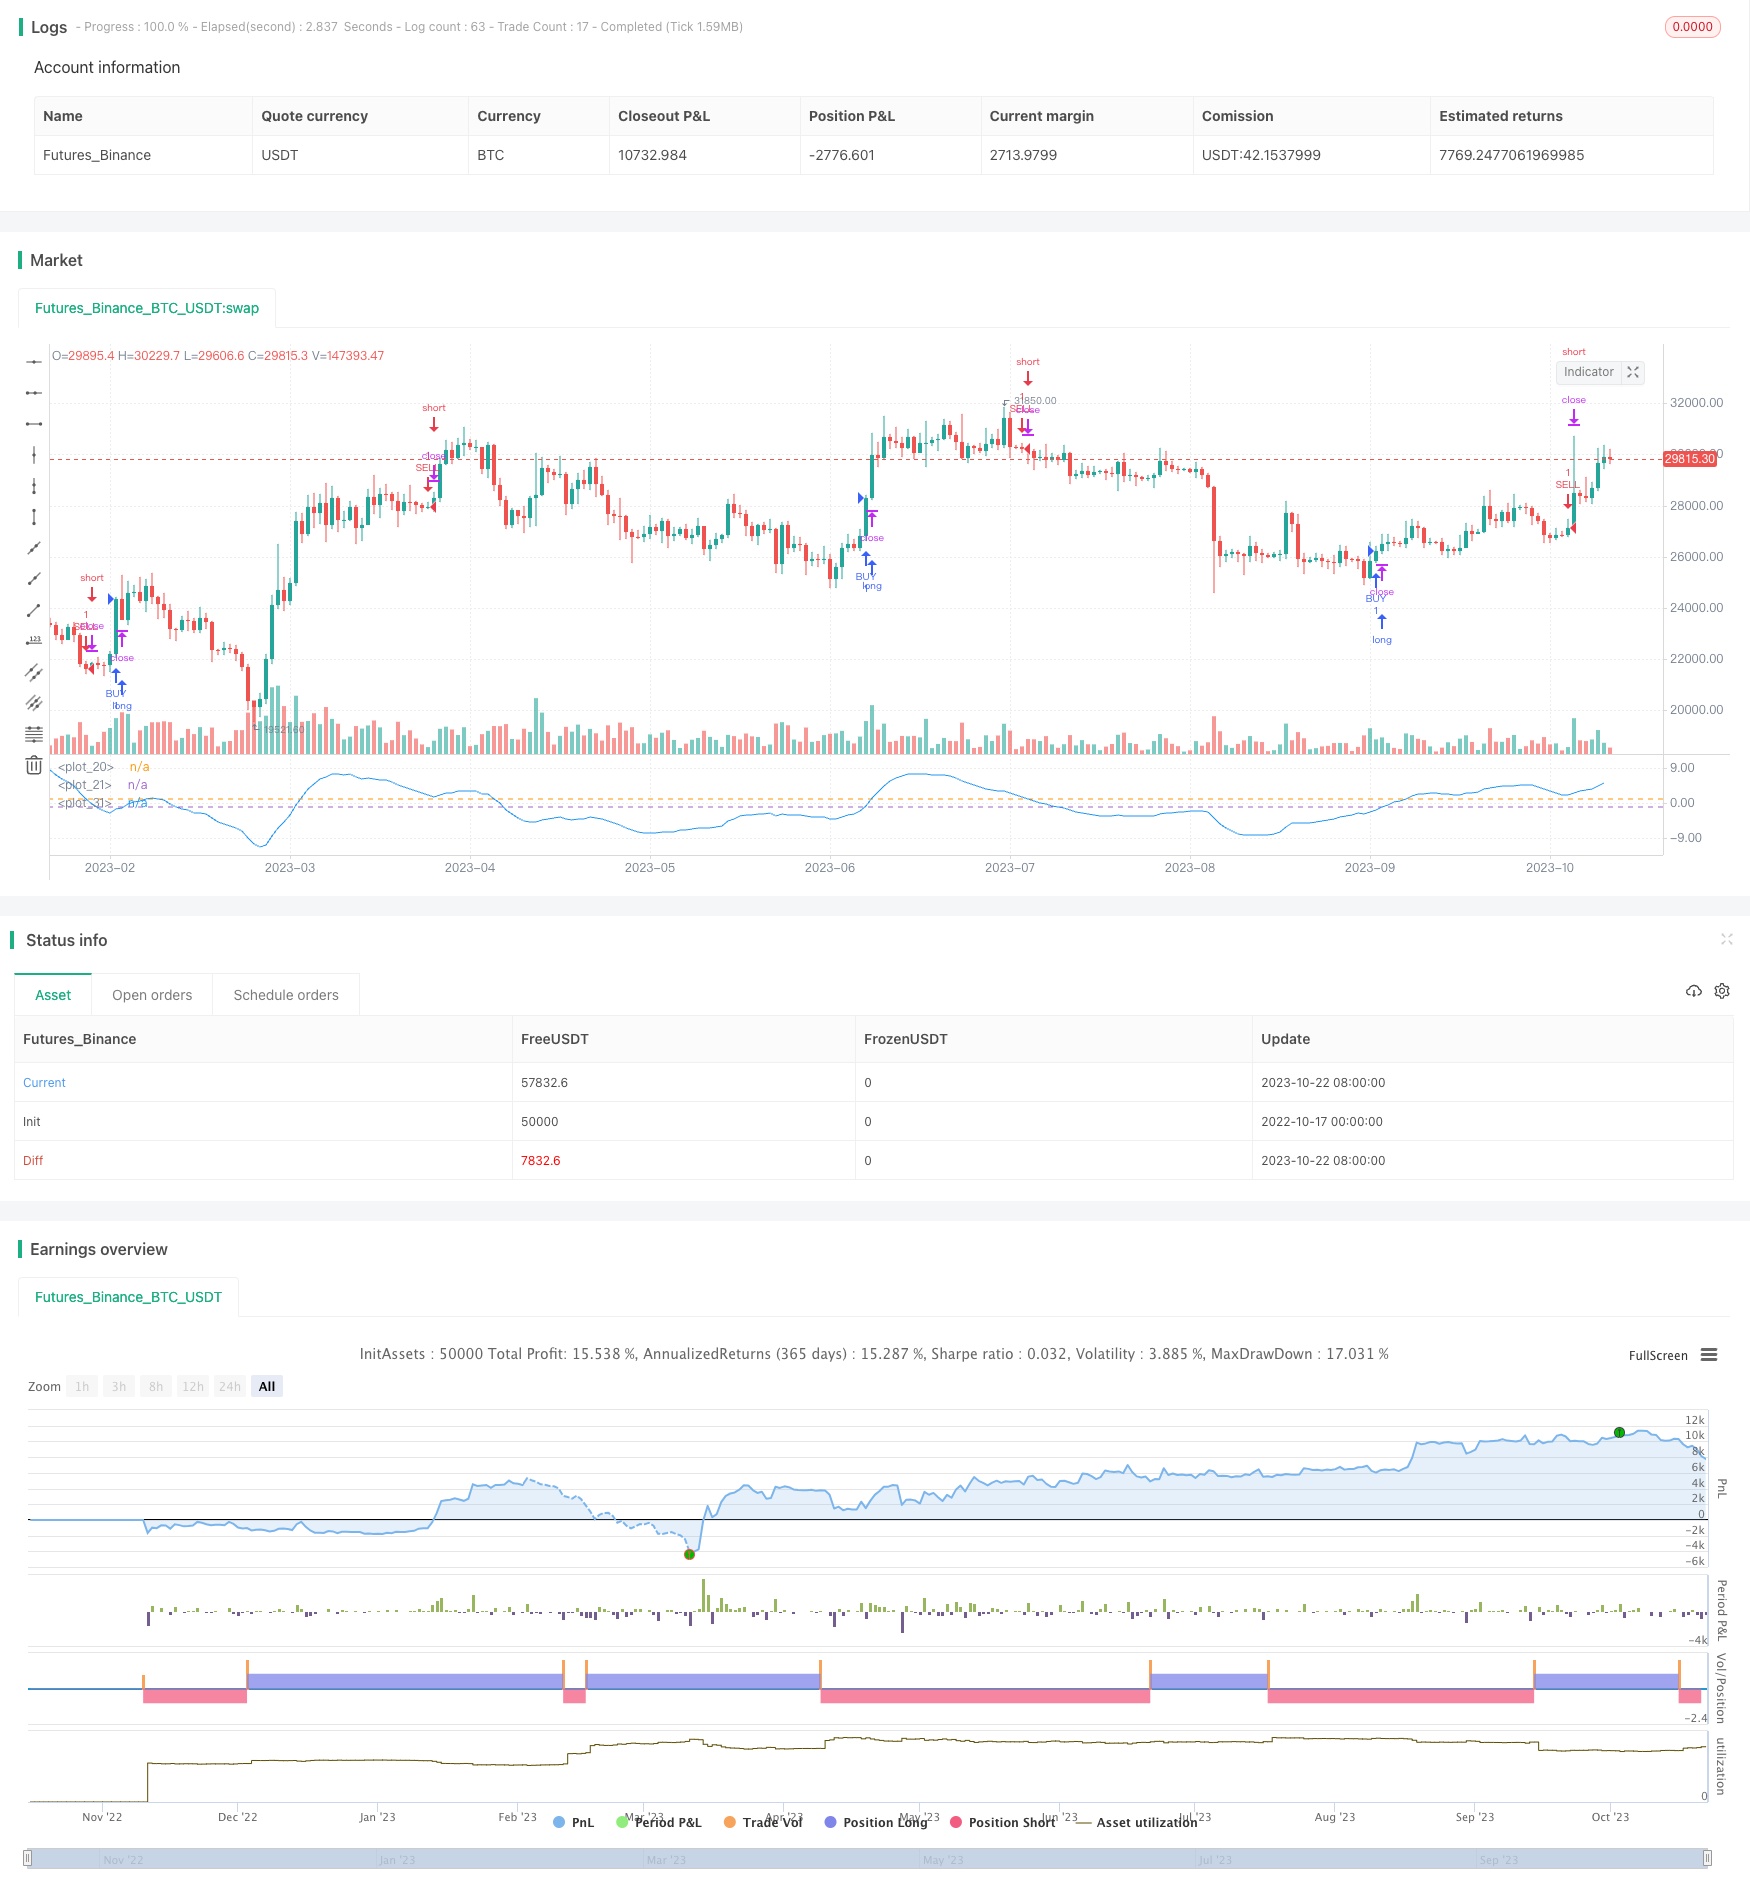
[trans]
概述
该策略运用双指数移动平均线(DEMA)计算价格的波动率,并对波动率进行再平滑处理,从而发现价格波动的趋势,在波动率上升时做多,在波动率下降时做空。
策略原理
-
计算价格的双指数移动平均线(DEMA),公式为:DEMA = 2*EMA(price, N) - EMA(EMA(price, N), N)
-
计算价格相对于DEMA的波动率:波动率 = (price - DEMA) / price * 100%
-
对波动率进行再次DEMA平滑处理,获取波动率的趋势信号
-
当再平滑后的波动率上穿某一水平时,做多;当再平滑后的波动率下穿某一水平时,做空
-
可设定只在某个时间段内交易
策略优势
-
使用双指数移动平均线,能更快捕捉价格变化趋势
-
波动率能反映市场的多空情绪,波动率上升代表多头占优,下降代表空头占优
-
对波动率进行二次平滑,可过滤掉短期噪音,捕捉主要趋势
-
可设定只在特定时间段交易,避免不必要的滑点损失
-
采用止损、离场策略,可控制风险
策略风险
-
在剧烈行情时,DEMA可能产生滞后,从而错过最佳入场点位
-
波动率指标可能出现虚假突破,应结合其他指标进行验证
-
sollte设定止损点位,以防止亏损扩大
-
在交易时间段之外,会错过交易机会
-
交易时间段的选择需要根据历史数据测试,不恰当的时间段可能降低收益
风险解决方案
-
优化DEMA参数,采用更小幅度的N值
-
结合其他指标如RSI、MACD等进行综合判断
-
根据历史数据和最大可承受亏损确定止损点
-
优化交易时间段的选择
-
对不同品种分别测试最佳交易时间段
策略优化方向
-
测试不同的DEMA参数组合,找到平滑效果最佳的参数
-
尝试其他不同类型的移动平均线,如EMA、SMA等
-
对波动率指标进行多次平滑,找到最佳的平滑参数
-
添加其他辅助指标,实现多因子 verification
-
使用机器学习等方法自动优化入场和离场参数
-
针对不同品种分别测试最佳参数组合
-
增加止损和离场策略,严格控制风险
总结
该策略通过计算价格的DEMA波动率并进行再平滑,能快速发现市场多空情绪的变化趋势,在波动率上升时做多,在波动率下降时做空,实现顺势交易。但策略可能存在DEMA滞后、虚假突破等问题。应优化参数,严格止损,并辅助其他指标进行综合判断。如果使用得当,该策略可以抓住市场趋势换向的机会,获得较好的投资回报。
||
Overview
This strategy uses Double Exponential Moving Average (DEMA) to calculate price volatility, and further smoothes the volatility to detect trends in price fluctuations, going long when volatility rises and short when volatility falls.
Strategy Logic
-
Calculate Double Exponential Moving Average (DEMA) of price, formula: DEMA = 2*EMA(price, N) - EMA(EMA(price, N), N)
-
Calculate price volatility relative to DEMA: Volatility = (price - DEMA) / price * 100%
-
Apply DEMA smoothing on volatility again to get trend signal of volatility
-
When smoothed volatility crosses above a level, go long. When it crosses below, go short.
-
Can set to trade only during specific time period.
Advantages
-
DEMA catches trend changes faster than simple moving averages.
-
Volatility reflects market sentiment, rise in volatility represents dominance of bulls, fall represents bears.
-
Smoothing volatility filters out short-term noise and captures major trend.
-
Trading in specific time periods avoids unnecessary slippage costs.
-
Stop loss and exit strategies control risk.
Risks
-
DEMA may lag during strong trends, missing best entry points.
-
Volatility index may give false signals, should combine with other indicators.
-
Should set stop loss to prevent magnified losses.
-
Missing opportunities outside trading time period.
-
Trading time period needs testing on historical data, improper time may reduce profits.
Risk Management
-
Optimize DEMA parameters, use smaller N values.
-
Combine other indicators like RSI, MACD for confirmation.
-
Set stop loss based on historical data and maximum tolerable loss.
-
Optimize trading time period selection.
-
Test optimal trading times separately for different products.
Enhancement Opportunities
-
Test different DEMA parameter combinations for best smoothing.
-
Try other moving averages like EMA, SMA.
-
Additional smoothing of volatility with different parameters.
-
Add other indicators for multi-factor verification.
-
Use machine learning to auto-optimize entry and exit parameters.
-
Test optimal parameters separately for different products.
-
Add stop loss and exit strategies to control risk.
Summary
This strategy captures trend changes in market sentiment by calculating smoothed DEMA volatility, going long when volatility rises and short when it falls. But DEMA lag and false signals are risks. Parameters should be optimized, strict stop loss implemented, and other indicators combined for confirmation. If used properly, this strategy can catch trend reversals and provide good investment returns.
[/trans]
Strategy Arguments
| Argument | Default | Description |
|---|---|---|
| v_input_1 | -2 | buyper |
| v_input_2 | 2 | sellper |
| v_input_3 | 50 | Dema Length |
| v_input_4 | true | Band for OverBought |
| v_input_5 | -1 | Band for OverSold |
| v_input_6 | 21 | DEMA to Calculate dema of DPD |
| v_input_7 | 2018 | yearfrom |
| v_input_8 | 2019 | yearuntil |
| v_input_9 | 6 | monthfrom |
| v_input_10 | 12 | monthuntil |
| v_input_11 | true | dayfrom |
| v_input_12 | 31 | dayuntil |
Source (PineScript)
/*backtest
start: 2022-10-17 00:00:00
end: 2023-10-23 00:00:00
period: 1d
basePeriod: 1h
exchanges: [{"eid":"Futures_Binance","currency":"BTC_USDT"}]
*/

//@version= 2
strategy("DEMA of DPD Strategy ",shorttitle="DPD% DEMA " ,overlay=false)

buyper =input(-2)
sellper=input(2)

demalen = input(50,title="Dema Length")

e1= ema(close,demalen)
e2=ema(e1,demalen)
demaprice  =   2 * e1 - e2

price=close
demadifper =  ((price-demaprice)/price)*100


OverDemaPer = input(1, title="Band for OverBought")
UnderDemaPer= input(-1,title="Band for OverSold")

band1 = hline(OverDemaPer)
band0 = hline(UnderDemaPer)
zeroline=0
fill(band1, band0, color=green, transp=90)


demalen2 = input(21,title="DEMA to Calculate dema of DPD")
demaofdpd =ema(demadifper,demalen2)
demaofdpd2 =ema(demaofdpd,demalen2)
resultstrategy = 2*demaofdpd - demaofdpd2

plot(resultstrategy,color=blue)


yearfrom = input(2018)
yearuntil =input(2019)
monthfrom =input(6)
monthuntil =input(12)
dayfrom=input(1)
dayuntil=input(31)


if (  crossover(resultstrategy,buyper)  )
    strategy.entry("BUY", strategy.long, stop=close, oca_name="TREND",  comment="BUY")

else
    strategy.cancel(id="BUY")


if ( crossunder(resultstrategy,sellper) )

    strategy.entry("SELL", strategy.short,stop=close, oca_name="TREND",  comment="SELL")
else
    strategy.cancel(id="SELL")
Detail
https://www.fmz.com/strategy/430050
Last Modified
2023-10-24 16:04:37