
9.1 KiB
Name
Cryptocurrency动量突破策略Cryptocurrency-Momentum-Breakout-Strategy
Author
ChaoZhang
Strategy Description
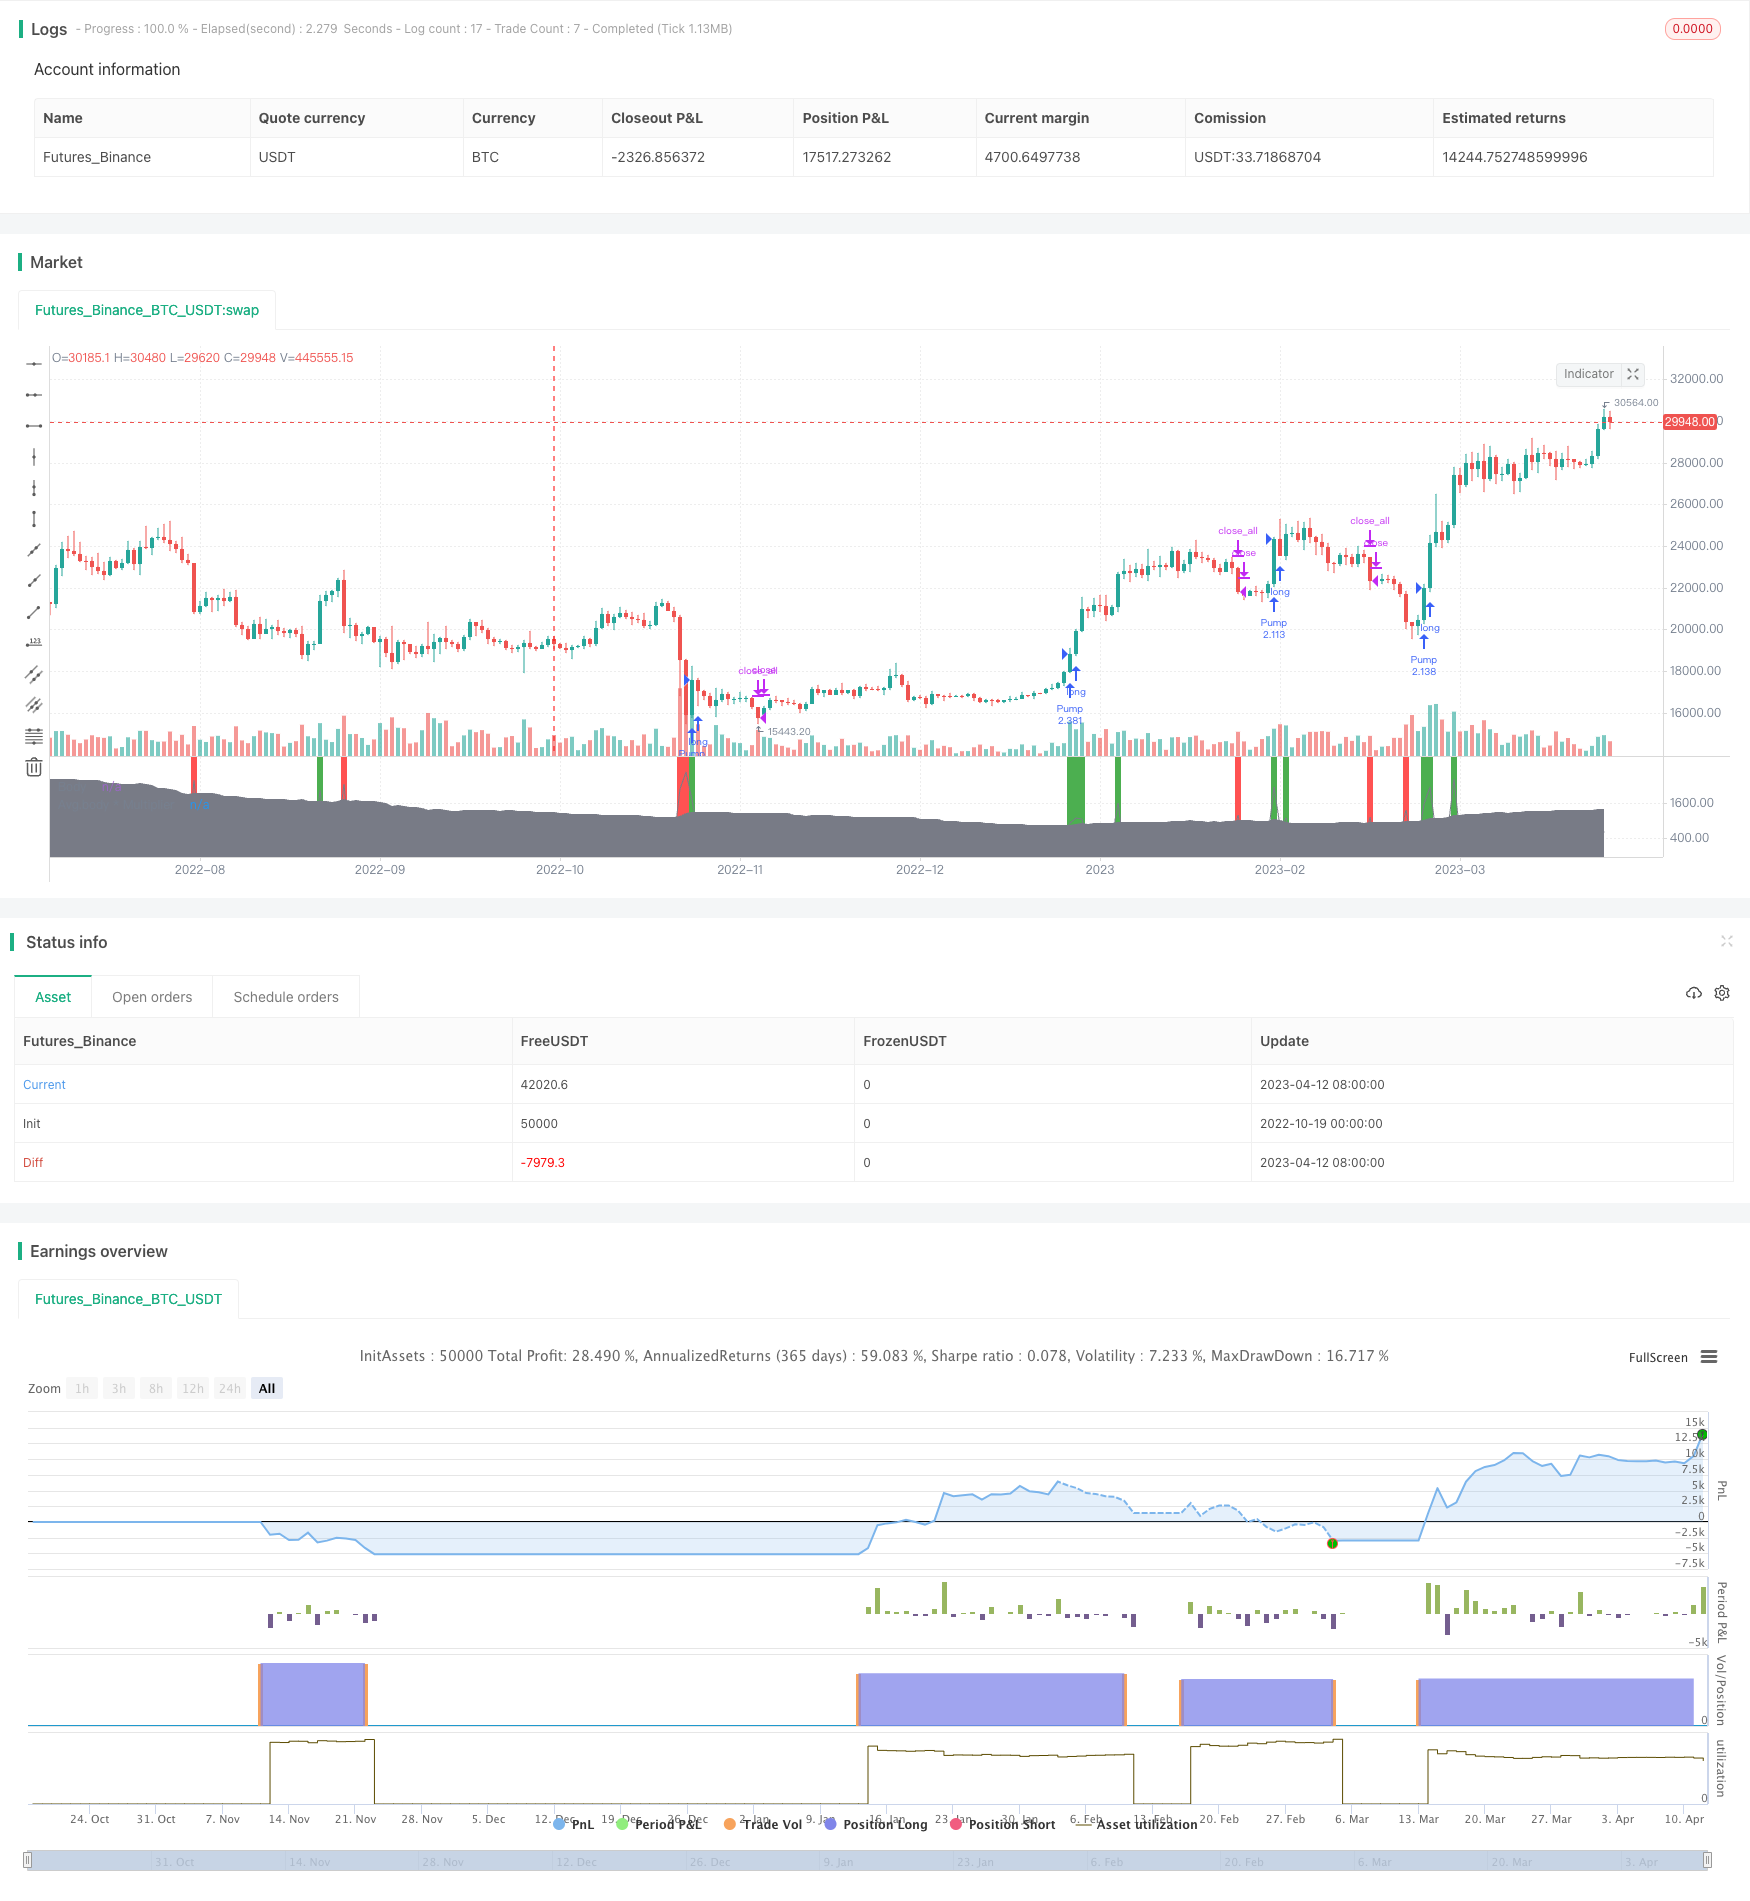
[trans]
概述
本策略利用动量指标识别Cryptocurrency市场的主要趋势方向,在突破点建立多头头寸,实现追涨杀跌的交易思路。
策略原理
该策略使用自定义的“Pump&Dump 振荡器”作为唯一指标。该振荡器利用K线实体的大小来识别市场的主要趋势方向。具体来说,它计算K线实体的平均值,并乘以一个用户设定的乘数。当实体大于移动平均时,代表着当前处于上涨趋势中;当实体小于移动平均时,代表着当前处于下跌趋势中。
根据振荡器的指标,本策略只建立多头头寸。当指标显示目前处于上涨阶段时,在该根K线收盘时建立多头头寸。此后,如果出现下跌信号,或者止损点被触发,则平掉所有头寸。
本策略提供两种止损方式,可以任选其一或者同时使用:
-
百分比止损:用户可以设置一个头寸最大允许亏损的百分比。如果价格跌破这个百分比止损点,则平掉头寸。
-
突破止损:在开仓时,记录该根K线的最低点。如果之后价格跌破该点,则平掉头寸。
优势分析
本策略具有以下优势:
-
使用自定义指标识别市场趋势,更加灵敏和准确。
-
只做多,避免做空带来的无限亏损风险。
-
采用追涨杀跌思路,符合趋势交易的经典方法。
-
提供双重止损方式,可以自由选择更适合自己的止损模式。
-
代码简单清晰,容易理解和修改。
-
无需设置动态止盈,避免过早止盈导致利润流失。
风险分析
本策略也存在一些风险:
-
自定义指标可能不够稳定和可靠,存在误判风险。
-
仅建立多头头寸,可能错过短线回调做空机会。
-
止损设置可能过于保守,无法持有走势较长的头寸。
-
无动态止盈设置,需要手动及时止盈,存在操作风险。
-
虽可任意组合两种止损方式,但仍可能无法找到最佳止损点。
-
追涨杀跌策略容易受到震荡行情的误导,产生过多无效交易。
优化方向
本策略可以从以下方面进行优化:
-
尝试其他指标。例如KDJ、MACD等,找到更稳定可靠的趋势识别方式。
-
增加做空机会。允许在趋势转向时做空,提高策略收益。
-
优化止损策略。测试不同参数,找到更好的止损点。或利用ATR、MA等指标动态设定止损。
-
增加动态止盈。例如突破前高后设置止盈,减少手动操作风险。
-
进行参数优化。调整均线参数、开仓条件等,找到最佳参数组合。
-
增加过滤条件。 Only Long 或底部指标等,避免无效交易。
-
测试不同品种。评估策略在主流币种中的效果,优化适用范围。
-
利用回测和模拟优化策略,找到最优参数和止损止盈点。
总结
本策略整体是一个较为简单的追涨杀跌策略。它使用自定义的动量指标判断市场趋势,在趋势开始阶段建立多头头寸,并提供双重止损方式。主要优点是策略思路清晰,风险有限,易于操作。但也存在一些可优化空间,如止损策略、参数选择等。整体来说,该策略为 Cryptocurrency 市场提供了一个基础性的趋势策略思路,非常适合新手来学习和实践。但在实盘应用前,仍需要通过充分回测来验证其效果并进行进一步优化。 ||
Overview
This strategy utilizes momentum indicators to identify the main trend direction in the Cryptocurrency market and establishes long positions at breakout points, realizing the trading idea of trend following.
Strategy Logic
The strategy uses a custom "Pump&Dump Oscillator" as the only indicator. The oscillator uses the size of candlestick bodies to identify the main trend direction of the market. Specifically, it calculates the moving average of candlestick bodies and multiplies it by a user-set multiplier. When the body is greater than the moving average, it signals an uptrend. When the body is less than the moving average, it signals a downtrend.
Based on the oscillator indicator, this strategy only establishes long positions. When the indicator shows that the market is currently in an uptrend, a long position is established on the close of that candlestick. Afterwards, if a downtrend signal appears, or the stop loss is triggered, all positions will be closed.
The strategy provides two stop loss methods, either one or both can be used:
-
Percentage stop loss: Users can set the maximum percentage loss allowed for each position. If the price drops below this percentage stop loss level, the position will be closed.
-
Breakout stop loss: Record the lowest point of the candlestick when opening the position. If the price then drops below this point later, close the position.
Advantage Analysis
This strategy has the following advantages:
-
Uses a custom indicator to identify market trends, which is more sensitive and accurate.
-
Only goes long, avoiding the unlimited loss risk of short selling.
-
Adopts the idea of trend trading, which is a classic trend following approach.
-
Provides dual stop loss methods, allowing free choice of the more suitable stop loss mode.
-
Simple and clear code, easy to understand and modify.
-
No need to set dynamic take profit, avoiding premature profit taking leading to lost profits.
Risk Analysis
This strategy also has some risks:
-
Custom indicators may not be stable and reliable, with the risk of misjudgement.
-
Only establishing long positions may miss short-term pullback shorting opportunities.
-
Stop loss settings may be too conservative, unable to hold longer trending positions.
-
Lack of dynamic take profit requires timely manual profit taking, with operational risks.
-
Although both stop loss methods can be freely combined, the optimal stop loss point may still not be found.
-
Trend chasing strategies are prone to be misguided by ranging markets, producing excessive invalid trades.
Optimization Directions
This strategy can be optimized from the following aspects:
-
Try other indicators, such as KDJ, MACD etc, to find more stable and reliable trend identification methods.
-
Increase shorting opportunities by allowing short positions when trends reverse, improving strategy profitability.
-
Optimize stop loss strategies by testing different parameters to find better stop loss points, or use ATR, MA etc to set dynamic stops.
-
Add dynamic take profit, such as setting profit taking after breaking previous highs, reducing manual operation risks.
-
Conduct parameter optimization by adjusting MA periods, entry conditions etc to find optimal parameter combinations.
-
Add filtering conditions like Only Long or bottom indicators to avoid invalid trades.
-
Test on different products to evaluate strategy effectiveness across major coin pairs and optimize applicability.
-
Utilize backtesting and demo trading to optimize parameters and stop loss/take profit points.
Summary
Overall this is a relatively simple trend chasing strategy. It uses a custom momentum indicator to judge market trends, establishes long positions at the start of trends, and provides dual stop loss methods. The main advantages are a clear strategy logic, limited risks, and ease of operation. But there is also room for optimization in areas like stop loss strategies and parameter selection. In general, this strategy provides a fundamental trend trading idea for the Cryptocurrency market, and is very suitable for beginners to learn and practice. But sufficient backtesting should still be conducted to validate its effectiveness and optimize further before applying it in live trading.
[/trans]
Strategy Arguments
| Argument | Default | Description |
|---|---|---|
| v_input_1 | 3 | multiplier |
| v_input_2 | 100 | length |
| v_input_3 | 100 | Stop loss, % |
Source (PineScript)
/*backtest
start: 2022-10-19 00:00:00
end: 2023-04-13 00:00:00
period: 1d
basePeriod: 1h
exchanges: [{"eid":"Futures_Binance","currency":"BTC_USDT"}]
*/

//@version=3
strategy("[BoTo] Pump&Dump Strategy", shorttitle = "[BoTo] P&D Strategy", default_qty_type = strategy.percent_of_equity, default_qty_value = 100, pyramiding = 0)

//Settings
multiplier = input(3.0)
length = input(100)
stop = input(100.0, title = "Stop loss, %")

//Indicator
body = abs(close - open)
sma = sma(body, length) * multiplier
plot(body, color = gray, linewidth = 1, transp = 0, title = "Body")
plot(sma, color = gray, style = area, linewidth = 0, transp = 90, title = "Avg.body * Multiplier")

//Signals
pump = body > sma and close > open
dump = body > sma and close < open
color = pump ? green : dump ? red : na
bgcolor(color, transp = 0)

//Stops
size = strategy.position_size
autostop = 0.0
autostop := pump and size == 0 ? low : autostop[1]
userstop = 0.0
userstop := pump and size == 0 ? close - (close / 100 * stop) : userstop[1]

//Strategy
if pump
    strategy.entry("Pump", strategy.long)
if dump or low < autostop or low < userstop
    strategy.close_all()
Detail
https://www.fmz.com/strategy/430280
Last Modified
2023-10-26 17:23:20