
14 KiB
Name
Bollinger-Bands-Mean-Reversion-Trading-Strategy-with-Dynamic-Support-布林带均值回归交易策略与动态支撑
Author
ChaoZhang
Strategy Description
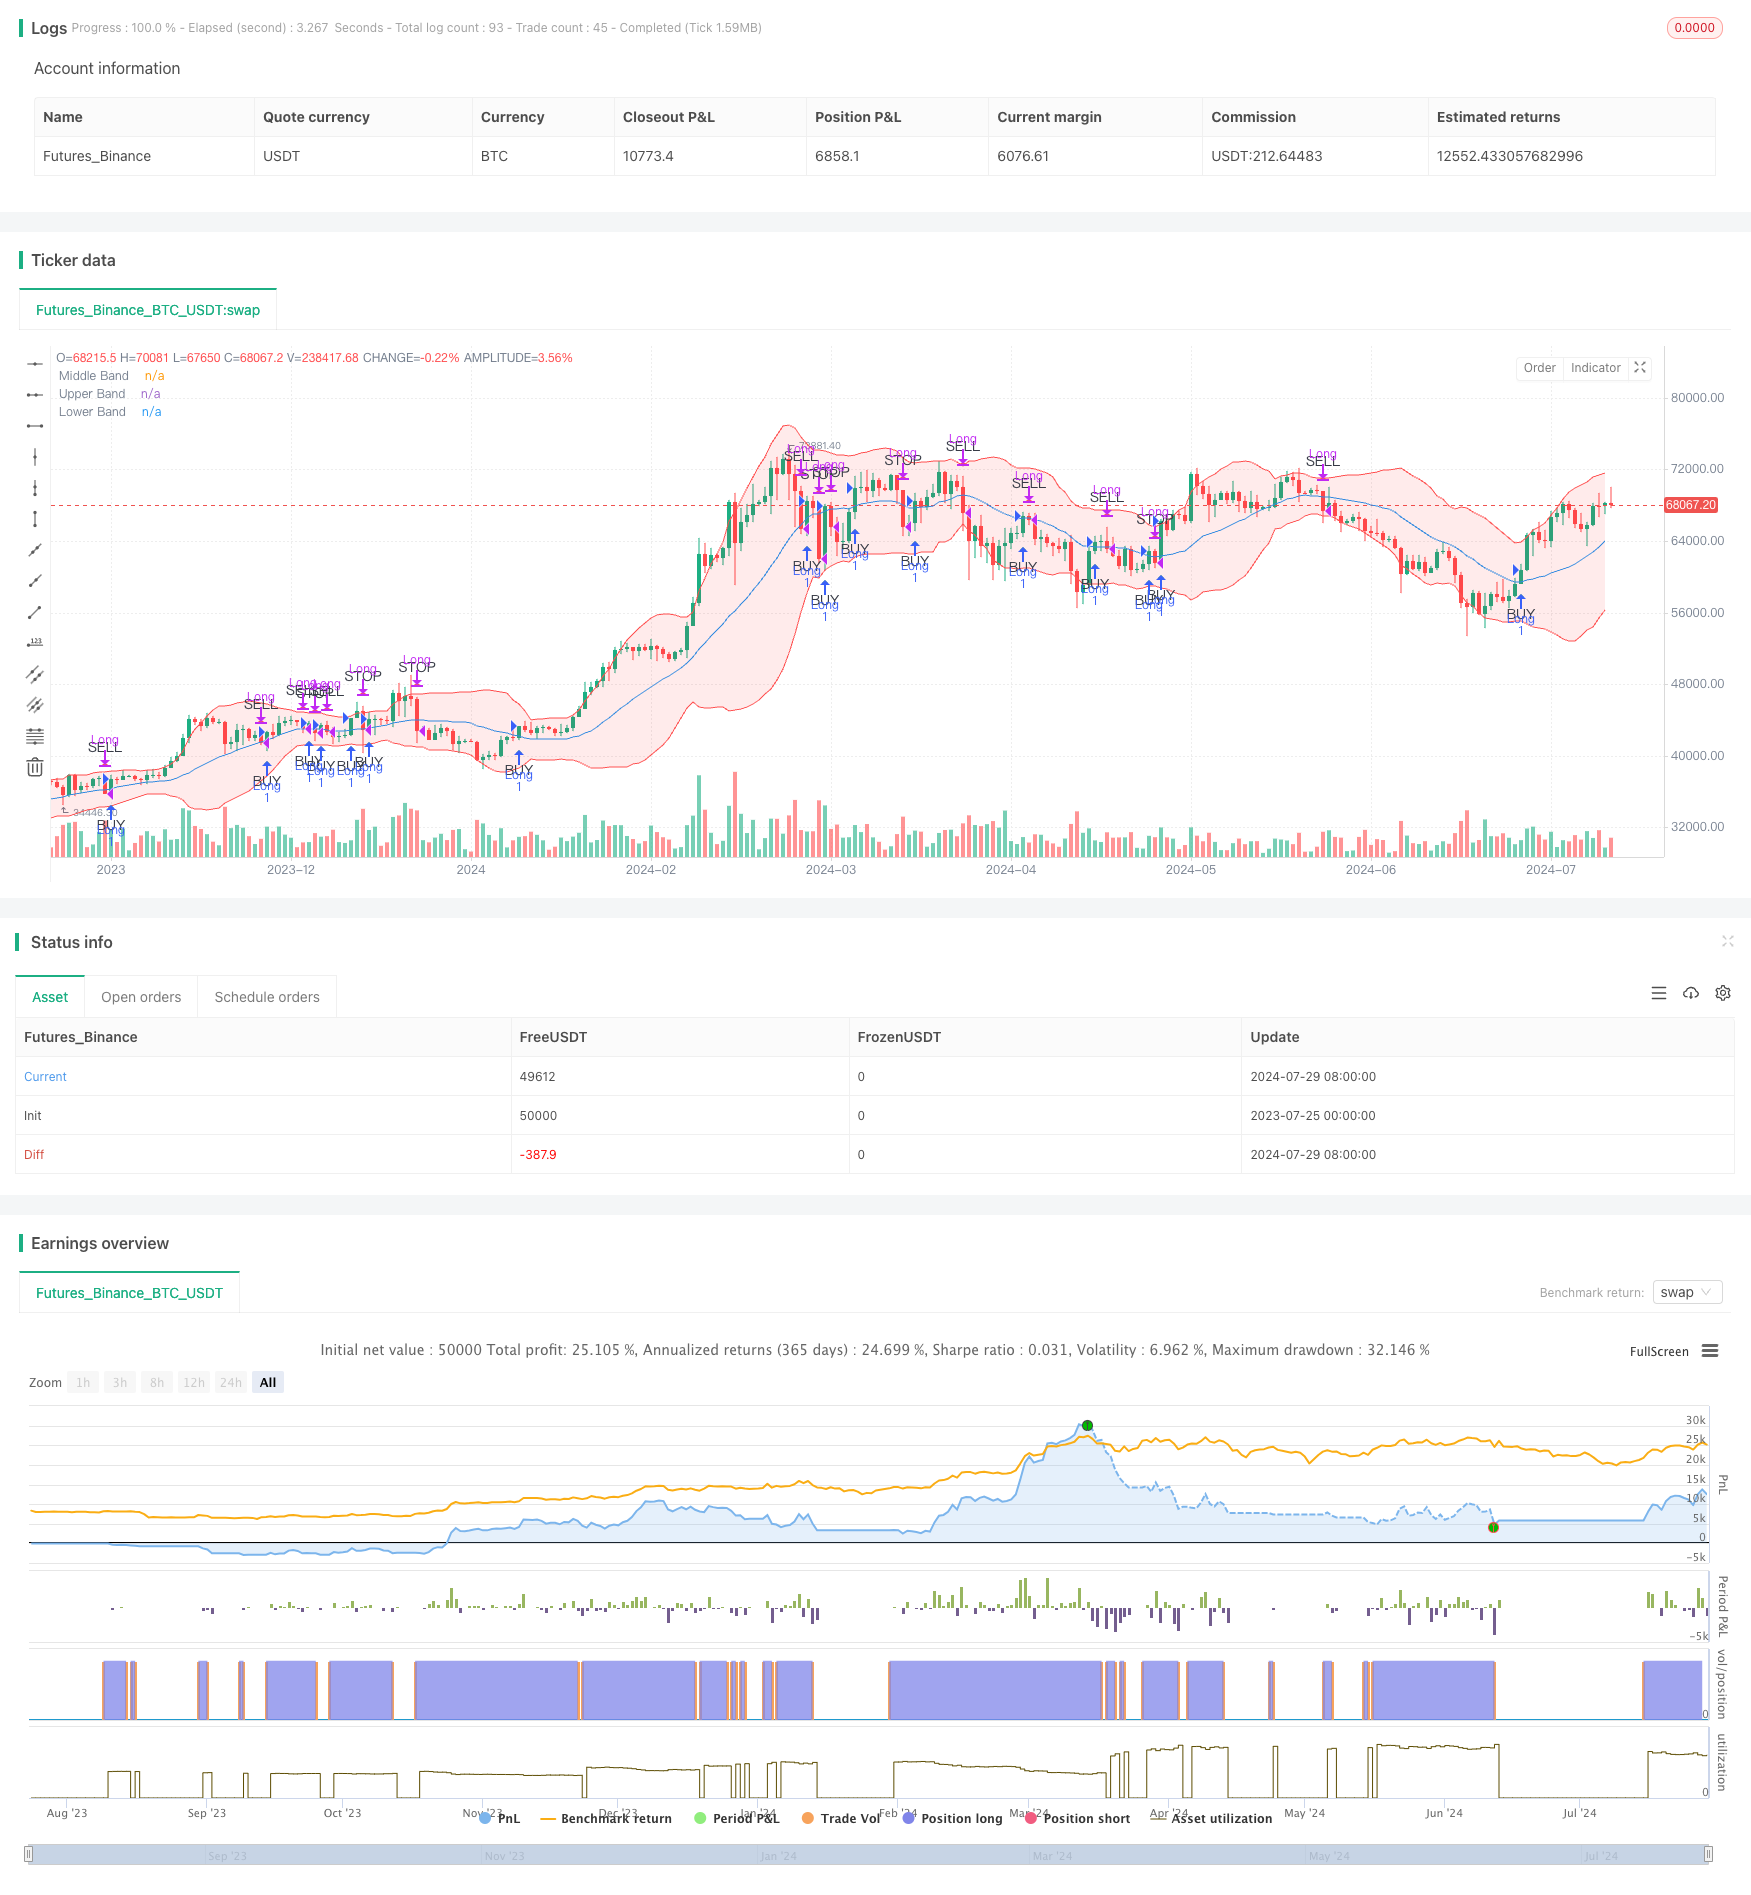
[trans]
概述
布林带均值回归交易策略与动态支撑是一种利用布林带指标来识别潜在买入机会并将中轨作为动态支撑水平进行获利了结的交易策略。该策略旨在当价格显示出向上突破中轨的迹象时进场做多,并在价格回落至中轨或从入场价格大幅下跌时退出头寸。
这种策略的核心理念基于均值回归的概念,即价格倾向于回归到其平均水平。在这种情况下,布林带的中轨代表了这个平均水平。通过等待价格突破中轨并获得确认,策略旨在提高交易的成功率,同时通过动态的出场条件来管理风险。
策略原理
该策略的运作原理如下:
-
入场条件:
- 当价格突破布林带中轨并在随后的两个交易日保持在中轨之上时,建立多头头寸。
- 这个条件有助于确保上涨趋势是持续的,而不仅仅是暂时的价格波动。
-
获利了结条件:
- 当价格从上方触及布林带中轨时,平仓多头头寸。
- 中轨在这里起到动态支撑位的作用,用于获利了结。
-
止损条件:
- 如果价格下跌超过入场价格的2%,平仓多头头寸。
- 这个止损条件有助于在价格大幅下跌时保护资金。
-
同日交易限制:
- 策略确保不会在同一天内既买入又卖出,除非触发止损条件。
- 这有助于避免不必要的交易和潜在的价格震荡。
策略使用20期简单移动平均线(SMA)作为布林带的中轨,上下轨分别为中轨加减2倍标准差。这些参数可以根据交易者的偏好和市场条件进行调整。
策略优势
-
动态适应市场:
- 布林带会根据市场波动性自动调整,使策略能够适应不同的市场环境。
-
清晰的入场和出场信号:
- 策略提供了明确的入场和出场规则,减少了主观判断的需要。
-
风险管理:
- 通过使用固定百分比止损,策略能够有效控制每笔交易的风险。
-
均值回归原理:
- 策略利用了金融市场中常见的均值回归现象,增加了盈利的可能性。
-
避免频繁交易:
- 通过要求价格保持在中轨之上两个交易日才入场,策略减少了虚假突破带来的不必要交易。
-
灵活性:
- 策略的参数(如布林带长度、标准差倍数、止损百分比)可以根据不同的市场和个人偏好进行调整。
策略风险
-
趋势市场表现不佳:
- 在强烈的趋势市场中,价格可能长期偏离均值,导致策略错过大的趋势行情。
-
过度交易风险:
- 在波动较大的市场中,价格可能频繁穿越中轨,导致过多的交易和较高的交易成本。
-
固定止损的局限性:
- 2%的固定止损可能在某些情况下过大或过小,不能很好地适应所有市场情况。
-
滑点和流动性风险:
- 在流动性较差的市场中,可能难以在精确的价格水平执行交易,影响策略表现。
-
参数敏感性:
- 策略的表现可能对布林带的参数设置较为敏感,需要仔细优化和回测。
-
假突破风险:
- 尽管有两日确认机制,仍可能出现假突破情况,导致不必要的交易。
策略优化方向
-
动态止损:
- 考虑使用基于市场波动性的动态止损,如ATR(平均真实波幅)倍数,以更好地适应不同的市场条件。
-
多时间框架分析:
- 引入更长期的时间框架分析,以确保交易方向与更大的市场趋势一致。
-
量化确认指标:
- 添加其他技术指标(如RSI或MACD)作为过滤器,以提高入场信号的质量。
-
动态参数优化:
- 实现布林带参数的动态调整,以适应不同的市场周期和波动性。
-
部分仓位管理:
- 引入分批建仓和平仓机制,以更好地管理风险和捕捉价格波动。
-
市场环境过滤:
- 加入市场环境识别机制,在不适合均值回归交易的市场环境中暂停交易。
-
止盈优化:
- 考虑在上轨附近设置额外的止盈条件,以捕捉更大的价格波动。
-
交易成本考虑:
- 在策略逻辑中加入交易成本的考虑,以避免过于频繁的小额交易。
总结
布林带均值回归交易策略与动态支撑是一种结合了技术分析和统计学原理的量化交易方法。通过利用布林带指标,该策略试图在价格偏离均值后捕捉其回归的机会,同时通过动态支撑和止损机制来管理风险。
这种策略的主要优势在于其清晰的交易规则和对市场波动性的动态适应能力。然而,它也面临着在强趋势市场中表现不佳以及可能过度交易的风险。
为了进一步提高策略的稳健性和适应性,可以考虑引入动态止损、多时间框架分析、额外的确认指标以及更复杂的仓位管理技术。同时,对策略参数进行持续的优化和回测也是至关重要的。
总的来说,这种策略为交易者提供了一个系统化的方法来捕捉价格波动并管理风险。然而,像所有交易策略一样,它并不是万能的,需要根据具体的市场条件和个人风险偏好进行调整和优化。在实际应用中,建议交易者在实盘交易之前进行充分的回测和模拟交易,以充分了解策略的特性和潜在风险。
||
Overview
The Bollinger Bands Mean Reversion Trading Strategy with Dynamic Support is a trading approach that utilizes Bollinger Bands to identify potential buying opportunities and uses the middle band as a dynamic support level for taking profits. This strategy aims to enter long positions when the price shows signs of moving above the middle band and to exit positions either when the price returns to the middle band or if the price drops significantly from the entry level.
The core concept of this strategy is based on the principle of mean reversion, which suggests that prices tend to return to their average level. In this case, the middle Bollinger Band represents this average level. By waiting for confirmation of the price movement above the middle band and using dynamic exit conditions, the strategy seeks to enhance the probability of profitable trades while managing risk.
Strategy Principles
The strategy operates on the following principles:
-
Entry Condition:
- A long position is established when the price crosses above the middle Bollinger Band and remains above it for two consecutive trading days.
- This condition helps ensure that the upward movement is sustained and not just a temporary fluctuation.
-
Take Profit Condition:
- The long position is closed when the price touches the middle Bollinger Band from above.
- The middle band acts as a dynamic support level for taking profits.
-
Stop Loss Condition:
- The long position is closed if the price drops below 2% of the entry price.
- This stop-loss condition helps protect against significant losses.
-
No Same-Day Trading:
- The strategy ensures that no buy and sell occur on the same day unless the stop-loss condition is met.
- This helps in avoiding unnecessary transactions and potential whipsaws.
The strategy uses a 20-period Simple Moving Average (SMA) as the middle Bollinger Band, with the upper and lower bands set at 2 standard deviations above and below the middle band. These parameters can be adjusted based on trader preferences and market conditions.
Strategy Advantages
-
Dynamic Market Adaptation:
- Bollinger Bands automatically adjust to market volatility, allowing the strategy to adapt to different market environments.
-
Clear Entry and Exit Signals:
- The strategy provides well-defined entry and exit rules, reducing the need for subjective judgment.
-
Risk Management:
- By using a fixed percentage stop-loss, the strategy effectively controls risk for each trade.
-
Mean Reversion Principle:
- The strategy capitalizes on the common phenomenon of mean reversion in financial markets, increasing the probability of profitable trades.
-
Avoidance of Frequent Trading:
- By requiring the price to remain above the middle band for two trading days before entry, the strategy reduces unnecessary trades caused by false breakouts.
-
Flexibility:
- The strategy's parameters (such as Bollinger Band length, standard deviation multiplier, stop-loss percentage) can be adjusted to suit different markets and personal preferences.
Strategy Risks
-
Underperformance in Trending Markets:
- In strongly trending markets, prices may deviate from the mean for extended periods, causing the strategy to miss out on significant trends.
-
Overtrading Risk:
- In highly volatile markets, price may frequently cross the middle band, leading to excessive trading and higher transaction costs.
-
Limitations of Fixed Stop-Loss:
- The 2% fixed stop-loss may be too large or too small in certain situations, not adapting well to all market conditions.
-
Slippage and Liquidity Risk:
- In less liquid markets, it may be difficult to execute trades at precise price levels, affecting strategy performance.
-
Parameter Sensitivity:
- The strategy's performance may be sensitive to Bollinger Band parameter settings, requiring careful optimization and backtesting.
-
False Breakout Risk:
- Despite the two-day confirmation mechanism, false breakouts can still occur, leading to unnecessary trades.
Strategy Optimization Directions
-
Dynamic Stop-Loss:
- Consider using a volatility-based dynamic stop-loss, such as ATR (Average True Range) multiples, to better adapt to different market conditions.
-
Multi-Timeframe Analysis:
- Incorporate longer-term timeframe analysis to ensure trade direction aligns with larger market trends.
-
Quantitative Confirmation Indicators:
- Add other technical indicators (e.g., RSI or MACD) as filters to improve the quality of entry signals.
-
Dynamic Parameter Optimization:
- Implement dynamic adjustment of Bollinger Band parameters to adapt to different market cycles and volatility.
-
Partial Position Management:
- Introduce a mechanism for scaling in and out of positions to better manage risk and capture price movements.
-
Market Environment Filtering:
- Add a market environment recognition mechanism to pause trading in conditions unsuitable for mean reversion strategies.
-
Take Profit Optimization:
- Consider setting additional take profit conditions near the upper band to capture larger price movements.
-
Transaction Cost Consideration:
- Incorporate transaction costs into the strategy logic to avoid excessively frequent small trades.
Conclusion
The Bollinger Bands Mean Reversion Trading Strategy with Dynamic Support is a quantitative trading approach that combines technical analysis with statistical principles. By utilizing Bollinger Bands, this strategy attempts to capture opportunities for price reversion to the mean after deviations, while managing risk through dynamic support and stop-loss mechanisms.
The main advantages of this strategy lie in its clear trading rules and ability to dynamically adapt to market volatility. However, it also faces risks such as underperformance in strong trending markets and potential overtrading.
To further enhance the strategy's robustness and adaptability, considerations can be made to introduce dynamic stop-losses, multi-timeframe analysis, additional confirmation indicators, and more sophisticated position management techniques. Continuous optimization and backtesting of strategy parameters are also crucial.
Overall, this strategy provides traders with a systematic approach to capturing price movements and managing risk. However, like all trading strategies, it is not infallible and requires adjustment and optimization based on specific market conditions and individual risk preferences. In practical application, it is recommended that traders conduct thorough backtesting and paper trading before implementing the strategy in live trading to fully understand its characteristics and potential risks.
[/trans]
Source (PineScript)
/*backtest
start: 2023-07-25 00:00:00
end: 2024-07-30 00:00:00
period: 1d
basePeriod: 1h
exchanges: [{"eid":"Futures_Binance","currency":"BTC_USDT"}]
*/

//@version=5
strategy("Mean Reversion Strategy with Bollinger Bands", overlay=true)

// Bollinger Bands settings
length = input.int(20, minval=1, title="Bollinger Bands Length")
src = input(close, title="Source")
mult = input.float(2.0, minval=0.1, title="Bollinger Bands Multiplier")

// Calculate Bollinger Bands
basis = ta.sma(src, length)
dev = mult * ta.stdev(src, length)
upper = basis + dev
lower = basis - dev

// Plot Bollinger Bands
plot(basis, title="Middle Band", color=color.blue)
p1 = plot(upper, title="Upper Band", color=color.red)
p2 = plot(lower, title="Lower Band", color=color.red)
fill(p1, p2, color=color.rgb(255, 0, 0, 90))

// Buy condition: Price crosses above the middle band
longCondition = ta.crossover(close, basis)

// Close condition: Price touches the middle band
closeCondition = ta.crossunder(close, basis)

// Emergency stop condition: Price drops below 2% of entry price
dropCondition = strategy.position_size > 0 and close < strategy.position_avg_price * 0.98

// Plot Buy/Sell Signals only on initial cross
plotshape(series=longCondition, location=location.belowbar, color=color.green, style=shape.triangleup, textcolor=color.black, text="BUY", size=size.small)
plotshape(series=closeCondition and not dropCondition, location=location.abovebar, color=color.red, style=shape.triangledown, textcolor=color.black, text="SELL", size=size.small)
plotshape(series=dropCondition, location=location.abovebar, color=color.red, style=shape.triangledown, textcolor=color.black, text="STOP", size=size.small)

// Track entry date to ensure no same-day buy/sell
var float entryPrice = na
var int entryYear = na
var int entryMonth = na
var int entryDay = na

// Strategy Logic
if (longCondition and (na(entryDay) or (year != entryYear or month != entryMonth or dayofmonth != entryDay)))
    strategy.entry("Long", strategy.long)
    entryPrice := close
    entryYear := year
    entryMonth := month
    entryDay := dayofmonth

if ((closeCondition or dropCondition) and strategy.position_size > 0 and (na(entryDay) or (year != entryYear or month != entryMonth or dayofmonth != entryDay or dropCondition)))
    strategy.close("Long")
    entryDay := na
Detail
https://www.fmz.com/strategy/458268
Last Modified
2024-07-31 14:19:48