
7.2 KiB
Name
Bollinger-Bands-Dynamic-Breakout-Strategy-动态布林带突破策略
Author
ChaoZhang
Strategy Description
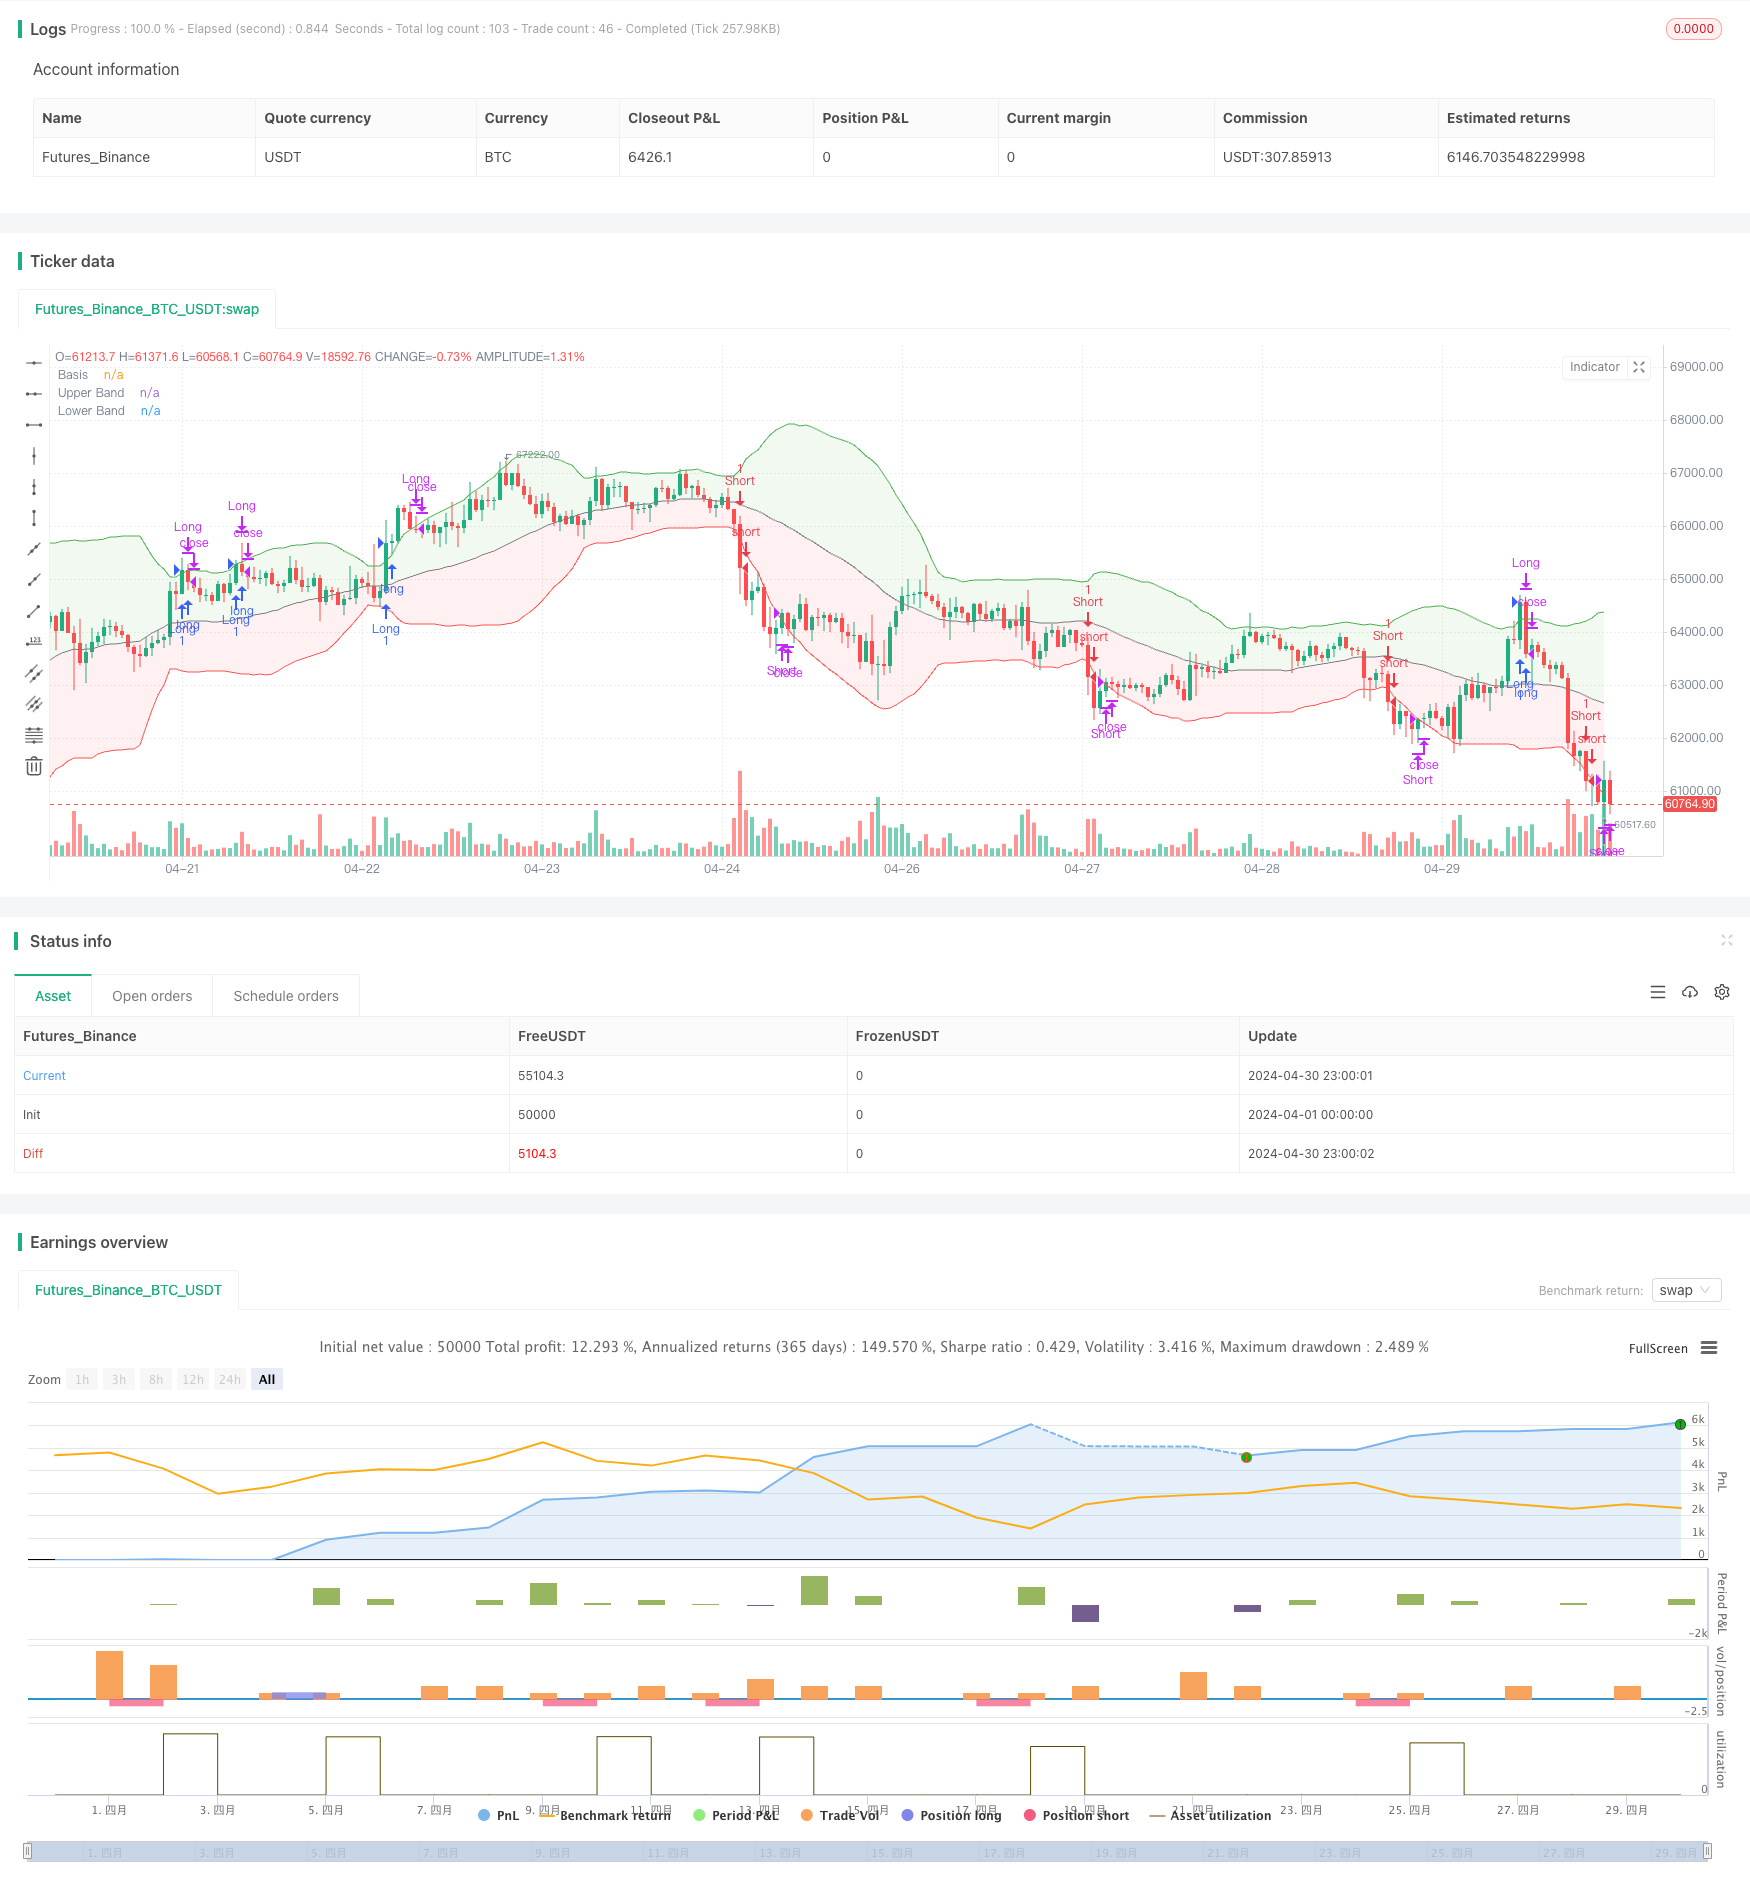
[trans]
概述
动态布林带突破策略是一种基于布林带指标的交易策略。该策略利用布林带上下轨作为动态支撑位和阻力位,当价格突破上轨时买入,突破下轨时卖出。布林带由中轨(移动平均线)、上轨(中轨加标准差的倍数)和下轨(中轨减标准差的倍数)组成,可以动态调整以适应市场波动。
策略原理
- 计算布林带的中轨、上轨和下轨。中轨为收盘价的简单移动平均线,上轨为中轨加上标准差的倍数,下轨为中轨减去标准差的倍数。
- 当价格上穿布林带上轨时,开仓做多;当价格下穿布林带下轨时,开仓做空。
- 当做多仓位存在时,如果价格下穿布林带上轨,平掉多头仓位;当做空仓位存在时,如果价格上穿布林带下轨,平掉空头仓位。
策略优势
- 布林带能够动态调整,适应不同的市场波动状况,具有一定的自适应性。
- 策略逻辑清晰,容易理解和实现。
- 布林带在市场趋势性较强的时候效果较好,可以有效捕捉趋势。
策略风险
- 在市场波动较大、走势震荡的情况下,该策略可能会频繁交易,导致交易成本增加。
- 布林带参数(如移动平均期间和标准差倍数)的选择会影响策略表现,不同参数可能带来不同结果。
- 该策略没有考虑其他技术指标或基本面因素,仅依赖价格与布林带的关系进行交易决策,可能面临单一信号带来的风险。
策略优化方向
- 引入其他技术指标(如RSI、MACD等)作为过滤条件,以确认布林带突破的有效性,提高信号质量。
- 对布林带参数进行优化,通过回测和参数扫描,寻找最佳的移动平均期间和标准差倍数组合。
- 设置合适的止损和止盈水平,控制单次交易风险和盈利目标。
- 考虑市场状态和波动性,在不同市场状态下动态调整策略参数或仓位大小。
总结
动态布林带突破策略是一种简单易用的交易策略,通过布林带上下轨的突破来产生交易信号。该策略在趋势性市场中表现较好,但在震荡市场中可能面临频繁交易的问题。优化方向包括结合其他技术指标、优化参数、设置适当的止损止盈以及根据市场状态调整策略等。在实际应用中,需要根据具体市场特点和个人风险偏好进行适当调整和优化。
||
Overview
The Dynamic Bollinger Bands Breakout Strategy is a trading strategy based on the Bollinger Bands indicator. This strategy uses the upper and lower bands of the Bollinger Bands as dynamic support and resistance levels, buying when the price breaks above the upper band and selling when it breaks below the lower band. Bollinger Bands consist of a middle band (moving average), an upper band (middle band plus a multiple of standard deviation), and a lower band (middle band minus a multiple of standard deviation), which can be dynamically adjusted to adapt to market volatility.
Strategy Principle
- Calculate the middle, upper, and lower bands of the Bollinger Bands. The middle band is the simple moving average of the closing price, the upper band is the middle band plus a multiple of the standard deviation, and the lower band is the middle band minus a multiple of the standard deviation.
- When the price crosses above the upper band, open a long position; when the price crosses below the lower band, open a short position.
- When a long position exists, if the price crosses below the upper band, close the long position; when a short position exists, if the price crosses above the lower band, close the short position.
Strategy Advantages
- Bollinger Bands can dynamically adjust to adapt to different market volatility conditions, providing a certain degree of adaptability.
- The strategy logic is clear and easy to understand and implement.
- Bollinger Bands perform well when the market trend is strong and can effectively capture trends.
Strategy Risks
- In situations where market volatility is high and the trend is choppy, this strategy may frequently trade, leading to increased transaction costs.
- The selection of Bollinger Bands parameters (such as the moving average period and standard deviation multiple) will affect the strategy's performance, and different parameters may bring different results.
- This strategy does not consider other technical indicators or fundamental factors and relies solely on the relationship between price and Bollinger Bands for trading decisions, which may face risks brought by a single signal.
Strategy Optimization Directions
- Introduce other technical indicators (such as RSI, MACD, etc.) as filtering conditions to confirm the validity of Bollinger Band breakouts and improve signal quality.
- Optimize Bollinger Bands parameters by backtesting and parameter scanning to find the best combination of moving average period and standard deviation multiple.
- Set appropriate stop-loss and take-profit levels to control single transaction risk and profit targets.
- Consider market conditions and volatility, dynamically adjusting strategy parameters or position sizes under different market conditions.
Summary
The Dynamic Bollinger Bands Breakout Strategy is a simple and easy-to-use trading strategy that generates trading signals through breakouts of the upper and lower bands of the Bollinger Bands. This strategy performs well in trending markets but may face frequent trading issues in choppy markets. Optimization directions include combining other technical indicators, optimizing parameters, setting appropriate stop-losses and take-profits, and adjusting strategies according to market conditions. In practical applications, it is necessary to make appropriate adjustments and optimizations based on specific market characteristics and personal risk preferences. [/trans]
Source (PineScript)
/*backtest
start: 2024-04-01 00:00:00
end: 2024-04-30 23:59:59
period: 1h
basePeriod: 15m
exchanges: [{"eid":"Futures_Binance","currency":"BTC_USDT"}]
*/

//@version=5
strategy("Bollinger Bands with Strategy", shorttitle='MBB', overlay=true)

// Input Variables
src = close
length = input.int(34, "Length", minval=1)
mult = input.float(2.0, "Multiplier", minval=0.001, maxval=50)

// Bollinger Bands Calculation
basis = ta.sma(src, length)
dev = ta.stdev(src, length)
upperBand = basis + mult * dev
lowerBand = basis - mult * dev

// Plotting Bollinger Bands
pBasis = plot(basis, "Basis", color=color.gray)
pUpper = plot(upperBand, "Upper Band", color=color.green)
pLower = plot(lowerBand, "Lower Band", color=color.red)
fill(pUpper, pBasis, color=color.new(color.green, 90))
fill(pBasis, pLower, color=color.new(color.red, 90))

// Strategy Execution Using `if`
if (ta.crossover(src, upperBand))
    strategy.entry("Long", strategy.long)
if (ta.crossunder(src, lowerBand))
    strategy.entry("Short", strategy.short)

if (ta.crossunder(src, upperBand))
    strategy.close("Long")
if (ta.crossover(src, lowerBand))
    strategy.close("Short")
Detail
https://www.fmz.com/strategy/451526
Last Modified
2024-05-15 16:25:21