
7.6 KiB
Name
Bollinger-Bands与RSI结合的动量反转量化交易策略-Momentum-Reversal-Quantitative-Trading-Strategy-Combining-Bollinger-Bands-and-RSI
Author
ianzeng123
Strategy Description
[trans]
概述
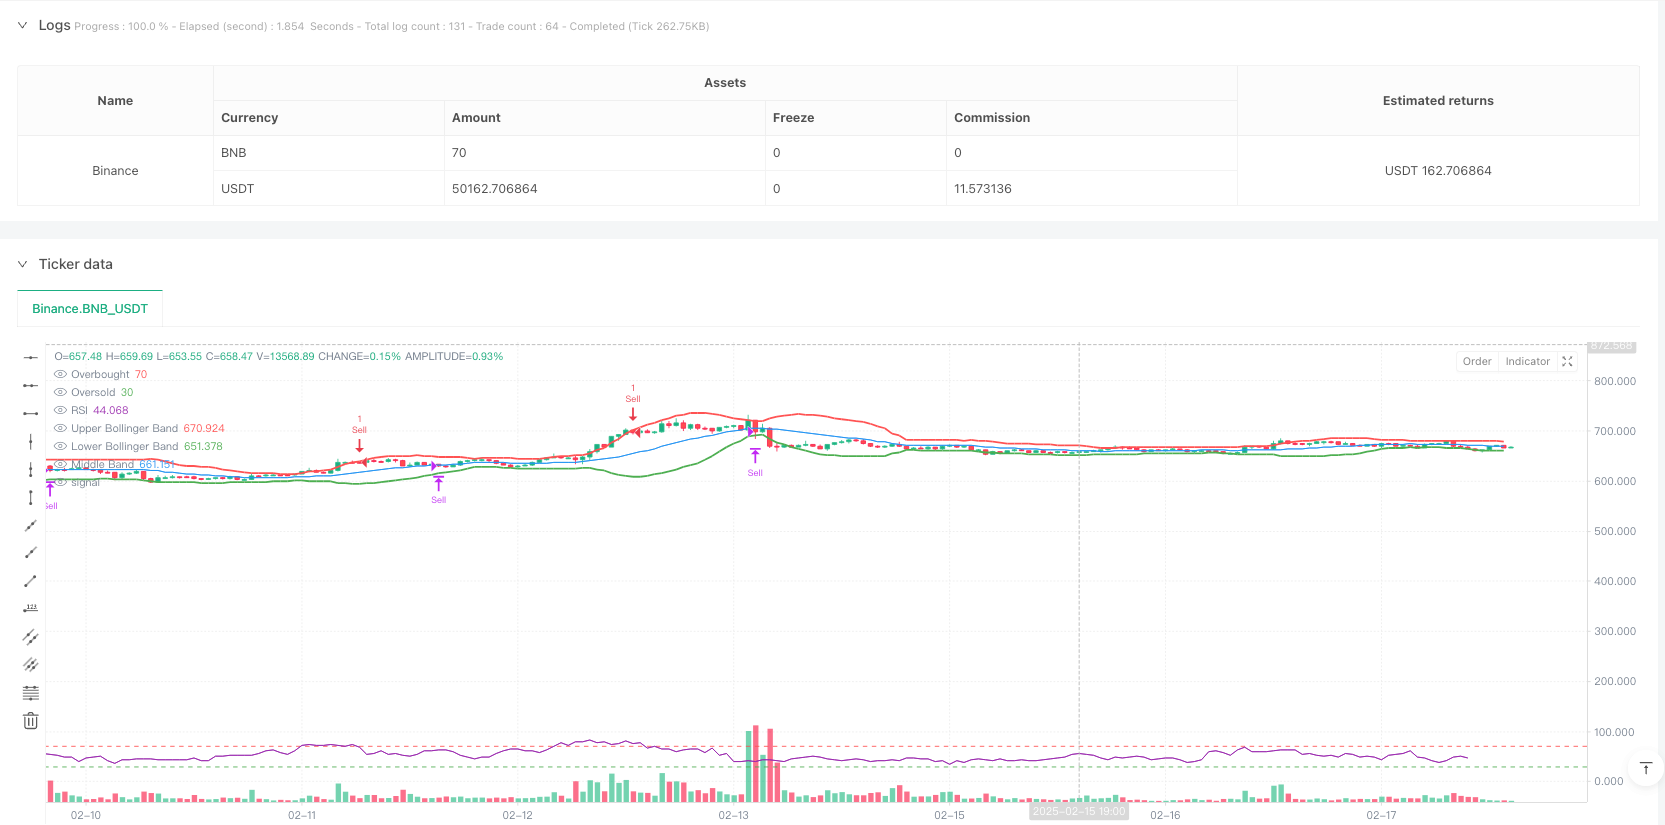
该策略是一个结合布林带(Bollinger Bands)和相对强弱指标(RSI)的技术分析交易系统。它主要利用价格波动和市场动量的特性,在超买超卖区域寻找交易机会。策略在RSI指标显示超卖(低于30)且价格突破布林带下轨时产生买入信号;在RSI指标显示超买(高于70)且价格突破布林带上轨时产生卖出信号。同时使用布林带中轨作为止损位置。
策略原理
策略的核心逻辑基于以下几个关键要素:
- 布林带参数设置采用20周期移动平均线作为中轨,标准差倍数为2.0
- RSI参数采用传统的14周期设置
- 入场条件:
- 买入:价格向上突破布林带下轨且RSI<30
- 卖出:价格向下突破布林带上轨且RSI>70
- 出场条件:价格与布林带中轨(20周期移动平均线)交叉时平仓 这种组合既考虑了价格的统计特性,又结合了动量指标,有效地提高了交易的准确性。
策略优势
- 多重确认机制:结合价格和动量指标,降低虚假信号
- 风险控制合理:使用布林带中轨作为止损点,既保护利润又控制风险
- 适应性强:布林带会根据市场波动率自动调整带宽
- 参数设置经典:采用广泛验证的参数组合,提高策略稳定性
- 逻辑清晰:交易规则明确,便于回测和实盘操作
策略风险
- 震荡市场风险:在横盘市场可能产生频繁交易信号
- 趋势市场风险:强趋势中可能错过部分行情
- 参数敏感性:布林带周期和RSI设置对策略表现影响较大
- 滑点影响:在价格快速波动时可能面临较大滑点 建议采取以下措施管理风险:
- 设置合适的仓位控制
- 增加趋势过滤器
- 优化参数自适应机制
- 考虑交易成本进行回测
策略优化方向
- 动态参数优化:
- 根据市场波动率动态调整布林带参数
- 基于市场环境调整RSI阈值
- 增加辅助指标:
- 加入成交量确认
- 考虑趋势指标作为过滤器
- 完善止损机制:
- 引入追踪止损
- 设置最大亏损限制
- 优化交易执行:
- 实现部分仓位交易
- 增加入场价格优化逻辑
总结
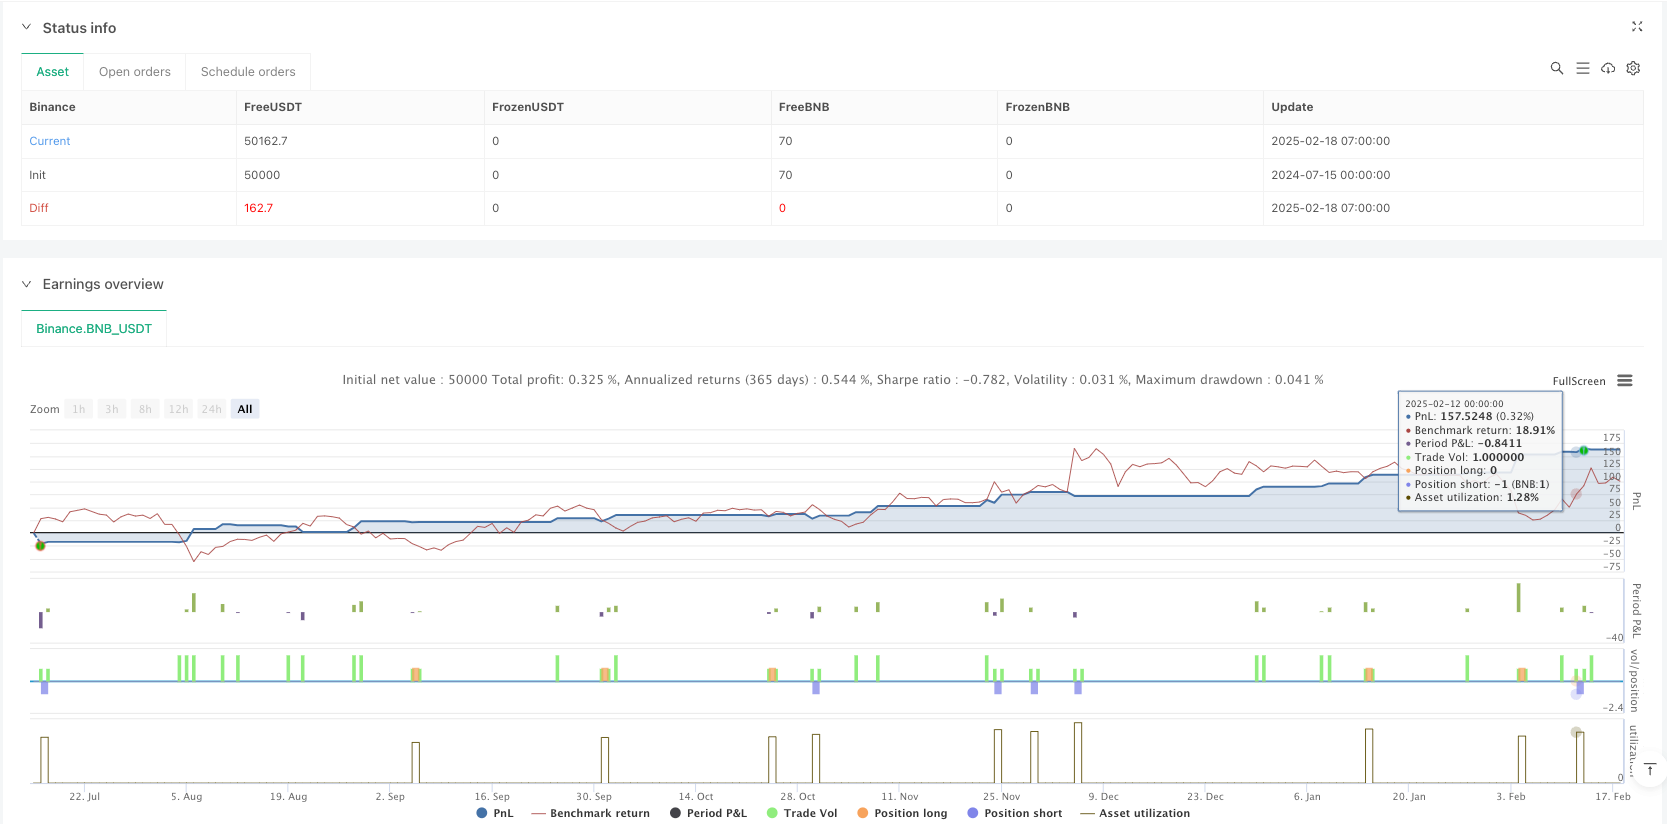
该策略通过结合布林带和RSI指标,构建了一个相对完整的交易系统。策略逻辑清晰,风险控制合理,具有一定的实用价值。通过建议的优化方向,策略还有进一步提升的空间。在实际应用中,建议投资者根据自身风险承受能力和市场环境进行适当调整。||
Overview
This strategy is a technical analysis trading system that combines Bollinger Bands and Relative Strength Index (RSI). It seeks trading opportunities in overbought and oversold areas by utilizing price volatility and market momentum characteristics. The strategy generates buy signals when RSI indicates oversold conditions (below 30) and price breaks above the lower Bollinger Band; sell signals are generated when RSI indicates overbought conditions (above 70) and price breaks below the upper Bollinger Band. The middle Bollinger Band is used as a stop-loss position.
Strategy Principles
The core logic of the strategy is based on the following key elements:
- Bollinger Bands parameters use 20-period moving average as the middle band, with a standard deviation multiplier of 2.0
- RSI uses the traditional 14-period setting
- Entry conditions:
- Buy: price breaks above lower Bollinger Band and RSI<30
- Sell: price breaks below upper Bollinger Band and RSI>70
- Exit conditions: positions are closed when price crosses the middle Bollinger Band (20-period moving average) This combination considers both price statistics and momentum indicators, effectively improving trading accuracy.
Strategy Advantages
- Multiple confirmation mechanism: combines price and momentum indicators to reduce false signals
- Reasonable risk control: uses middle Bollinger Band as stop-loss point for both profit protection and risk control
- Strong adaptability: Bollinger Bands automatically adjust bandwidth based on market volatility
- Classic parameter settings: uses widely validated parameter combinations for strategy stability
- Clear logic: trading rules are explicit, facilitating backtesting and live trading
Strategy Risks
- Choppy market risk: may generate frequent trading signals in sideways markets
- Trend market risk: might miss part of strong trends
- Parameter sensitivity: strategy performance is significantly affected by Bollinger Bands period and RSI settings
- Slippage impact: may face significant slippage during rapid price movements Recommended risk management measures:
- Set appropriate position sizing
- Add trend filters
- Optimize parameter adaptation mechanism
- Consider trading costs in backtesting
Strategy Optimization Directions
- Dynamic parameter optimization:
- Dynamically adjust Bollinger Bands parameters based on market volatility
- Adjust RSI thresholds based on market conditions
- Add auxiliary indicators:
- Include volume confirmation
- Consider trend indicators as filters
- Improve stop-loss mechanism:
- Implement trailing stops
- Set maximum loss limits
- Optimize trade execution:
- Implement partial position trading
- Add entry price optimization logic
Conclusion
This strategy constructs a relatively complete trading system by combining Bollinger Bands and RSI indicators. The strategy logic is clear, risk control is reasonable, and it has practical value. Through the suggested optimization directions, there is room for further improvement. In practical application, investors are advised to make appropriate adjustments based on their risk tolerance and market conditions.[/trans]
Source (PineScript)
/*backtest
start: 2024-07-15 00:00:00
end: 2025-02-18 08:00:00
period: 1h
basePeriod: 1h
exchanges: [{"eid":"Binance","currency":"BNB_USDT"}]
*/

//@version=5
strategy("Bollinger Bands + RSI Strategy", overlay=true)

// Bollinger Bands parameters
length = input.int(20, title="Bollinger Bands Length")
src = input(close, title="Source")
mult = input.float(2.0, title="Bollinger Bands Multiplier")

basis = ta.sma(src, length)
dev = mult * ta.stdev(src, length)
upper_band = basis + dev
lower_band = basis - dev

// RSI parameters
rsi_length = input.int(14, title="RSI Length")
rsi = ta.rsi(src, rsi_length)

// Plot Bollinger Bands
plot(upper_band, color=color.red, linewidth=2, title="Upper Bollinger Band")
plot(lower_band, color=color.green, linewidth=2, title="Lower Bollinger Band")
plot(basis, color=color.blue, linewidth=1, title="Middle Band")

// Buy Condition
buy_condition = ta.crossover(close, lower_band) and rsi < 30
if buy_condition
    strategy.entry("Buy", strategy.long)

// Sell Condition
sell_condition = ta.crossunder(close, upper_band) and rsi > 70
if sell_condition
    strategy.entry("Sell", strategy.short)

// Exit Conditions (optional: use the middle Bollinger Band for exits)
exit_condition = ta.cross(close, basis)
if exit_condition
    strategy.close("Buy")
    strategy.close("Sell")

// Optional: Plot RSI for additional insight
hline(70, "Overbought", color=color.red)
hline(30, "Oversold", color=color.green)
plot(rsi, color=color.purple, title="RSI", linewidth=1, offset=-5)
Detail
https://www.fmz.com/strategy/482887
Last Modified
2025-02-20 16:38:15