
8.5 KiB
Name
BMSB-Breakout-Strategy-BMSB-突破策略
Author
ChaoZhang
Strategy Description
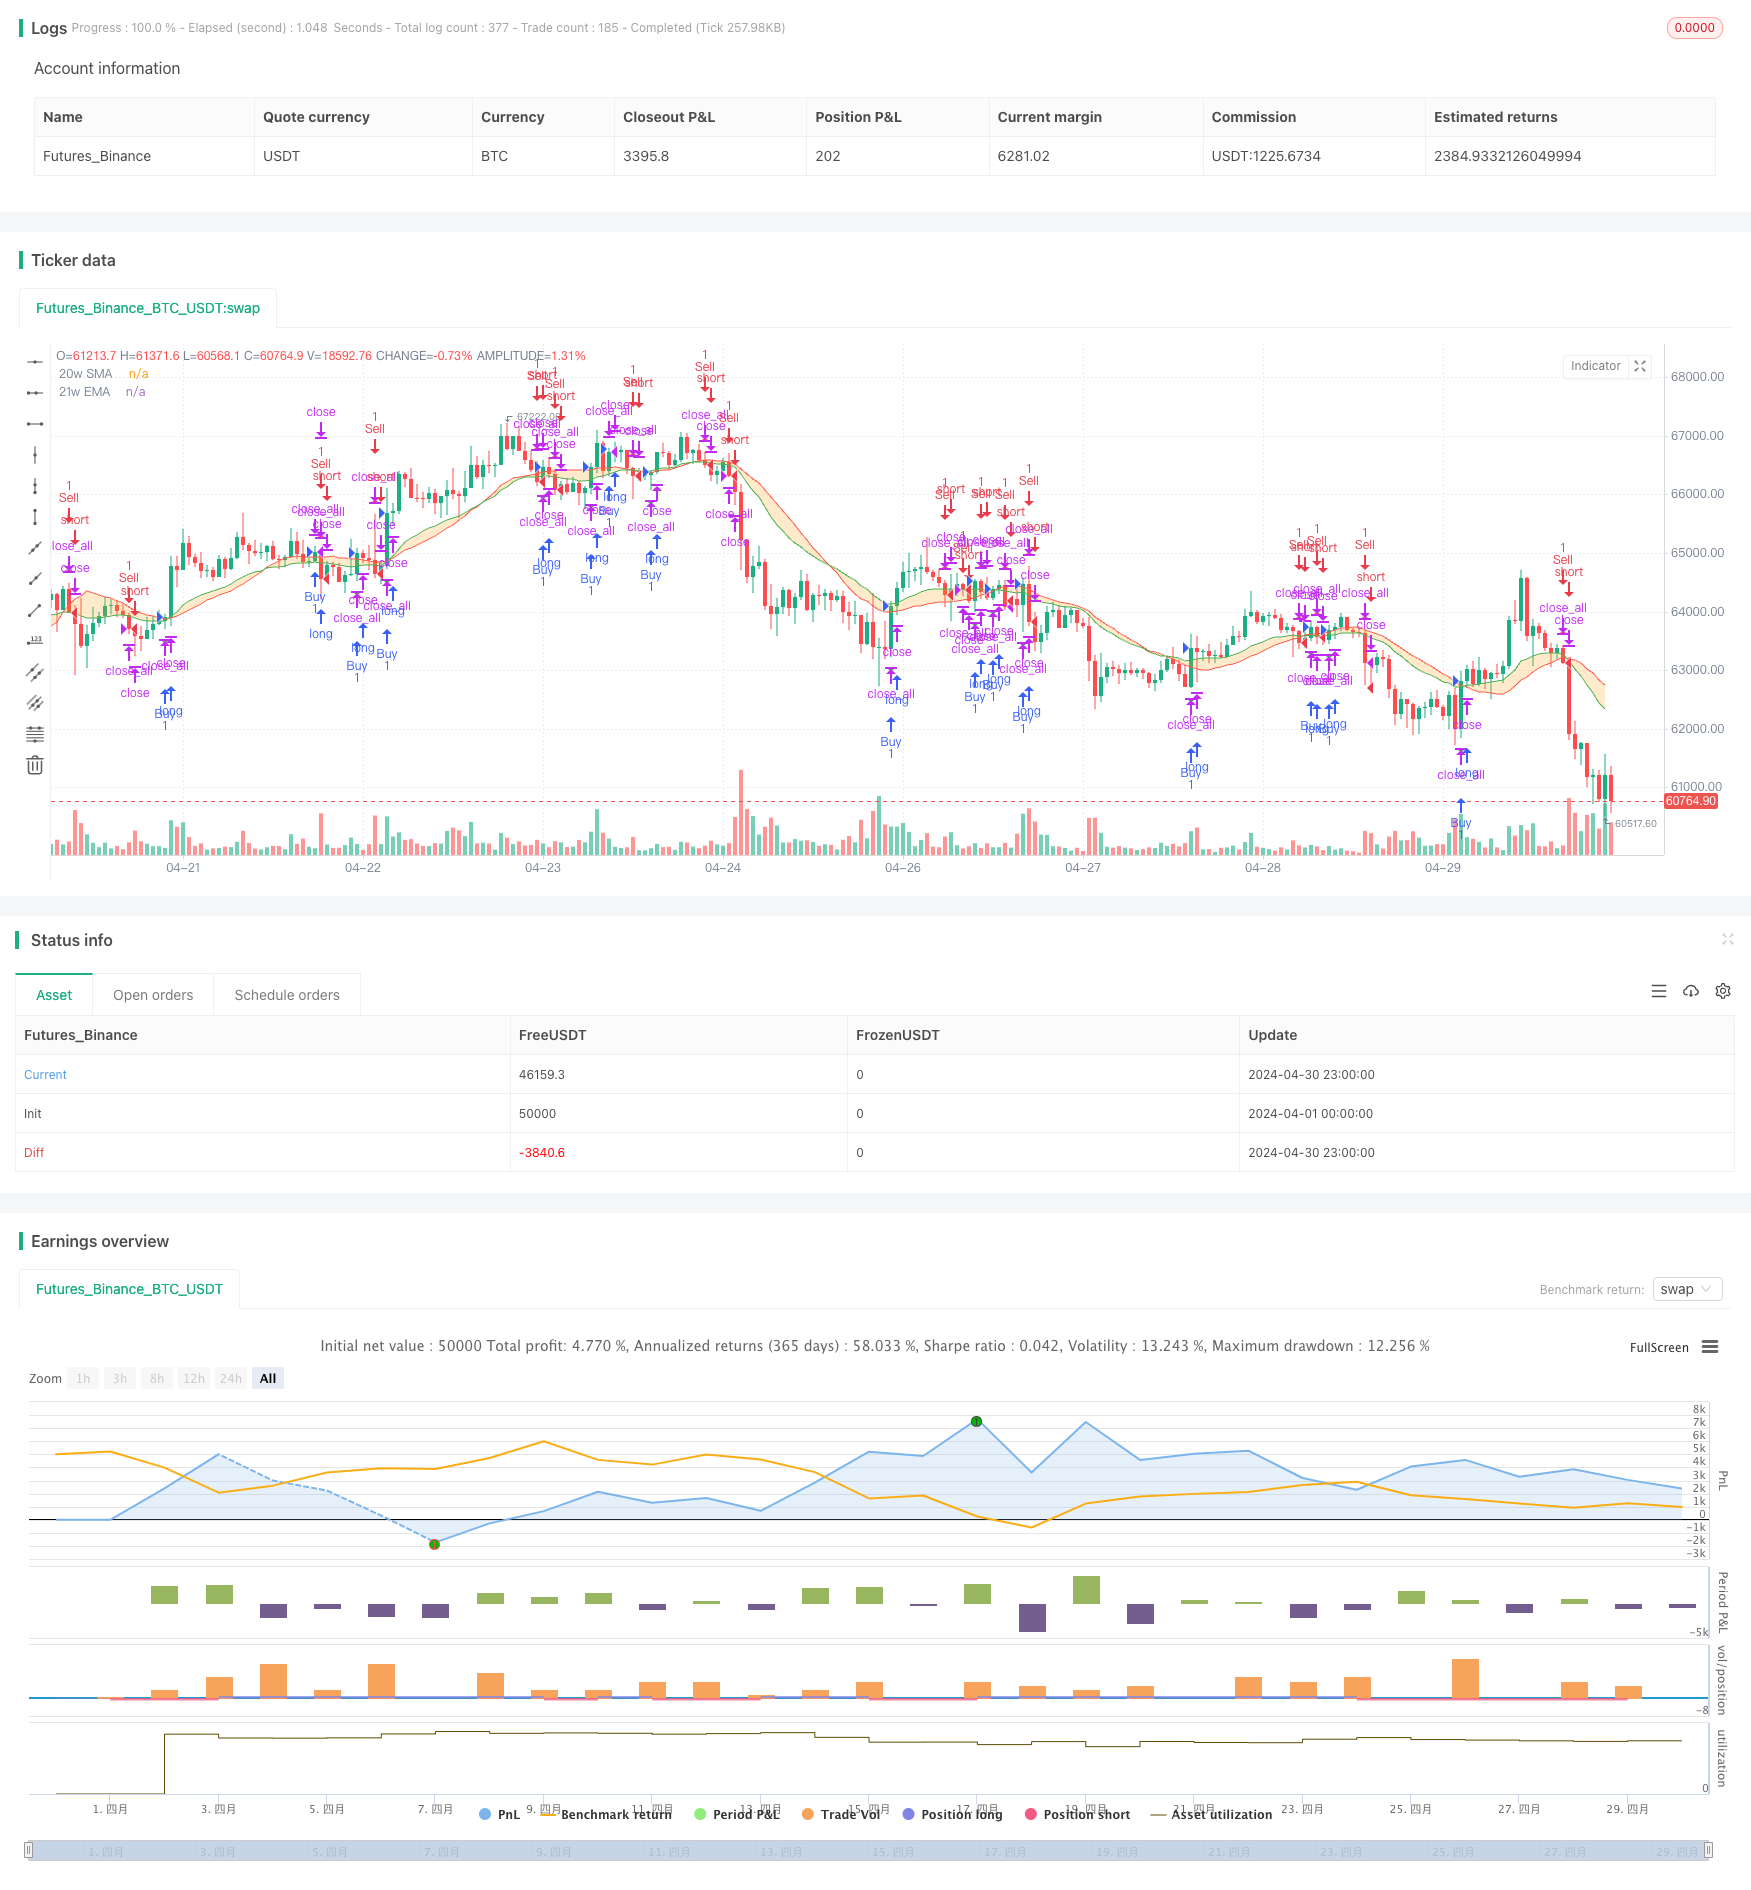
[trans]
概述
BMSB Breakout Strategy是一个基于移动平均线的突破策略。该策略使用20周期的简单移动平均线(SMA)和21周期的指数移动平均线(EMA)来确定市场的趋势方向。当收盘价上穿SMA时,策略会产生买入信号;当收盘价下穿EMA时,策略会产生卖出信号。该策略的主要思路是捕捉趋势的形成和反转,并在趋势方向上进行交易。
策略原理
该策略的核心是利用两条不同周期的移动平均线来判断市场趋势。20周期的SMA相对较慢,代表了市场的中长期趋势;21周期的EMA相对较快,代表了市场的短期趋势。当收盘价上穿SMA时,说明市场从中长期来看已经转为上升趋势,此时策略产生买入信号;当收盘价下穿EMA时,说明市场从短期来看已经转为下降趋势,此时策略产生卖出信号。通过这种方式,策略可以在趋势形成的早期阶段介入,并在趋势反转时及时退出。
优势分析
-
简单易懂:该策略使用的指标简单,原理清晰,易于理解和实现。
-
趋势跟踪:通过两条不同周期的移动平均线,策略可以有效地捕捉市场的趋势方向,在趋势形成时及时介入。
-
及时止损:当趋势反转时,策略可以通过下穿EMA的信号及时平仓,控制损失。
-
适应性强:该策略可以应用于不同的市场和品种,具有较好的适应性。
风险分析
-
振荡市:在市场震荡的情况下,该策略可能会产生较多的交易信号,导致频繁交易和较高的交易成本。
-
滞后性:由于移动平均线是滞后指标,策略的买入和卖出信号可能会有一定的延迟,错过最佳的交易时机。
-
参数优化:策略的表现会受到移动平均线周期选择的影响,不同的参数可能会导致不同的结果。
优化方向
-
参数优化:可以通过优化SMA和EMA的周期参数,寻找最佳的参数组合,提高策略的表现。
-
趋势过滤:在产生交易信号时,可以引入其他趋势指标或价格行为模式,对趋势的强度和持续性进行进一步确认,提高信号的可靠性。
-
风险控制:可以引入止损和止盈机制,控制单次交易的风险敞口;也可以通过仓位管理,根据市场波动性动态调整仓位大小,降低策略的整体风险。
-
多空择时:在产生买入和卖出信号时,可以结合其他择时指标或市场情绪指标,对多空双方的力量进行评估,选择更有优势的方向进行交易。
总结
BMSB Breakout Strategy是一个简单易用的趋势追踪策略,通过两条不同周期的移动平均线来判断市场趋势,在趋势形成时及时介入,在趋势反转时及时退出。该策略的优势在于简单易懂,适应性强,同时也存在震荡市下交易频繁,信号滞后等风险。通过参数优化,趋势过滤,风险控制和多空择时等方法,可以进一步提高该策略的表现和稳定性。
||
Overview
The BMSB Breakout Strategy is a moving average-based breakout strategy. It uses a 20-period Simple Moving Average (SMA) and a 21-period Exponential Moving Average (EMA) to determine the trend direction of the market. When the closing price crosses above the SMA, the strategy generates a buy signal; when the closing price crosses below the EMA, the strategy generates a sell signal. The main idea of this strategy is to capture the formation and reversal of trends and trade in the direction of the trend.
Strategy Principle
The core of this strategy is to use two moving averages with different periods to determine the market trend. The 20-period SMA is relatively slow and represents the medium to long-term trend of the market; the 21-period EMA is relatively fast and represents the short-term trend of the market. When the closing price crosses above the SMA, it indicates that the market has turned into an upward trend from a medium to long-term perspective, and the strategy generates a buy signal; when the closing price crosses below the EMA, it indicates that the market has turned into a downward trend from a short-term perspective, and the strategy generates a sell signal. In this way, the strategy can enter the market at an early stage of trend formation and exit in a timely manner when the trend reverses.
Advantage Analysis
-
Simple and easy to understand: The indicators used in this strategy are simple, the principle is clear, and it is easy to understand and implement.
-
Trend tracking: By using two moving averages with different periods, the strategy can effectively capture the trend direction of the market and enter in a timely manner when the trend is formed.
-
Timely stop-loss: When the trend reverses, the strategy can close positions in a timely manner through the signal of crossing below the EMA, controlling losses.
-
Strong adaptability: This strategy can be applied to different markets and varieties, and has good adaptability.
Risk Analysis
-
Oscillating market: In the case of market oscillation, this strategy may generate more trading signals, leading to frequent trades and higher transaction costs.
-
Lag: Since moving averages are lagging indicators, the buy and sell signals of the strategy may have a certain delay and miss the best trading opportunities.
-
Parameter optimization: The performance of the strategy will be affected by the choice of moving average periods, and different parameters may lead to different results.
Optimization Direction
-
Parameter optimization: By optimizing the period parameters of SMA and EMA, the best parameter combination can be found to improve the performance of the strategy.
-
Trend filtering: When generating trading signals, other trend indicators or price behavior patterns can be introduced to further confirm the strength and persistence of the trend, improving the reliability of the signals.
-
Risk control: Stop-loss and take-profit mechanisms can be introduced to control the risk exposure of a single transaction; position management can also be used to dynamically adjust the position size according to market volatility, reducing the overall risk of the strategy.
-
Long-short timing: When generating buy and sell signals, other timing indicators or market sentiment indicators can be combined to assess the strength of both long and short sides, and choose the more advantageous direction for trading.
Summary
The BMSB Breakout Strategy is a simple and easy-to-use trend tracking strategy that uses two moving averages with different periods to determine the market trend, entering the market in a timely manner when the trend is formed, and exiting in a timely manner when the trend reverses. The advantages of this strategy are simplicity, ease of understanding, and strong adaptability. At the same time, it also has risks such as frequent trading in oscillating markets and lagging signals. Through parameter optimization, trend filtering, risk control, and long-short timing, the performance and stability of this strategy can be further improved. [/trans]
Source (PineScript)
/*backtest
start: 2024-04-01 00:00:00
end: 2024-04-30 23:59:59
period: 1h
basePeriod: 15m
exchanges: [{"eid":"Futures_Binance","currency":"BTC_USDT"}]
*/

//@version=5
strategy("BMSB Breakout Strategy", overlay=true)

// Definición de la BMSB
smaLength = 20
emaLength = 21
source = close
sma = ta.sma(source, smaLength)
ema = ta.ema(source, emaLength)

outSma = request.security(syminfo.tickerid, timeframe.period, sma)
outEma = request.security(syminfo.tickerid, timeframe.period, ema)

smaPlot = plot(outSma, color=color.new(color.red, 0), title='20w SMA')
emaPlot = plot(outEma, color=color.new(color.green, 0), title='21w EMA')

fill(smaPlot, emaPlot, color=color.new(color.orange, 75), fillgaps=true)

// Señales de Compra y Venta
buySignal = ta.crossover(close, outSma)
sellSignal = ta.crossunder(close, outEma)

// Lógica de la Estrategia
if (buySignal)
    if (strategy.opentrades > 0)
        strategy.close_all()
    strategy.entry("Buy", strategy.long)

if (sellSignal)
    if (strategy.opentrades > 0)
        strategy.close_all()
    strategy.entry("Sell", strategy.short)

plotshape(series=buySignal, title="Compra", location=location.belowbar, color=color.green, style=shape.triangleup, size=size.small)
plotshape(series=sellSignal, title="Venta", location=location.abovebar, color=color.red, style=shape.triangledown, size=size.small)
Detail
https://www.fmz.com/strategy/451528
Last Modified
2024-05-15 16:40:40