
7.4 KiB
Name
BB均线突破策略-BB-Breakout-Strategy
Author
ChaoZhang
Strategy Description
[trans]
概述
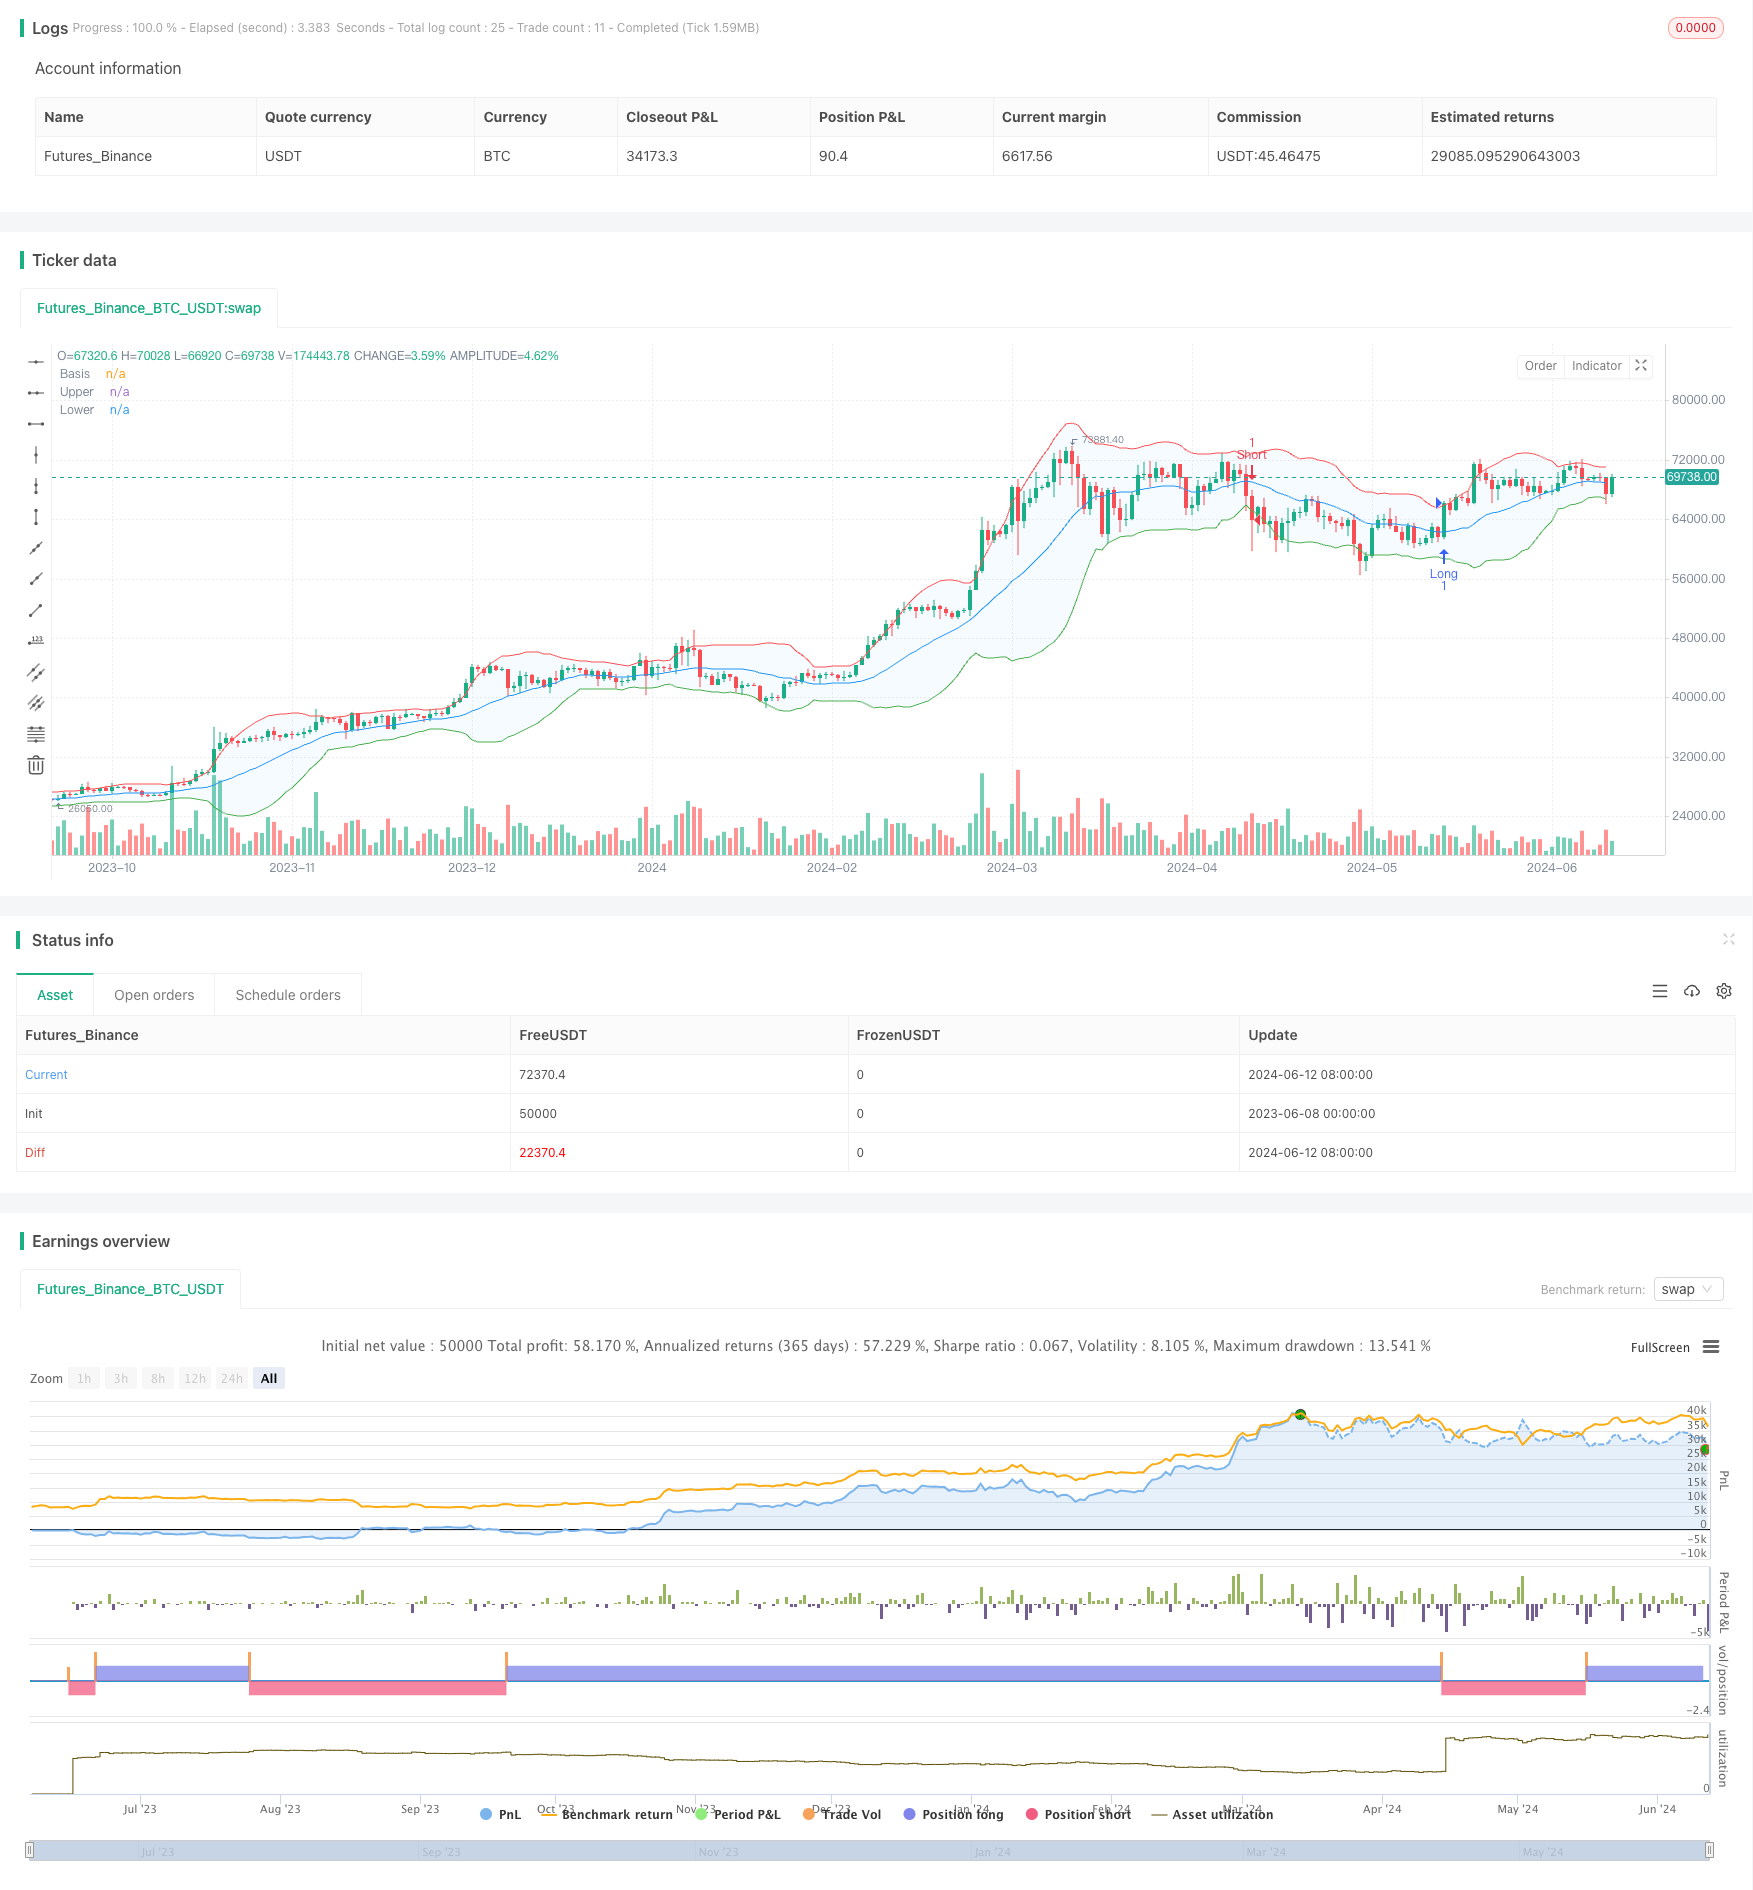
该策略基于布林带(Bollinger Bands)指标,通过价格突破布林带上下轨的方式产生交易信号。当价格突破上轨时做多,突破下轨时做空。同时,当持有多单时,如果价格跌破下轨则平多;持有空单时,如果价格突破上轨则平空。该策略旨在捕捉市场的波动性,在价格波动加剧时及时入场交易,并在价格反转时及时止损。
策略原理
- 计算指定周期的移动平均线作为布林带的中轨,可选择SMA、EMA、SMMA、WMA和VWMA等不同类型的移动平均线。
- 计算中轨加减一定倍数的标准差作为布林带的上下轨。
- 当价格突破上轨时产生做多信号,突破下轨时产生做空信号。
- 如果持有多单,当价格跌破下轨时平仓;如果持有空单,当价格突破上轨时平仓。
优势分析
- 布林带能够很好地量化市场的波动性,在价格波动加剧时提供明确的交易信号。
- 策略同时设置了止损条件,能够有效控制风险。
- 策略参数可调,可以根据不同品种和周期进行优化,具有一定的适应性和灵活性。
风险分析
- 在震荡市中,价格频繁突破布林带上下轨可能导致交易信号过于频繁,从而增加交易成本。
- 布林带具有一定的滞后性,在市场快速变化时,交易信号可能出现延迟。
- 布林带参数选择不当可能导致策略表现不佳,需要根据不同品种和周期进行优化。
优化方向
- 可以考虑引入趋势指标或者价格行为模式识别等方法,对交易信号进行二次确认,以减少假突破导致的亏损交易。
- 可以优化止损条件,例如根据ATR等指标设置动态止损,或者引入追踪止损等方法,以进一步控制风险。
- 可以通过遗传算法、网格搜索等方法对策略参数进行优化,寻找最优参数组合。
总结
BB均线突破策略是一个基于布林带指标的交易策略,通过捕捉价格突破布林带上下轨的机会进行交易。该策略优点是信号明确,易于实现,同时具有一定的风险控制措施。但是该策略也存在一些局限性,如交易频率可能过高,信号滞后等问题。因此在实际应用中,可以考虑从信号确认、止损优化、参数优化等方面对策略进行改进,以提高策略的稳定性和盈利能力。
||
Overview
This strategy is based on the Bollinger Bands indicator and generates trading signals when the price breaks through the upper or lower bands. It goes long when the price breaks above the upper band and goes short when the price breaks below the lower band. Additionally, if holding a long position, it closes the position when the price falls below the lower band; if holding a short position, it closes the position when the price breaks above the upper band. The strategy aims to capture market volatility, entering trades when price fluctuations intensify and exiting in a timely manner when prices reverse.
Strategy Principle
- Calculate the moving average of a specified period as the middle band of the Bollinger Bands. Various types of moving averages can be chosen, such as SMA, EMA, SMMA, WMA, and VWMA.
- Calculate the upper and lower bands by adding and subtracting a certain multiple of the standard deviation from the middle band.
- Generate a long signal when the price breaks above the upper band, and a short signal when it breaks below the lower band.
- If holding a long position, close the position when the price falls below the lower band; if holding a short position, close the position when the price breaks above the upper band.
Advantage Analysis
- Bollinger Bands can effectively quantify market volatility and provide clear trading signals when price fluctuations intensify.
- The strategy also includes stop-loss conditions, which can effectively control risks.
- The strategy parameters are adjustable and can be optimized for different instruments and time frames, providing a certain degree of adaptability and flexibility.
Risk Analysis
- In a choppy market, frequent price breakthroughs of the upper and lower Bollinger Bands may lead to excessive trading signals, thereby increasing transaction costs.
- Bollinger Bands have a certain lag, and trading signals may be delayed when the market changes rapidly.
- Improper selection of Bollinger Band parameters may result in poor strategy performance, requiring optimization based on different instruments and time frames.
Optimization Directions
- Consider introducing trend indicators or price behavior pattern recognition methods to further confirm trading signals and reduce losing trades caused by false breakthroughs.
- Optimize stop-loss conditions, such as setting dynamic stop-losses based on indicators like ATR or introducing trailing stop-losses to further control risks.
- Optimize strategy parameters using methods such as genetic algorithms or grid search to find the optimal parameter combination.
Summary
The BB Breakout Strategy is a trading strategy based on the Bollinger Bands indicator, seeking trading opportunities when prices break through the upper or lower bands. The strategy's advantages are clear signals and easy implementation, with certain risk control measures in place. However, the strategy also has some limitations, such as potentially high trading frequency and signal lag. Therefore, in practical applications, improvements can be considered in areas such as signal confirmation, stop-loss optimization, and parameter optimization to enhance the strategy's stability and profitability. [/trans]
Source (PineScript)
/*backtest
start: 2023-06-08 00:00:00
end: 2024-06-13 00:00:00
period: 1d
basePeriod: 1h
exchanges: [{"eid":"Futures_Binance","currency":"BTC_USDT"}]
*/

//@version=5
strategy("BB Strategy", overlay=true)

// Input parameters
length = input.int(20, minval=1, title="Length")
maType = input.string("SMA", "Basis MA Type", options=["SMA", "EMA", "SMMA (RMA)", "WMA", "VWMA"])
src = input(close, title="Source")
mult = input.float(2.0, minval=0.001, maxval=50, title="StdDev")
offset = input.int(0, "Offset", minval=-500, maxval=500, title="Offset")

// Moving average function
ma(source, length, _type) =>
    switch _type
        "SMA" => ta.sma(source, length)
        "EMA" => ta.ema(source, length)
        "SMMA (RMA)" => ta.rma(source, length)
        "WMA" => ta.wma(source, length)
        "VWMA" => ta.vwma(source, length)

// Calculate Bollinger Bands
basis = ma(src, length, maType)
dev = mult * ta.stdev(src, length)
upper = basis + dev
lower = basis - dev

// Plot Bollinger Bands
plot(basis, "Basis", color=color.blue, offset=offset)
p1 = plot(upper, "Upper", color=color.red, offset=offset)
p2 = plot(lower, "Lower", color=color.green, offset=offset)
fill(p1, p2, title="Background", color=color.rgb(33, 150, 243, 95))

// Strategy logic
longCondition = ta.crossover(close, upper)
shortCondition = ta.crossunder(close, lower)

// Strategy entries and exits
if (longCondition)
    strategy.entry("Long", strategy.long)
if (shortCondition)
    strategy.entry("Short", strategy.short)
if (shortCondition and strategy.position_size > 0)
    strategy.close("Long")
if (longCondition and strategy.position_size < 0)
    strategy.close("Short")
Detail
https://www.fmz.com/strategy/454141
Last Modified
2024-06-14 15:21:03