
15 KiB
Name
相对强弱指标RSI超买超卖量化交易策略-Relative-Strength-Index-RSI-Overbought-Oversold-Quantitative-Trading-Strategy
Author
ianzeng123
Strategy Description
[trans]
概述
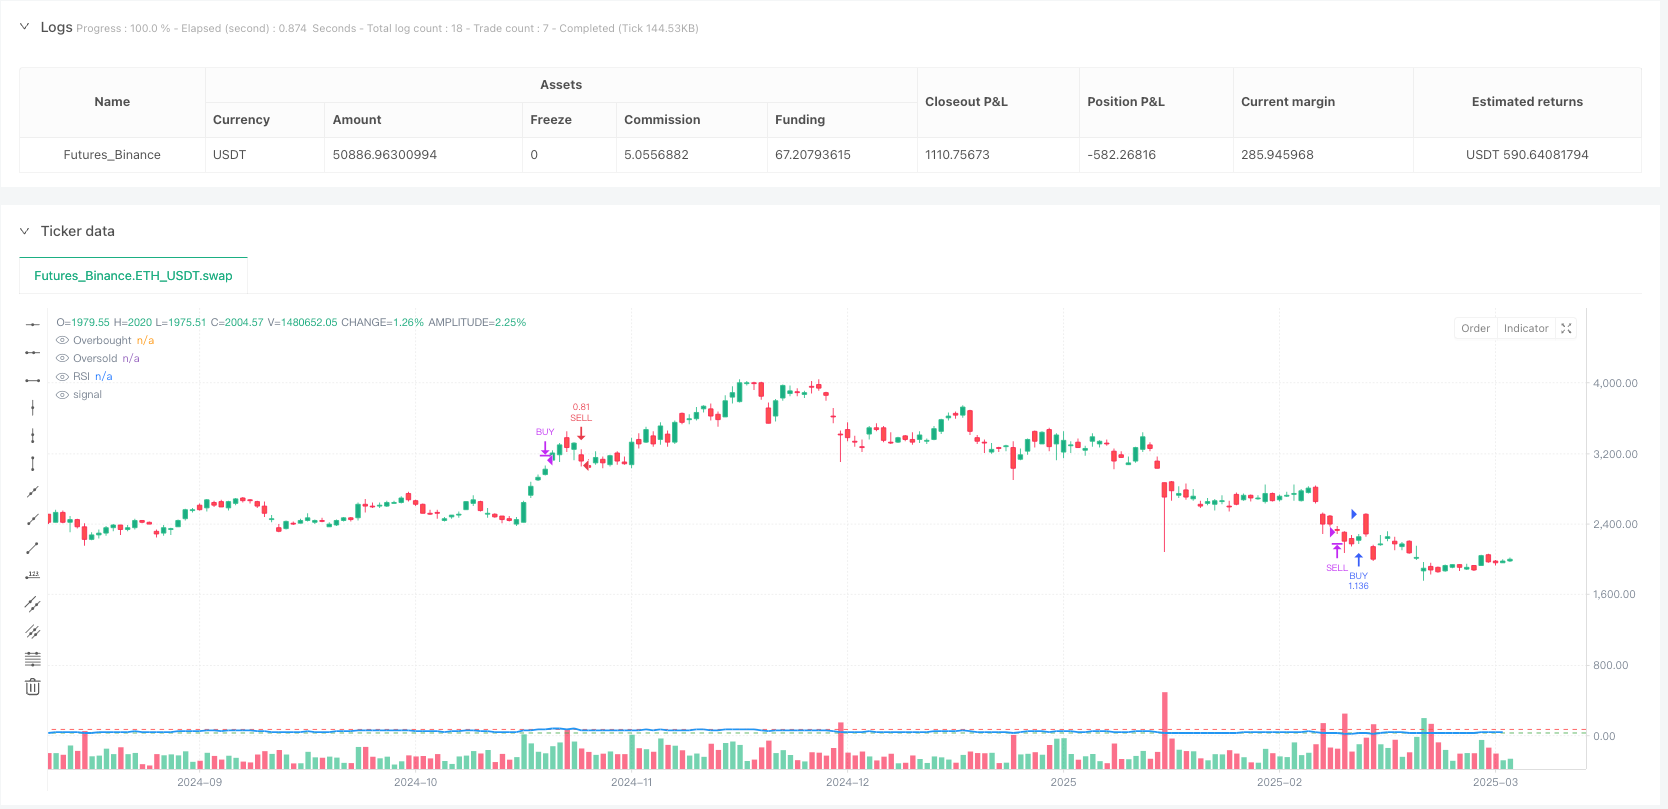
相对强弱指标(RSI)超买超卖量化交易策略是一种基于技术分析中RSI指标的自动化交易系统。该策略核心思想是识别市场中的超买和超卖状态,并在RSI指标穿越特定阈值时执行交易。当RSI从下方穿越30(超卖区域)时买入,当RSI从上方穿越70(超买区域)时卖出。本策略设计用于MetaTrader平台,通过Pine Connector实现自动交易功能,特别适用于比特币等波动较大的加密货币市场。
策略原理
这个策略基于RSI(相对强弱指标)这一经典技术指标工作。RSI是一种动量震荡指标,用于测量价格变化的速度和变化的幅度。RSI的取值范围在0到100之间,通常认为:
- RSI值低于30表示市场处于超卖状态,可能即将反弹
- RSI值高于70表示市场处于超买状态,可能即将回落
策略的交易逻辑如下:
- 买入信号:当RSI从30以下上穿30时(ta.crossover(rsi, 30))
- 卖出信号:当RSI从70以上下穿70时(ta.crossunder(rsi, 70))
- 平多信号:当RSI上穿70时(ta.crossover(rsi, 70))
- 平空信号:当RSI下穿30时(ta.crossunder(rsi, 30))
该策略使用标准的14周期RSI,基于收盘价计算。策略在TradingView平台上实现,并配置了与MetaTrader的连接功能,允许用户通过输入许可证ID来实现自动交易。交易风险通过固定手数(Lots)参数进行控制。
策略优势
- 简单易懂:策略基于广泛使用的RSI指标,逻辑清晰,容易理解和实施。
- 逆势交易特性:该策略本质上是一种逆势交易策略,在市场超买超卖时寻找反转机会,有助于在波动市场中抓住反转点。
- 自动化执行:通过Pine Connector与MetaTrader集成,支持全自动交易,减少人为干预和情绪因素。
- 可视化支持:策略包含RSI图表绘制和超买超卖线的视觉标记,便于交易者直观监控市场状态。
- 灵活的风险控制:通过可调整的手数参数,允许用户根据自身风险承受能力调整仓位大小。
- 警报功能完善:针对所有交易信号(开仓和平仓)设置了警报条件,确保交易者不会错过重要信号。
- 适用多种市场:虽然代码注释中提到在BTC 1M周期表现良好,但理论上该策略可应用于任何有流动性的市场。
策略风险
- 震荡市场风险:在横盘震荡市场中,RSI可能频繁穿越超买超卖区域,导致过度交易和佣金侵蚀。
- 趋势市场风险:在强趋势市场中,RSI可能长时间维持在超买或超卖区域,导致过早平仓或错过大幅趋势。
- 假突破风险:RSI可能出现假突破,即短暂穿越阈值后立即回撤,触发不必要的交易。
- 参数敏感性:默认的RSI参数(14周期,30/70阈值)可能不适用于所有市场和时间周期,需要针对具体情况优化。
- 缺乏止损机制:当前策略没有内置止损机制,在极端行情下可能面临较大亏损。
- 单一指标依赖:仅依赖RSI一个指标进行决策,缺乏多维度分析,增加了错误信号的可能性。
解决方法:
- 引入附加过滤条件,如趋势指标或成交量确认
- 添加止损止盈机制以控制单笔交易风险
- 根据不同市场和时间周期优化RSI参数
- 降低资金管理比例,建议不超过账户资金的5%
策略优化方向
-
多指标融合:结合其他技术指标如移动平均线、MACD或布林带,构建更加全面的入场条件,减少假信号。例如,只在价格位于长期移动平均线上方时考虑做多信号。
-
动态阈值调整:将固定的30/70阈值改为动态阈值,根据市场波动性自动调整。在低波动市场可以使用更窄的阈值范围(如40/60),在高波动市场使用更宽的范围(如20/80)。
-
时间过滤器:添加时间过滤条件,避开波动性较低的时段或已知的重大新闻发布时间,提高信号质量。
-
资金管理优化:替换固定手数为基于账户资金比例的动态仓位大小,或基于ATR的仓位计算方法,更好地管理风险。
-
止损止盈机制:增加基于价格或百分比的止损止盈机制,避免单笔交易损失过大或错过利润兑现机会。
-
趋势过滤:添加趋势识别功能,在顺势方向上接RSI信号,逆势方向上忽略或提高信号门槛。
-
优化RSI周期:针对不同交易品种和时间框架测试不同的RSI计算周期,找到最佳参数组合。
这些优化方向主要目的是提高信号质量,减少假信号,并加强资金管理和风险控制,使策略在不同市场环境下都能保持稳定性。
总结
相对强弱指标(RSI)超买超卖量化交易策略是一个基于经典技术分析原理的自动化交易系统。策略利用RSI指标识别市场可能的反转点,在超卖区域寻找做多机会,在超买区域寻找做空机会。虽然策略逻辑简单清晰,但其有效性在很大程度上取决于市场环境和参数优化。
该策略最适合在波动性较大但有一定范围的市场中应用,如加密货币市场。投资者在使用此策略时应注意市场环境适配性,并考虑引入额外的过滤条件和风险管理机制。通过合理优化和扩展,这一基础策略可以发展成为一个更加稳健的交易系统。
作为入门级的技术分析策略,RSI超买超卖策略提供了理解和应用量化交易基本原理的良好起点。然而,投资者不应过度依赖单一指标或任何自动化策略,而应结合更广泛的市场分析和健全的风险管理原则,构建全面的交易方法。 ||
Overview
The Relative Strength Index (RSI) Overbought Oversold Quantitative Trading Strategy is an automated trading system based on the RSI technical indicator. The core concept of this strategy is to identify overbought and oversold market conditions and execute trades when the RSI crosses specific threshold values. It generates buy signals when RSI crosses above 30 (oversold zone) and sell signals when RSI crosses below 70 (overbought zone). The strategy is designed for the MetaTrader platform with automatic execution through Pine Connector, particularly suitable for volatile markets like Bitcoin.
Strategy Principles
This strategy operates based on the RSI (Relative Strength Index), a classic technical indicator. RSI is a momentum oscillator that measures the speed and magnitude of price changes. RSI values range between 0 and 100, with conventional interpretations being:
- RSI below 30 indicates an oversold market condition, suggesting a potential rebound
- RSI above 70 indicates an overbought market condition, suggesting a potential decline
The trading logic is as follows:
- Buy signal: When RSI crosses above 30 (ta.crossover(rsi, 30))
- Sell signal: When RSI crosses below 70 (ta.crossunder(rsi, 70))
- Close long position: When RSI crosses above 70 (ta.crossover(rsi, 70))
- Close short position: When RSI crosses below 30 (ta.crossunder(rsi, 30))
The strategy uses the standard 14-period RSI calculated on closing prices. It is implemented on the TradingView platform with MetaTrader integration functionality, allowing users to enable automated trading by entering a license ID. Trade risk is controlled through a fixed lot size parameter.
Strategy Advantages
- Simplicity: The strategy is based on the widely-used RSI indicator with clear logic that is easy to understand and implement.
- Mean Reversion Characteristics: This is essentially a counter-trend strategy that seeks reversal opportunities during market extremes, helping capture turning points in volatile markets.
- Automated Execution: Integration with MetaTrader through Pine Connector supports fully automated trading, reducing manual intervention and emotional factors.
- Visual Support: The strategy includes RSI chart plotting and visual marking of overbought/oversold lines for intuitive market monitoring.
- Flexible Risk Control: Through adjustable lot size parameters, users can modify position sizes according to their risk tolerance.
- Comprehensive Alert System: Alert conditions are set for all trading signals (entries and exits), ensuring traders don't miss important signals.
- Multi-Market Application: While the code comments mention good performance on BTC 1M timeframe, theoretically, the strategy can be applied to any liquid market.
Strategy Risks
- Ranging Market Risk: In sideways, choppy markets, RSI may frequently cross overbought and oversold zones, leading to overtrading and commission erosion.
- Trending Market Risk: In strong trend markets, RSI may remain in overbought or oversold territories for extended periods, causing premature exits or missed significant trends.
- False Breakout Risk: RSI may exhibit false breakouts, briefly crossing thresholds before immediately reversing, triggering unnecessary trades.
- Parameter Sensitivity: The default RSI parameters (14 periods, 30/70 thresholds) may not be suitable for all markets and timeframes, requiring optimization for specific situations.
- Lack of Stop-Loss Mechanism: The current strategy has no built-in stop-loss mechanism, potentially facing significant losses in extreme market conditions.
- Single Indicator Dependency: Relying solely on the RSI indicator for decision-making lacks multi-dimensional analysis, increasing the possibility of false signals.
Solutions:
- Introduce additional filtering conditions like trend indicators or volume confirmation
- Add stop-loss and take-profit mechanisms to control single trade risk
- Optimize RSI parameters for different markets and timeframes
- Reduce position sizing, recommended not to exceed 5% of account capital
Strategy Optimization Directions
-
Multi-Indicator Integration: Combine with other technical indicators such as moving averages, MACD, or Bollinger Bands to build more comprehensive entry conditions and reduce false signals. For example, only consider long signals when price is above a long-term moving average.
-
Dynamic Threshold Adjustment: Replace fixed 30/70 thresholds with dynamic thresholds that automatically adjust based on market volatility. Use narrower threshold ranges (like 40/60) in low-volatility markets and wider ranges (like 20/80) in high-volatility markets.
-
Time Filters: Add time filtering conditions to avoid low-volatility periods or known major news release times, improving signal quality.
-
Money Management Optimization: Replace fixed lot sizes with dynamic position sizing based on account equity percentage or ATR-based position calculation methods for better risk management.
-
Stop-Loss and Take-Profit Mechanisms: Add price-based or percentage-based stop-loss and take-profit mechanisms to avoid excessive losses on individual trades or missing profit-taking opportunities.
-
Trend Filtering: Add trend identification functionality to accept RSI signals in trend direction while ignoring or raising thresholds for counter-trend signals.
-
RSI Period Optimization: Test different RSI calculation periods for various trading instruments and timeframes to find optimal parameter combinations.
These optimization directions primarily aim to improve signal quality, reduce false signals, and strengthen money management and risk control, enabling the strategy to maintain stability across different market environments.
Summary
The Relative Strength Index (RSI) Overbought Oversold Quantitative Trading Strategy is an automated trading system based on classic technical analysis principles. The strategy uses the RSI indicator to identify potential market reversal points, seeking long opportunities in oversold areas and short opportunities in overbought areas. While the strategy logic is simple and clear, its effectiveness largely depends on market environment and parameter optimization.
This strategy is best suited for markets with significant volatility but within certain ranges, such as cryptocurrency markets. Investors using this strategy should pay attention to market environment compatibility and consider introducing additional filtering conditions and risk management mechanisms. Through reasonable optimization and extension, this basic strategy can be developed into a more robust trading system.
As an entry-level technical analysis strategy, the RSI Overbought Oversold Strategy provides a good starting point for understanding and applying the basic principles of quantitative trading. However, investors should not overly rely on a single indicator or any automated strategy, but rather combine it with broader market analysis and sound risk management principles to build a comprehensive trading approach.[/trans]
Source (PineScript)
/*backtest
start: 2024-03-25 00:00:00
end: 2025-03-24 00:00:00
period: 1d
basePeriod: 1d
exchanges: [{"eid":"Futures_Binance","currency":"ETH_USDT"}]
*/

// Risk Settings
pc_id = input.string(title='License ID', defval='', group='MT4/5 Settings', tooltip='This is your license ID')
pc_risk = input.float(title='Lots', defval=0.1, step=0.1, minval=0, group='MT4/5 Settings', tooltip='Lot Size')
pc_prefix = input.string(title='MetaTrader Symbol', defval='', group='MT4/5 Settings', tooltip='This is your broker\'s MetaTrader symbol')

// Symbol Information
var symbol = pc_prefix

// Alerts for MetaTrader Integration
longa = pc_id + ',buy,' + symbol + ',risk=' + str.tostring(pc_risk, '#.##')
shorta = pc_id + ',sell,' + symbol + ',risk=' + str.tostring(pc_risk, '#.##')
longa_close = pc_id + ',closelong,' + symbol + ''
shorta_close = pc_id + ',closeshort,' + symbol + ''
//@version=6
strategy("RSI Overbought/Oversold Strategy", overlay=true, default_qty_type=strategy.percent_of_equity, default_qty_value=5)

// ? RSI Settings
rsiLength = 14
rsiSource = close
rsi = ta.rsi(rsiSource, rsiLength)

// ? Entry Conditions
longEntry = ta.crossover(rsi, 30)   // Buy when RSI crosses above 30
shortEntry = ta.crossunder(rsi, 70) // Sell when RSI crosses below 70

// ? Exit Conditions
longExit = ta.crossover(rsi, 70)  // Close long when RSI hits 70
shortExit = ta.crossunder(rsi, 30) // Close short when RSI hits 30

// ✅ Execute Trades
if (longEntry)
    strategy.entry("BUY", strategy.long)
if (longExit)
    strategy.close("BUY")

if (shortEntry)
    strategy.entry("SELL", strategy.short)
if (shortExit)
    strategy.close("SELL")

// ? Visuals for Better Clarity
plot(rsi, title="RSI", color=color.blue, linewidth=2)
hline(70, "Overbought", color=color.red)
hline(30, "Oversold", color=color.green)

// ? Alerts for Entry/Exit
alertcondition(longEntry, title="BUY Signal", message="RSI crossed above 30 - Buy!")
alertcondition(longExit, title="SELL Exit", message="RSI reached 70 - Close Buy!")
alertcondition(shortEntry, title="SELL Signal", message="RSI crossed below 70 - Sell!")
alertcondition(shortExit, title="BUY Exit", message="RSI reached 30 - Close Sell!")
Detail
https://www.fmz.com/strategy/488143
Last Modified
2025-03-25 14:22:06