
8.1 KiB
Name
现代拉盖尔变换相对强弱指标优化策略-Modern-Laguerre-Transform-Relative-Strength-Index-Optimization-Strategy
Author
ChaoZhang
Strategy Description
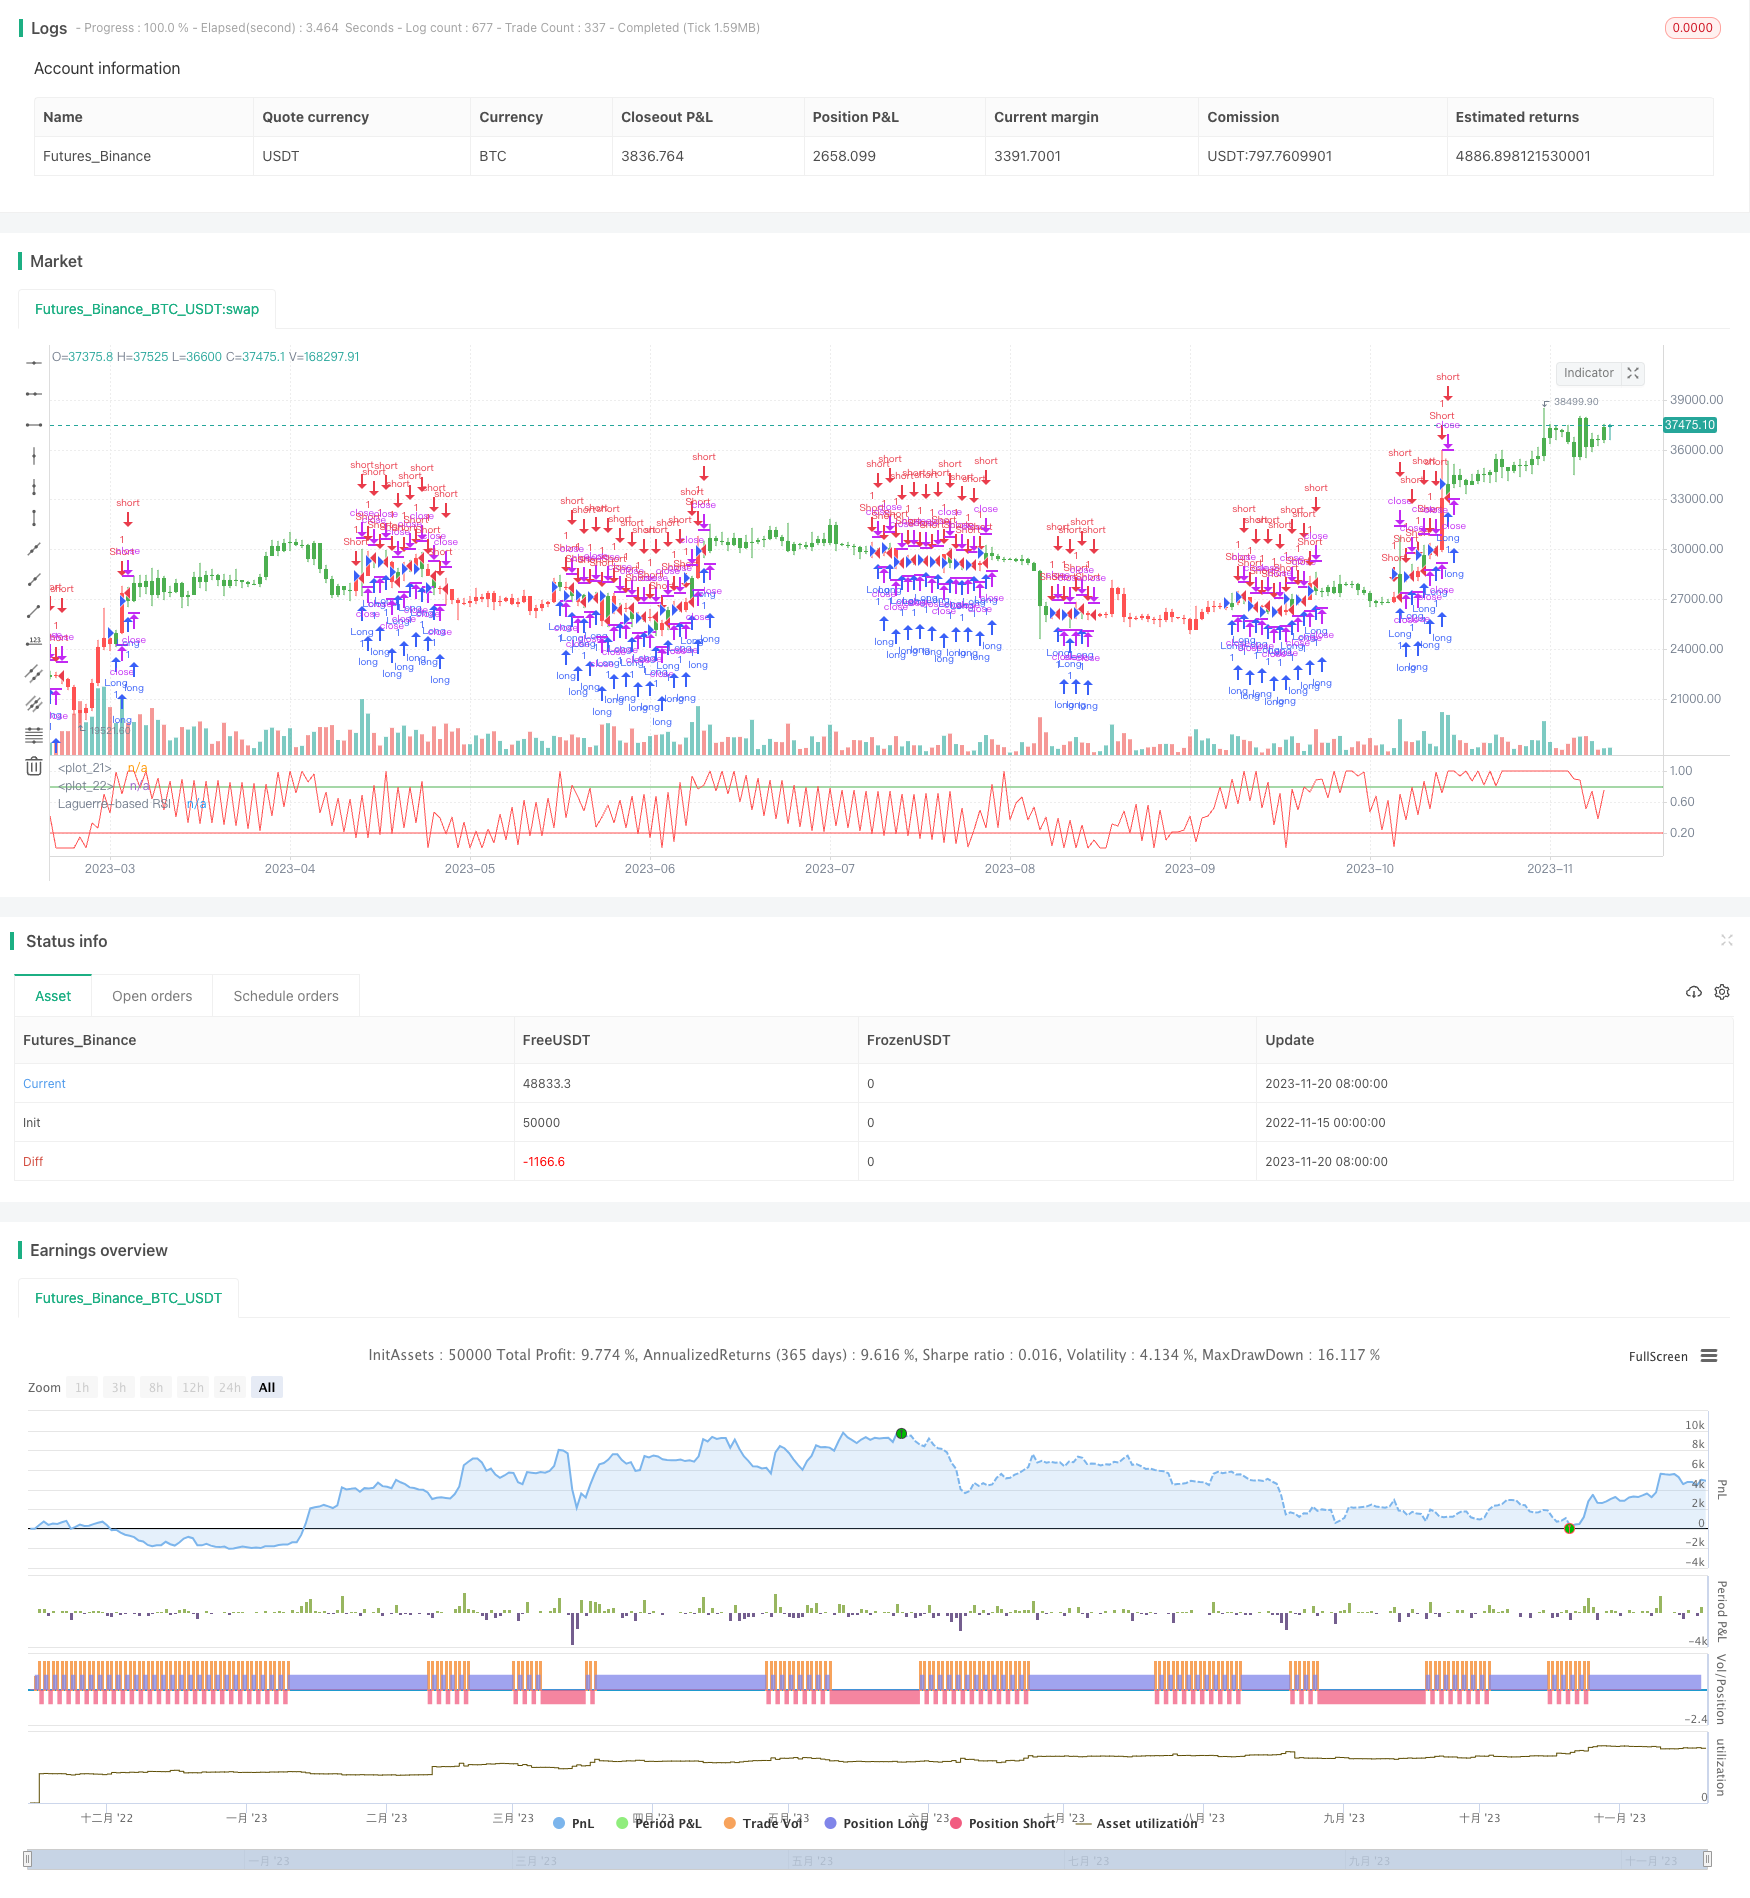 [trans]
策略名称:
概述
本文将深入探讨基于拉盖尔变换的相对强弱指标(RSI)优化策略。这种策略利用先进的数学工具——拉盖尔变换——来增强RSI指标的灵敏度,使其更快速地响应市场价格变动。
策略原理
拉盖尔变换RSI指标通过使用拉盖尔滤波器,可以在较短的数据长度上创建高效的指标。该策略的核心是利用拉盖尔变换对价格序列进行处理,从而得到四个级别的拉盖尔线(xL0, xL1, xL2, xL3)。这些线条根据给定的参数gamma进行计算,用于分析市场趋势。
策略使用CU(累积上升值)和CD(累积下降值)来确定市场的强弱。CU和CD的计算基于拉盖尔线的相对位置。这个方法使得RSI值能够更快地反映价格变动,从而为交易者提供及时的交易信号。
交易信号是根据RSI值与用户定义的买入和卖出界限(BuyBand和SellBand)相比较来生成的。当RSI值高于买入界限时,策略建议做多;当RSI值低于卖出界限时,策略建议做空。
优势分析
- 响应速度快: 使用拉盖尔变换,该策略能够在较短的数据长度内快速响应市场的变化。
- 灵活性: 策略允许用户根据自己的需求调整
gamma、买入界限和卖出界限。 - 适应性强: 能够适应不同市场条件,对短期和中期的价格变动反应灵敏。
风险分析
- 市场波动: 在高波动性市场中,指标可能产生误导性信号。
- 参数选择: 错误的参数设定可能导致不准确的交易信号。
- 过度交易: 由于指标的高敏感性,可能导致频繁交易和高交易成本。
优化方向
- 参数优化: 进行大量历史数据测试,找到最优的
gamma值和买卖界限。 - 结合其他指标: 与其他技术分析工具结合使用,以减少误导性信号。
- 适应性增强: 开发动态调整参数的机制,以适应不同的市场环境。
总结
综合来看,基于拉盖尔变换的RSI优化策略是一个创新和高效的交易工具。它的主要优势在于快速响应市场变化和参数的高度可定制性。然而,就像任何交易策略一样,它也存在风险,特别是在高波动性的市场环境中。为了最大化这一策略的效果,交易者应该结合其他技术分析工具和进行仔细的参数调整。总体而言,这一策略为寻求短期和中期市场机会的交易者提供了一个有价值的工具。
||
Overview
This article delves into the optimized strategy of the Relative Strength Index (RSI) based on the Laguerre Transform. Utilizing the advanced mathematical tool - the Laguerre Transform - this strategy enhances the sensitivity of the RSI indicator, allowing it to respond more rapidly to market price movements.
Strategy Principle
The Laguerre Transform RSI indicator, through the use of the Laguerre filter, creates effective indicators even over short data lengths. The crux of the strategy lies in processing the price series with the Laguerre Transform, resulting in four levels of Laguerre lines (xL0, xL1, xL2, xL3). These lines are calculated based on a given gamma parameter, which is used to analyze market trends.
The strategy employs CU (cumulative up) and CD (cumulative down) values to ascertain market strength. The calculation of CU and CD is based on the relative positions of the Laguerre lines. This method enables the RSI value to reflect price changes more promptly, thus providing traders with timely trading signals.
Trading signals are generated by comparing the RSI value with user-defined buy and sell thresholds (BuyBand and SellBand). The strategy suggests going long when the RSI is above the buy threshold and short when it is below the sell threshold.
Advantages Analysis
- Rapid Response: The use of the Laguerre Transform enables the strategy to respond quickly to market changes over short data lengths.
- Flexibility: The strategy allows users to adjust
gamma, buy, and sell thresholds according to their preferences. - Strong Adaptability: It adapts well to different market conditions and is sensitive to short- and medium-term price movements.
Risk Analysis
- Market Volatility: In highly volatile markets, the indicator might produce misleading signals.
- Parameter Selection: Incorrect parameter settings can lead to inaccurate trading signals.
- Overtrading: Due to the high sensitivity of the indicator, it might lead to frequent trading and high transaction costs.
Optimization Direction
- Parameter Optimization: Conduct extensive historical data testing to find the optimal
gammavalue and buying/selling thresholds. - Combining with Other Indicators: Use in conjunction with other technical analysis tools to reduce misleading signals.
- Enhanced Adaptability: Develop mechanisms for dynamic adjustment of parameters to adapt to different market conditions.
Conclusion
Overall, the RSI optimization strategy based
on the Laguerre Transform is an innovative and efficient trading tool. Its main advantages lie in its rapid response to market changes and the high customizability of its parameters. However, like any trading strategy, it also has its risks, especially in highly volatile market environments. To maximize the effectiveness of this strategy, traders should combine it with other technical analysis tools and make careful parameter adjustments. In summary, this strategy provides a valuable tool for traders seeking short-term and medium-term market opportunities. [/trans]
Strategy Arguments
| Argument | Default | Description |
|---|---|---|
| v_input_1 | 0.5 | gamma |
| v_input_2 | 0.8 | BuyBand |
| v_input_3 | 0.2 | SellBand |
| v_input_4 | false | Trade reverse |
Source (PineScript)
/*backtest
start: 2022-11-15 00:00:00
end: 2023-11-21 00:00:00
period: 1d
basePeriod: 1h
exchanges: [{"eid":"Futures_Binance","currency":"BTC_USDT"}]
*/

//@version=2
////////////////////////////////////////////////////////////
//  Copyright by HPotter v1.0 01/09/2017
// This is RSI indicator which is more sesitive to price changes.
// It is based upon a modern math tool - Laguerre transform filter.
// With help of Laguerre filter one becomes able to create superior
// indicators using very short data lengths as well. The use of shorter
// data lengths means you can make the indicators more responsive to
// changes in the price.
//
// You can change long to short in the Input Settings
// WARNING:
//  - For purpose educate only
//  - This script to change bars colors.
////////////////////////////////////////////////////////////
strategy(title="Laguerre-based RSI", shorttitle="Laguerre-RSI")
gamma = input(0.5, minval=-0.1, maxval = 0.9)
BuyBand = input(0.8, step = 0.01)
SellBand = input(0.2, step = 0.01)
reverse = input(false, title="Trade reverse")
hline(BuyBand, color=green, linestyle=line)
hline(SellBand, color=red, linestyle=line)
xL0 = (1-gamma) * close + gamma * nz(xL0[1], 1)
xL1 = - gamma * xL0 + nz(xL0[1], 1) + gamma * nz(xL1[1], 1)
xL2 = - gamma * xL1 + nz(xL1[1], 1) + gamma * nz(xL2[1], 1)
xL3 = - gamma * xL2 + nz(xL2[1], 1) + gamma * nz(xL3[1], 1)
CU = (xL0 >= xL1 ? xL0 - xL1 : 0) + (xL1 >= xL2 ? xL1 - xL2 : 0)  + (xL2 >= xL3 ? xL2 - xL3 : 0)
CD = (xL0 >= xL1 ? 0 : xL1 - xL0) + (xL1 >= xL2 ? 0 : xL2 - xL1)  + (xL2 >= xL3 ? 0 : xL3 - xL2)
nRes = iff(CU + CD != 0, CU / (CU + CD), 0)
pos = iff(nRes > BuyBand, 1,
	   iff(nRes < SellBand, -1, nz(pos[1], 0)))
possig = iff(reverse and pos == 1, -1,
          iff(reverse and pos == -1, 1, pos))
if (possig == 1)
    strategy.entry("Long", strategy.long)
if (possig == -1)
    strategy.entry("Short", strategy.short)
barcolor(possig == -1 ? red: possig == 1 ? green : blue )
plot(nRes, color=red, title="Laguerre-based RSI")
Detail
https://www.fmz.com/strategy/432920
Last Modified
2023-11-22 17:38:16