
12 KiB
Name
海龟交易RSI指标短线策略RSI-Oscillator-Turtle-Trading-Short-term-Strategy
Author
ChaoZhang
Strategy Description
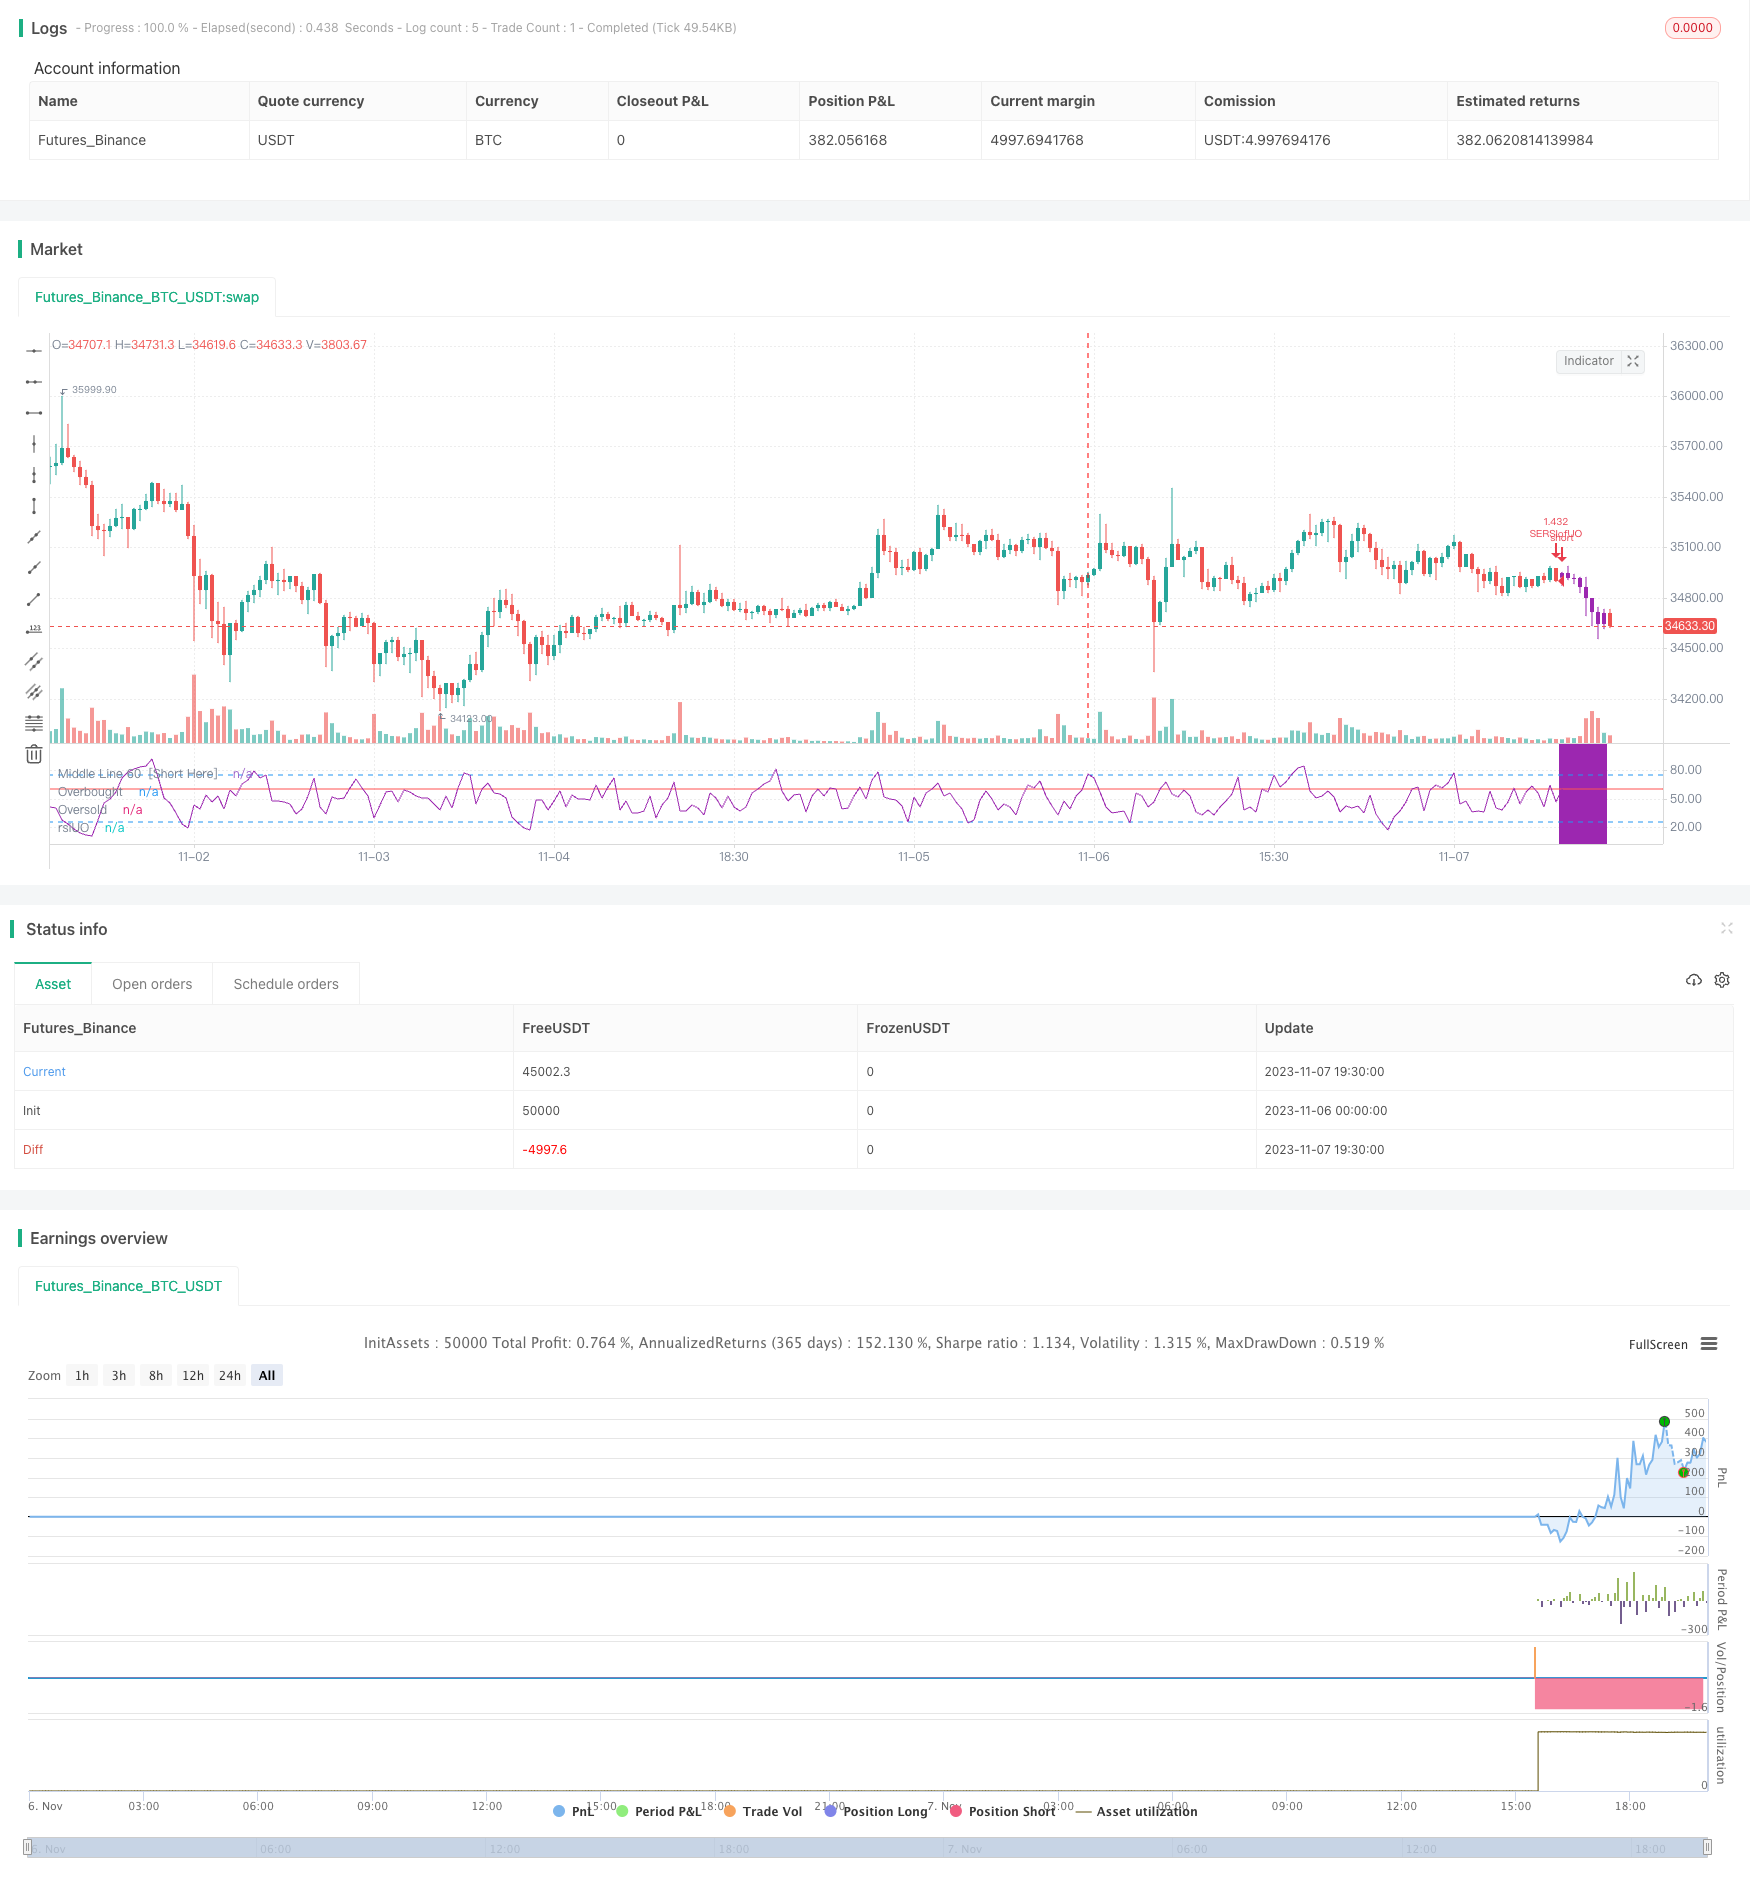 [trans]
概述
该策略是一种利用RSI指标进行短线交易的策略。它结合RSI指标和威廉姆斯鳄鱼指标,在RSI指标进入超买或超卖区域时进行反向交易,属于较为保守的短线交易策略。
策略原理
该策略主要基于以下几点原理:
-
使用海龟交易法则,只在市场明显反转时才入场,采取较保守的交易方式。
-
使用RSI指标判断市场超买超卖现象。当RSI指标线进入超买区(默认为60分界线以上)或超卖区(默认为40分界线以下)时,表示市场处于反转的临界点,这时进行反向交易。
-
结合威廉姆斯鳄鱼指标判断市场趋势。只有在鳄鱼指标显示三条均线(红唇线、白牙线、蓝颚线)向下排列时才考虑做空;只有在鳄鱼指标显示三条均线向上排列时才考虑做多。
-
采用RSI指标的RSI来判断RSI指标本身的超买超卖现象,形成双重过滤效果。只有RSI指标线进入超买超卖区,同时RSI指标的RSI也进入超买超卖区时,才会发出交易信号。
-
设定止损线和止盈线。当价格翻转达到止盈线或止损线时,平仓止盈或止损。
优势分析
该策略具有以下优势:
-
采用稳健的海龟交易策略,只在市场明显反转时才入场,可以避免交易市场震荡时无方向的巨大风险。
-
使用RSI指标判断市场反转点,指标简单明了,容易操作。RSI的RSI设置避免了whipsaw,双重过滤提高了信号的可靠性。
-
结合鳄鱼指标判断趋势方向,避免逆势交易。鳄鱼指标作为辅助条件增加了过滤效果。
-
设置止盈止损策略,可以锁定盈利,控制风险。
-
易于参数优化。RSI的参数以及进场出场条件可以根据不同市场调整,优化策略。
风险分析
该策略也存在一些风险:
-
RSI指标发出假信号的概率存在。RSI指标可能会发出错误的超买超卖信号。结合鳄鱼指标可以降低假信号概率。
-
止损点设置过大可能导致亏损扩大。应适当缩小止损点,降低单笔损失。
-
反转不一定发生在RSI超买超卖区。市场结构变化可能导致反转点变化,应适时调整参数。
-
交易次数可能较少,存在长时间无交易的情况。可适当宽松进场条件以增加交易次数。
-
市场可能长期持续上涨或下跌,使短线交易受困。应适时调整持仓周期,延长或缩短交易周期。
优化方向
该策略可以从以下几个方向进行优化:
-
优化RSI的参数,调整超买区和超卖区的区间,适应不同市场。
-
调整鳄鱼指标的参数,优化判断趋势方向的准确性。
-
优化止盈止损的设置,实现最大回撤控制和锁定更多盈利。
-
结合其他指标等进行组合,提高信号准确性,例如KDJ,MACD等。
-
增加自动止损,跟踪止损功能,更好控制单笔亏损。
-
优化仓位管理,不同市场条件下调整仓位大小,控制风险。
-
优化交易时间段,在趋势更明显的时间段进行交易。
总结
该策略整体来说是一个较为稳健的短线交易策略。它采用较为保守的海龟交易策略,同时利用RSI指标判断反转点,并辅以鳄鱼指标判断趋势方向,可以有效避免追高杀跌之类的高风险交易,锁定较为稳定的盈利。通过优化参数设置、止盈止损策略、组合其他指标等手段,可以不断提升该策略的效果。总体来说,该策略适合对市场反转交易感兴趣、追求稳定收益的投资者。
||
Overview
This is a short-term trading strategy that uses the RSI indicator based on the turtle trading rules. It combines the RSI indicator and Williams Alligator indicator to take counter-trend trades when the RSI enters the overbought or oversold zone. It's a relatively conservative short-term trading strategy.
Strategy Logic
The strategy is mainly based on the following principles:
-
Using the turtle trading rules, only enter the market when there is an obvious reversal, adopting a relatively conservative trading approach.
-
Using the RSI indicator to judge the overbought/oversold conditions. When the RSI line enters the overbought zone (default above 60) or oversold zone (default below 40), it indicates the market is at the reversal point, then take counter-trend trades.
-
Combining the Williams Alligator indicator to determine the market trend. Go short only when the Alligator shows the three lines (Lips, Teeth, Jaw) aligned in a downtrend; go long only when the three lines aligned in an uptrend.
-
Using RSI of RSI to judge the overbought/oversold conditions of the RSI indicator itself, creating a double filter effect. Only when the RSI line enters the overbought/oversold zone, and the RSI of RSI also enters the overbought/oversold zone, will trading signals trigger.
-
Set stop loss and take profit lines. Close the position for profit or stop loss when the price reverses to hit the take profit or stop loss lines.
Advantage Analysis
The strategy has the following advantages:
-
Adopting the robust turtle trading rules, only entering the market when there is an obvious reversal, can avoid huge risks when the market is ranging.
-
Using the RSI indicator to determine market reversal points, the indicator is simple and clear, easy to operate. The RSI of RSI setting avoids whipsaws, and the double filter improves signal reliability.
-
Combining the Alligator indicator to determine the trend direction avoids trading against the trend. The Alligator acts as an additional filter to improve effectiveness.
-
Setting stop loss and take profit locks in profits and controls risks.
-
Easy to optimize parameters. The RSI parameters and entry/exit criteria can be adjusted for different markets to optimize the strategy.
Risk Analysis
The strategy also has some risks:
-
There is a probability of false signals from the RSI indicator. The RSI may give incorrect overbought/oversold signals. Combining Alligator can reduce false signals.
-
A too wide stop loss may lead to enlarged losses. The stop loss should be narrowed appropriately to reduce per trade loss.
-
Reversals may not happen exactly at RSI overbought/oversold zones. Market regime changes may shift the reversal points, parameters should be adjusted accordingly.
-
The number of trades can be low, facing periods of no trading. Entry criteria could be relaxed to increase number of trades.
-
Prolonged trending markets can make short-term trading difficult. Holding period should be adjusted in a timely manner, lengthening or shortening the trading timeframe.
Optimization Directions
The strategy can be optimized in the following aspects:
-
Optimize RSI parameters, adjust the overbought/oversold zones to adapt to different markets.
-
Adjust Alligator parameters to improve the accuracy of determining trend direction.
-
Optimize stop loss and take profit settings to maximize drawdown control and lock in more profits.
-
Combine with other indicators like KDJ, MACD etc. to improve signal accuracy.
-
Add auto stop loss, trailing stop loss to better control single trade loss.
-
Optimize position sizing under different market conditions to manage risks.
-
Optimize trading sessions, trade at times when the trend is more obvious.
Summary
In summary, this is a relatively robust short-term trading strategy. It adopts a conservative turtle trading approach, uses the RSI indicator to determine reversal points, and incorporates the Alligator indicator to judge trend direction, which can effectively avoid high-risk trades like chasing tops and bottoms, and lock in relatively stable profits. By optimizing parameters, stop loss/take profit, combining other indicators, etc., the strategy can be continuously improved. Overall, this strategy suits investors who are interested in counter-trend trading and pursuing steady returns.
[/trans]
Strategy Arguments
| Argument | Default | Description |
|---|---|---|
| v_input_1 | 5 | length1 |
| v_input_2 | 10 | length2 |
| v_input_3 | 15 | length3 |
| v_input_4 | 5 | RSI UO length |
| v_input_5 | 60 | Sell at RSIofUO |
| v_input_6 | 75 | Cover at RSIofUO |
| v_input_7 | 10 | Risk % of capital |
| v_input_8 | 3 | Stop Loss |
| v_input_9 | false | show Ultimate Oscialltor |
Source (PineScript)
/*backtest
start: 2023-11-06 00:00:00
end: 2023-11-07 20:00:00
period: 30m
basePeriod: 15m
exchanges: [{"eid":"Futures_Binance","currency":"BTC_USDT"}]
*/

// This source code is subject to the terms of the Mozilla Public License 2.0 at https://mozilla.org/MPL/2.0/
// © mohanee

//@version=4

strategy(title="RSI of Ultimate Oscillator [SHORT Selling] Strategy",  shorttitle="RSIofUO" , overlay=false, pyramiding=1,     default_qty_type=strategy.percent_of_equity,  default_qty_value=20, initial_capital=10000, currency=currency.USD)  //default_qty_value=10, default_qty_type=strategy.fixed,


//Ultimate Oscillator logic copied from  TradingView   builtin indicator
/////////////////////////////////////////////////////////////////////////////////
length1 = input(5, minval=1), length2 = input(10, minval=1), length3 = input(15, minval=1)


rsiUOLength = input(5, title="RSI UO length", minval=1)

sellLine = input (60, title="Sell at RSIofUO")
coverLine = input (75, title="Cover at RSIofUO")

riskCapital = input(title="Risk % of capital", defval=10, minval=1)
stopLoss=input(3,title="Stop Loss",minval=1)


showUO=input(false, "show Ultimate Oscialltor")


average(bp, tr_, length) => sum(bp, length) / sum(tr_, length)
high_ = max(high, close[1])
low_ = min(low, close[1])
bp = close - low_
tr_ = high_ - low_
avg7 = average(bp, tr_, length1)
avg14 = average(bp, tr_, length2)
avg28 = average(bp, tr_, length3)
out = 100 * (4*avg7 + 2*avg14 + avg28)/7
//Ultimate Oscillator
/////////////////////////////////////////////////////////////////////////////////

//Willimas Alligator  copied from  TradingView built in Indicator
/////////////////////////////////////////////////////////////////////////////////
smma(src, length) =>
	smma =  0.0
	smma := na(smma[1]) ? sma(src, length) : (smma[1] * (length - 1) + src) / length
	smma

//moving averages logic copied from Willimas Alligator -- builtin indicator in TradingView
sma1=smma(hl2,10)
sma2=smma(hl2,20)
sma3=smma(hl2,50)

//Willimas Alligator
/////////////////////////////////////////////////////////////////////////////////


//drawings
/////////////////////////////////////////////////////////////////////////////////
hline(sellLine, title="Middle Line 60  [Short Here]", color=color.red , linestyle=hline.style_solid)

obLevelPlot = hline(75, title="Overbought",  color=color.blue , linestyle=hline.style_dashed)
osLevelPlot = hline(25, title="Oversold", color=color.blue, linestyle=hline.style_dashed)

fill(obLevelPlot, osLevelPlot, title="Background", color=color.blue, transp=90)
rsiUO = rsi(out,rsiUOLength)

ultPlot=plot(showUO==true? out : na, color=color.green, title="Oscillator")

plot(rsiUO, title = "rsiUO" ,  color=color.purple)
//drawings
/////////////////////////////////////////////////////////////////////////////////


//Strategy Logic
/////////////////////////////////////////////////////////////////////////////////

//Entry--
//Echeck how many units can be purchased based on risk manage ment and stop loss
qty1 = (strategy.equity  * riskCapital / 100 ) /  (close*stopLoss/100)

//check if cash is sufficient  to buy qty1  , if capital not available use the available capital only
qty1:= (qty1 * close >= strategy.equity ) ? (strategy.equity / close) : qty1


strategy.entry(id="SERSIofUO", long=false,   qty=qty1, when = sma1<=sma2 and sma2 < sma3 and close<sma2 and crossunder(rsiUO,sellLine) )

//strategy.entry(id="SERSiofUO", long=false, when = sma1< sma2  and crossunder(rsiUO,60) )

barcolor(abs(strategy.position_size)>=1 ? color.purple : na )
bgcolor(abs(strategy.position_size)>=1 ? color.purple : na , transp=70)


//partial exit
strategy.close(id="SERSIofUO", comment="PExit",  qty=strategy.position_size/3, when=abs(strategy.position_size)>=1 and close< strategy.position_avg_price and crossover(rsiUO,30) )

strategy.close(id="SERSIofUO", comment="CloseAll", when=abs(strategy.position_size)>=1 and crossover(rsiUO,coverLine) )

//Strategy Logic
/////////////////////////////////////////////////////////////////////////////////
Detail
https://www.fmz.com/strategy/432111
Last Modified
2023-11-14 15:59:25