
16 KiB
Name
流动性捕捉与智能资金分歧指标结合策略-Liquidity-Grab-Smart-Money-Divergence-Indicator-Combination-Strategy
Author
ianzeng123
Strategy Description
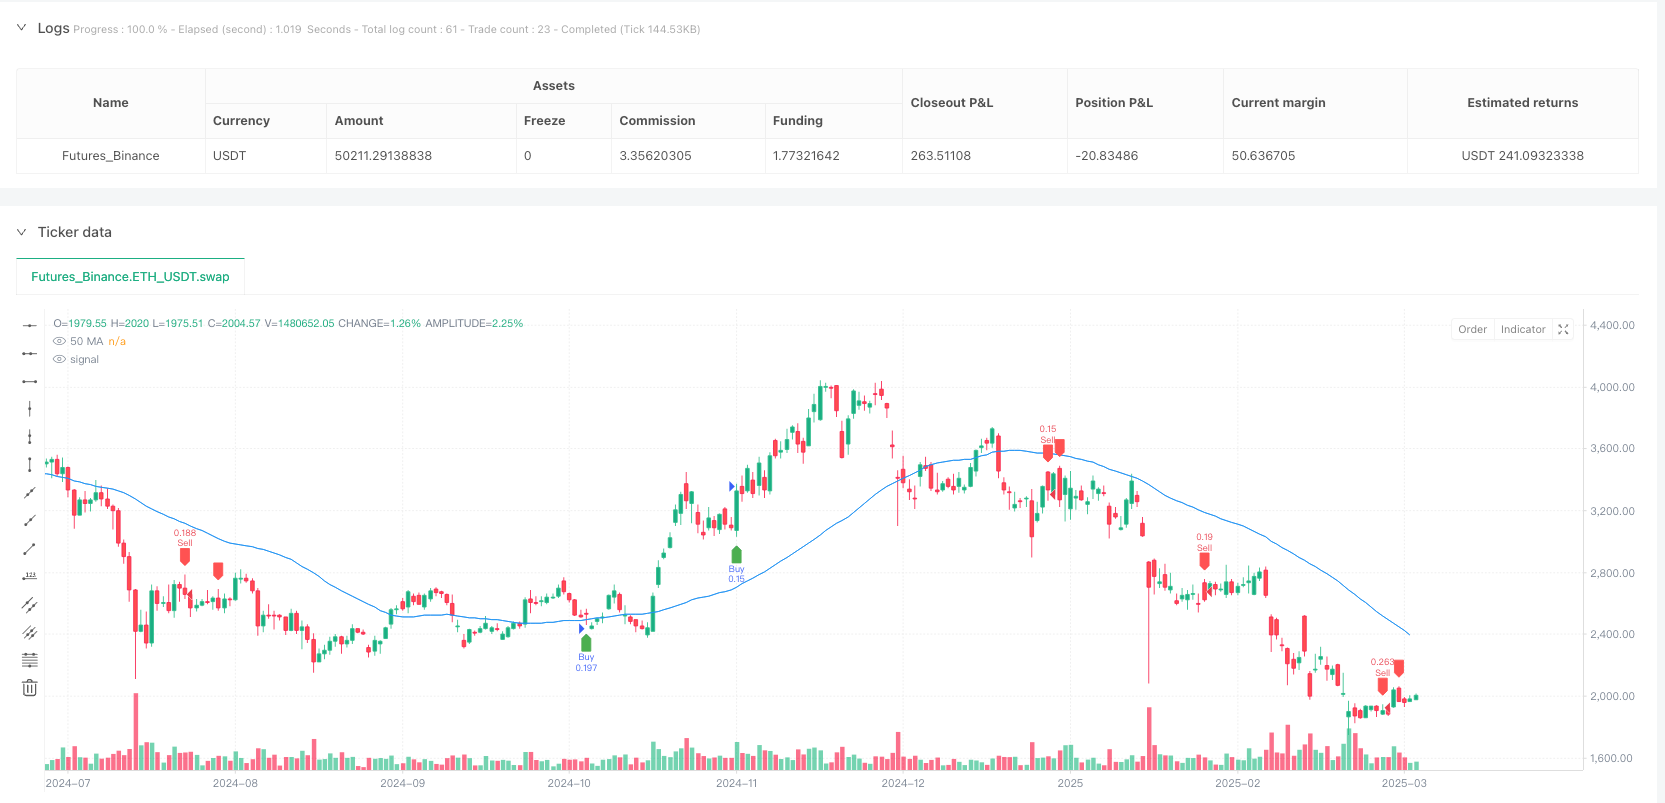
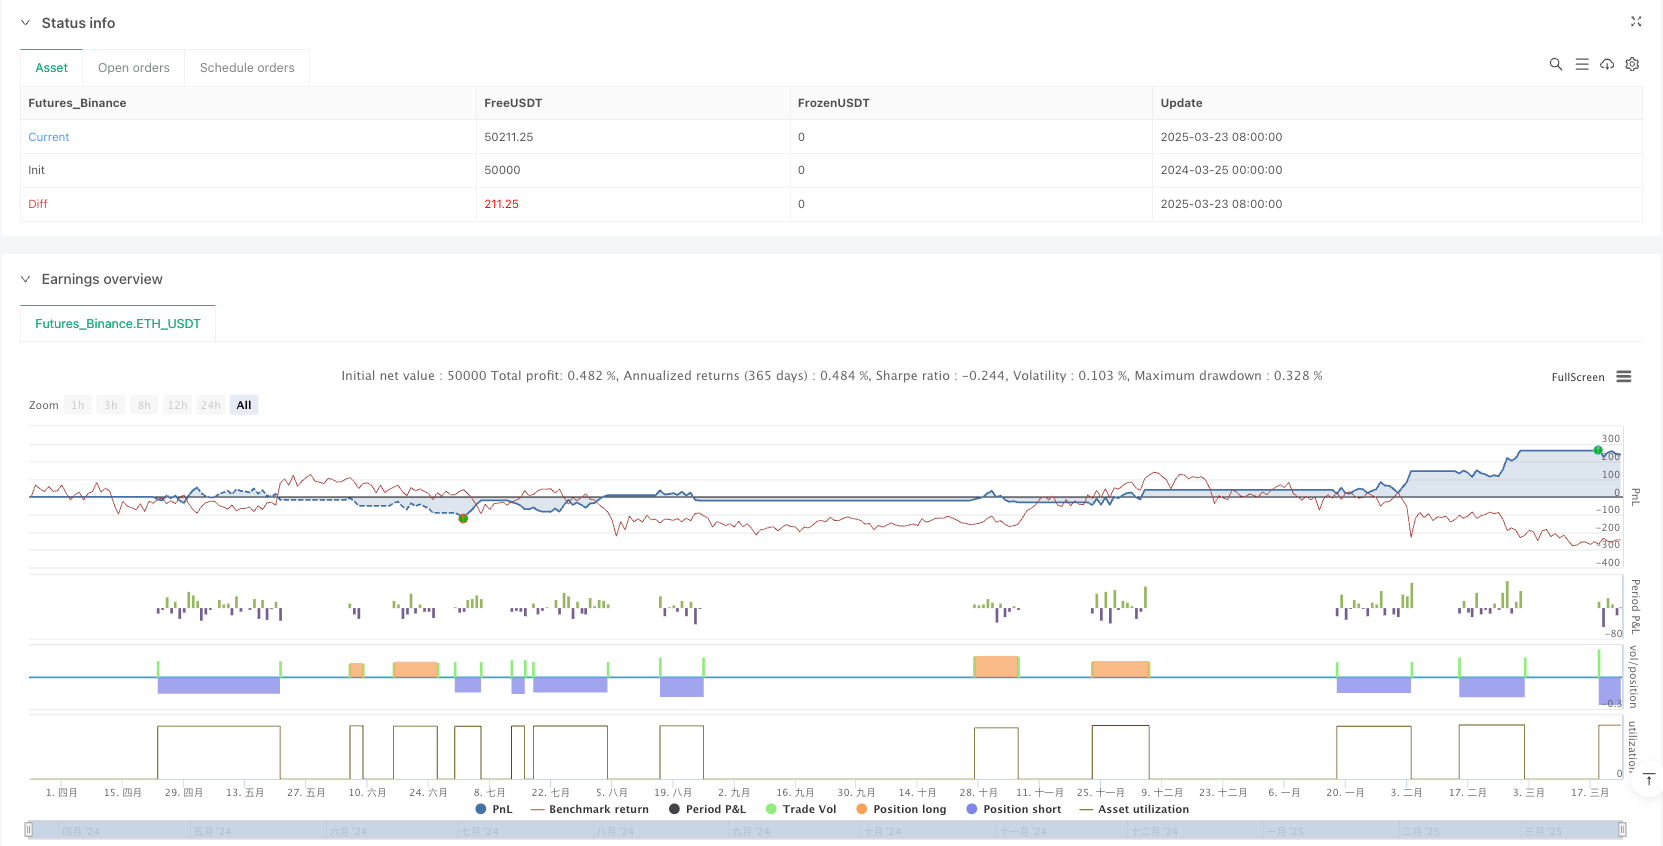
[trans]
概述
流动性捕捉与智能资金分歧指标结合策略是一种基于技术分析的量化交易方法,通过识别市场中的流动性捕捉事件和智能资金分歧信号,结合趋势确认和动态风险管理系统进行交易决策。该策略核心思想是捕捉市场结构性变化点,即大型机构投资者(智能资金)在吸收流动性后可能改变方向的关键时刻,从而抓住高概率的入场时机。
策略原理
该策略的运作机制基于多重技术指标和市场结构分析:
-
流动性捕捉识别:通过监测价格是否扫过近期高点/低点(由lookback参数定义),并随后出现反转。具体而言,当价格创下lookback周期内新高但收盘价低于前一根K线高点时,判定为高点流动性捕捉;当价格创下lookback周期内新低但收盘价高于前一根K线低点时,判定为低点流动性捕捉。
-
智能资金分歧:将价格走势与RSI指标进行对比,寻找背离现象。当价格创下新低但RSI未创新低时,形成看涨分歧;当价格创新高但RSI未创新高时,形成看跌分歧。这种分歧通常表明市场内在动能与价格走势不一致,暗示可能即将反转。
-
趋势确认过滤:使用50周期简单移动平均线(SMA)作为趋势判断工具,只在趋势方向一致的情况下执行交易。当价格高于SMA时认为处于上升趋势,只考虑做多;当价格低于SMA时认为处于下降趋势,只考虑做空。
-
动态风险管理:基于ATR(Average True Range)指标设置动态止损和获利目标,止损设置为当前ATR值的1.5倍,获利目标设置为止损距离的2倍(即ATR值的3倍)。
交易信号生成逻辑为:
- 做多信号:识别到低点流动性捕捉 + 确认RSI看涨分歧 + 价格处于SMA之上
- 做空信号:识别到高点流动性捕捉 + 确认RSI看跌分歧 + 价格处于SMA之下
策略优势
-
高概率反转点识别:通过结合流动性捕捉和智能资金分歧,该策略能够更准确地捕捉市场结构性转折点,降低虚假信号的概率。
-
趋势过滤机制:由于加入了SMA趋势确认,策略避免了逆势交易,只在主趋势方向上寻找入场机会,提高了交易成功率。
-
自适应风险管理:基于ATR的动态止损机制使得风险控制能够根据市场波动性自动调整,在不同市场环境下保持合适的风险敞口。
-
优化的风险收益比:策略采用1:2的风险收益设置(止损为1.5倍ATR,获利目标为3倍ATR),数学期望值更具优势。
-
多重确认机制:交易信号需满足多重条件(流动性捕捉、分歧信号、趋势确认),降低了错误信号的可能性,增强了交易的稳健性。
-
适应市场周期变化:由于该策略既可做多也可做空,能够适应不同的市场周期和环境,不仅限于单一方向的市场。
策略风险
-
过度优化风险:策略依赖多个参数(RSI长度、回看周期、均线周期、ATR参数等),存在过度优化(过拟合)的可能,可能导致回测效果好但实盘表现差。
-
信号滞后性:由于使用了移动平均线和RSI等指标,某些信号可能出现滞后,导致入场不够及时或错过最佳入场点。
-
流动性不足风险:在低流动性市场环境下,流动性捕捉的概念可能不够明显,导致信号质量下降。
-
市场剧烈波动风险:在市场异常波动期间,ATR可能突然放大,导致止损位置过远,单笔风险增加。
-
震荡市场表现不佳:在无明显趋势的横盘震荡市场中,该策略可能产生较多假信号,导致频繁止损。
-
参数敏感性:策略表现对参数选择较为敏感,不同市场和时间框架可能需要不同的参数设置。
策略优化方向
-
动态参数调整:可以考虑引入自适应参数机制,根据市场波动性和趋势强度动态调整RSI长度、回看周期和MA周期,以适应不同市场环境。
-
加入成交量确认:在流动性捕捉和分歧判断中加入成交量分析,可以提高信号质量。高成交量的流动性捕捉通常更具意义,表明更多市场参与者被套牢。
-
多时间框架分析:引入多时间框架确认机制,只在更高时间框架趋势方向一致时执行交易,可以进一步降低假信号概率。
-
优化止盈机制:可以考虑实现分批止盈或采用移动止损策略,而非简单的固定比例止盈,以更好地捕捉趋势性行情。
-
加入市场环境过滤:引入波动率指标(如ATR比率或Bollinger带宽)来识别市场环境,在高波动或横盘震荡市场中调整策略参数或暂停交易。
-
机器学习增强:考虑使用机器学习方法优化参数选择或信号质量评估,提高策略的适应性和稳健性。
-
增加反向思考机制:在极端市场情况下(如RSI严重超买超卖),可以考虑添加反向信号逻辑,避免在市场即将反转时入场。
总结
流动性捕捉与智能资金分歧指标结合策略是一种基于市场微观结构和技术指标的综合交易系统,通过识别大资金操作痕迹和内在动能变化来捕捉高概率交易机会。该策略结合了价格行为分析、技术指标背离和趋势确认,辅以动态风险管理,形成了一个相对完整的交易框架。
该策略最大的优势在于能够捕捉市场结构性变化点,即大型机构完成流动性收集后可能改变方向的关键时刻。通过多重确认机制和趋势过滤,策略降低了错误信号概率,提高了交易质量。然而,策略也面临参数优化、假信号和市场适应性等挑战。
为进一步增强策略表现,可考虑引入动态参数调整、多时间框架分析、成交量确认和优化止盈机制等改进措施。总体而言,该策略提供了一个捕捉市场转折点的有效框架,通过合理的风险管理和持续优化,有潜力成为一个稳健的交易系统。 ||
Overview
The Liquidity Grab & Smart Money Divergence Indicator Combination Strategy is a quantitative trading approach based on technical analysis that identifies liquidity grab events and smart money divergence signals in the market, combined with trend confirmation and dynamic risk management systems for trading decisions. The core idea of this strategy is to capture structural market turning points—key moments when large institutional investors (smart money) may change direction after absorbing liquidity, thereby seizing high-probability entry opportunities.
Strategy Principles
The strategy operates based on multiple technical indicators and market structure analysis:
-
Liquidity Grab Identification: Monitors whether price sweeps recent highs/lows (defined by the lookback parameter) followed by a reversal. Specifically, when price makes a new high within the lookback period but closes below the previous candle's high, it's identified as a high liquidity grab; when price makes a new low but closes above the previous candle's low, it's identified as a low liquidity grab.
-
Smart Money Divergence: Compares price movement with the RSI indicator to look for divergence patterns. When price makes a new low but RSI doesn't make a new low, a bullish divergence forms; when price makes a new high but RSI doesn't make a new high, a bearish divergence forms. This divergence typically indicates that the market's internal momentum doesn't align with price movement, suggesting a potential reversal.
-
Trend Confirmation Filter: Uses a 50-period Simple Moving Average (SMA) as a trend determination tool, executing trades only when aligned with the trend direction. When price is above the SMA, it's considered an uptrend and only long positions are considered; when price is below the SMA, it's considered a downtrend and only short positions are considered.
-
Dynamic Risk Management: Sets dynamic stop-loss and profit targets based on the ATR (Average True Range) indicator. Stop-loss is set at 1.5 times the current ATR value, and the profit target is set at twice the stop-loss distance (i.e., 3 times the ATR value).
The trade signal generation logic is:
- Long signal: Low liquidity grab identified + RSI bullish divergence confirmed + Price above SMA
- Short signal: High liquidity grab identified + RSI bearish divergence confirmed + Price below SMA
Strategy Advantages
-
High-Probability Reversal Point Identification: By combining liquidity grabs and smart money divergence, the strategy can more accurately capture structural market turning points, reducing the probability of false signals.
-
Trend Filtering Mechanism: With SMA trend confirmation added, the strategy avoids counter-trend trading and only seeks entry opportunities in the direction of the main trend, improving the success rate of trades.
-
Adaptive Risk Management: The ATR-based dynamic stop-loss mechanism allows risk control to adjust automatically according to market volatility, maintaining appropriate risk exposure in different market environments.
-
Optimized Risk-Reward Ratio: The strategy employs a 1:2 risk-reward setting (stop-loss at 1.5x ATR, profit target at 3x ATR), providing a more advantageous mathematical expectation.
-
Multiple Confirmation Mechanism: Trade signals must meet multiple conditions (liquidity grab, divergence signal, trend confirmation), reducing the possibility of erroneous signals and enhancing trading robustness.
-
Adaptation to Market Cycle Changes: Since the strategy can both go long and short, it can adapt to different market cycles and environments, not limited to a single market direction.
Strategy Risks
-
Over-Optimization Risk: The strategy relies on multiple parameters (RSI length, lookback period, moving average period, ATR parameters, etc.), creating the possibility of over-optimization (overfitting), which may lead to good backtest results but poor live trading performance.
-
Signal Lag: Due to the use of moving averages and RSI indicators, some signals may appear with a lag, resulting in untimely entries or missed optimal entry points.
-
Insufficient Liquidity Risk: In low-liquidity market environments, the concept of liquidity grabs may not be as evident, leading to decreased signal quality.
-
Extreme Market Volatility Risk: During periods of abnormal market volatility, ATR may suddenly expand, causing stop-loss positions to be placed too far away and increasing single-trade risk.
-
Poor Performance in Ranging Markets: In sideways, ranging markets with no clear trend, the strategy may produce more false signals, resulting in frequent stop-losses.
-
Parameter Sensitivity: Strategy performance is relatively sensitive to parameter selection, and different markets and timeframes may require different parameter settings.
Strategy Optimization Directions
-
Dynamic Parameter Adjustment: Consider introducing an adaptive parameter mechanism that dynamically adjusts RSI length, lookback period, and MA period based on market volatility and trend strength to adapt to different market environments.
-
Volume Confirmation Addition: Incorporate volume analysis in liquidity grab and divergence judgment to improve signal quality. High-volume liquidity grabs typically hold more significance, indicating more market participants being trapped.
-
Multiple Timeframe Analysis: Introduce a multiple timeframe confirmation mechanism, executing trades only when aligned with higher timeframe trend direction, which can further reduce the probability of false signals.
-
Profit-Taking Mechanism Optimization: Consider implementing partial profit-taking or trailing stop-loss strategies instead of simple fixed-ratio profit-taking to better capture trending market movements.
-
Market Environment Filtering: Introduce volatility indicators (such as ATR ratio or Bollinger Bandwidth) to identify market environments and adjust strategy parameters or pause trading during high volatility or sideways ranging markets.
-
Machine Learning Enhancement: Consider using machine learning methods to optimize parameter selection or signal quality assessment, improving strategy adaptability and robustness.
-
Counter-Logic Mechanism: In extreme market conditions (such as severe RSI overbought/oversold), consider adding reverse signal logic to avoid entering positions when the market is about to reverse.
Summary
The Liquidity Grab & Smart Money Divergence Indicator Combination Strategy is a comprehensive trading system based on market microstructure and technical indicators, capturing high-probability trading opportunities by identifying traces of large capital operations and internal momentum changes. This strategy combines price action analysis, technical indicator divergence, and trend confirmation, supplemented by dynamic risk management, forming a relatively complete trading framework.
The strategy's greatest advantage lies in its ability to capture structural market turning points—critical moments when large institutions may change direction after completing liquidity collection. Through multiple confirmation mechanisms and trend filtering, the strategy reduces the probability of erroneous signals and improves trading quality. However, the strategy also faces challenges related to parameter optimization, false signals, and market adaptability.
To further enhance strategy performance, consider introducing dynamic parameter adjustment, multiple timeframe analysis, volume confirmation, and optimized profit-taking mechanisms. Overall, this strategy provides an effective framework for capturing market turning points and, with proper risk management and continuous optimization, has the potential to become a robust trading system.[/trans]
Source (PineScript)
/*backtest
start: 2024-03-25 00:00:00
end: 2025-03-24 00:00:00
period: 1d
basePeriod: 1d
exchanges: [{"eid":"Futures_Binance","currency":"ETH_USDT"}]
*/

//@version=5
strategy("Liquidity Grab + Smart Money Divergence Strategy", overlay=true, default_qty_type=strategy.percent_of_equity, default_qty_value=1)

// Input settings
length = input(14, "RSI Length")
lookback = input(5, "Lookback Bars")
src = close
maLength = input(50, "MA Length")
atrLength = input(14, "ATR Length")
atrMultiplier = input(1.5, "ATR Multiplier")

// RSI Calculation
rsiValue = ta.rsi(src, length)

// Moving Average Trend Filter
ma = ta.sma(close, maLength)
trendUp = close > ma
trendDown = close < ma

// ATR for dynamic stop-loss and take-profit
atr = ta.atr(atrLength)
sl = atr * atrMultiplier

// Detect liquidity grab (sweep of recent high/low)
sweepHigh = ta.highest(high, lookback) == high and close < high[1]
sweepLow = ta.lowest(low, lookback) == low and close > low[1]

// Detect Smart Money Divergence
bullishDivergence = sweepLow and (rsiValue > ta.lowest(rsiValue, lookback))
bearishDivergence = sweepHigh and (rsiValue < ta.highest(rsiValue, lookback))

// Trade signals with trend confirmation
buySignal = bullishDivergence and trendUp
sellSignal = bearishDivergence and trendDown

// Execute trades with stop-loss and take-profit
if buySignal
    strategy.entry("Buy", strategy.long)
    strategy.exit("Sell", from_entry="Buy", stop=close - sl, limit=close + sl * 2)
if sellSignal
    strategy.entry("Sell", strategy.short)
    strategy.exit("Buy", from_entry="Sell", stop=close + sl, limit=close - sl * 2)

// Plot signals on chart
plotshape(buySignal, location=location.belowbar, color=color.green, style=shape.labelup, size=size.small, title="Buy Signal")
plotshape(sellSignal, location=location.abovebar, color=color.red, style=shape.labeldown, size=size.small, title="Sell Signal")
plot(ma, title="50 MA", color=color.blue)
Detail
https://www.fmz.com/strategy/488156
Last Modified
2025-03-25 15:12:43