
8.9 KiB
Name
波道策略与止损The-Bollinger-Bands-Stop-Loss-Strategy
Author
ChaoZhang
Strategy Description
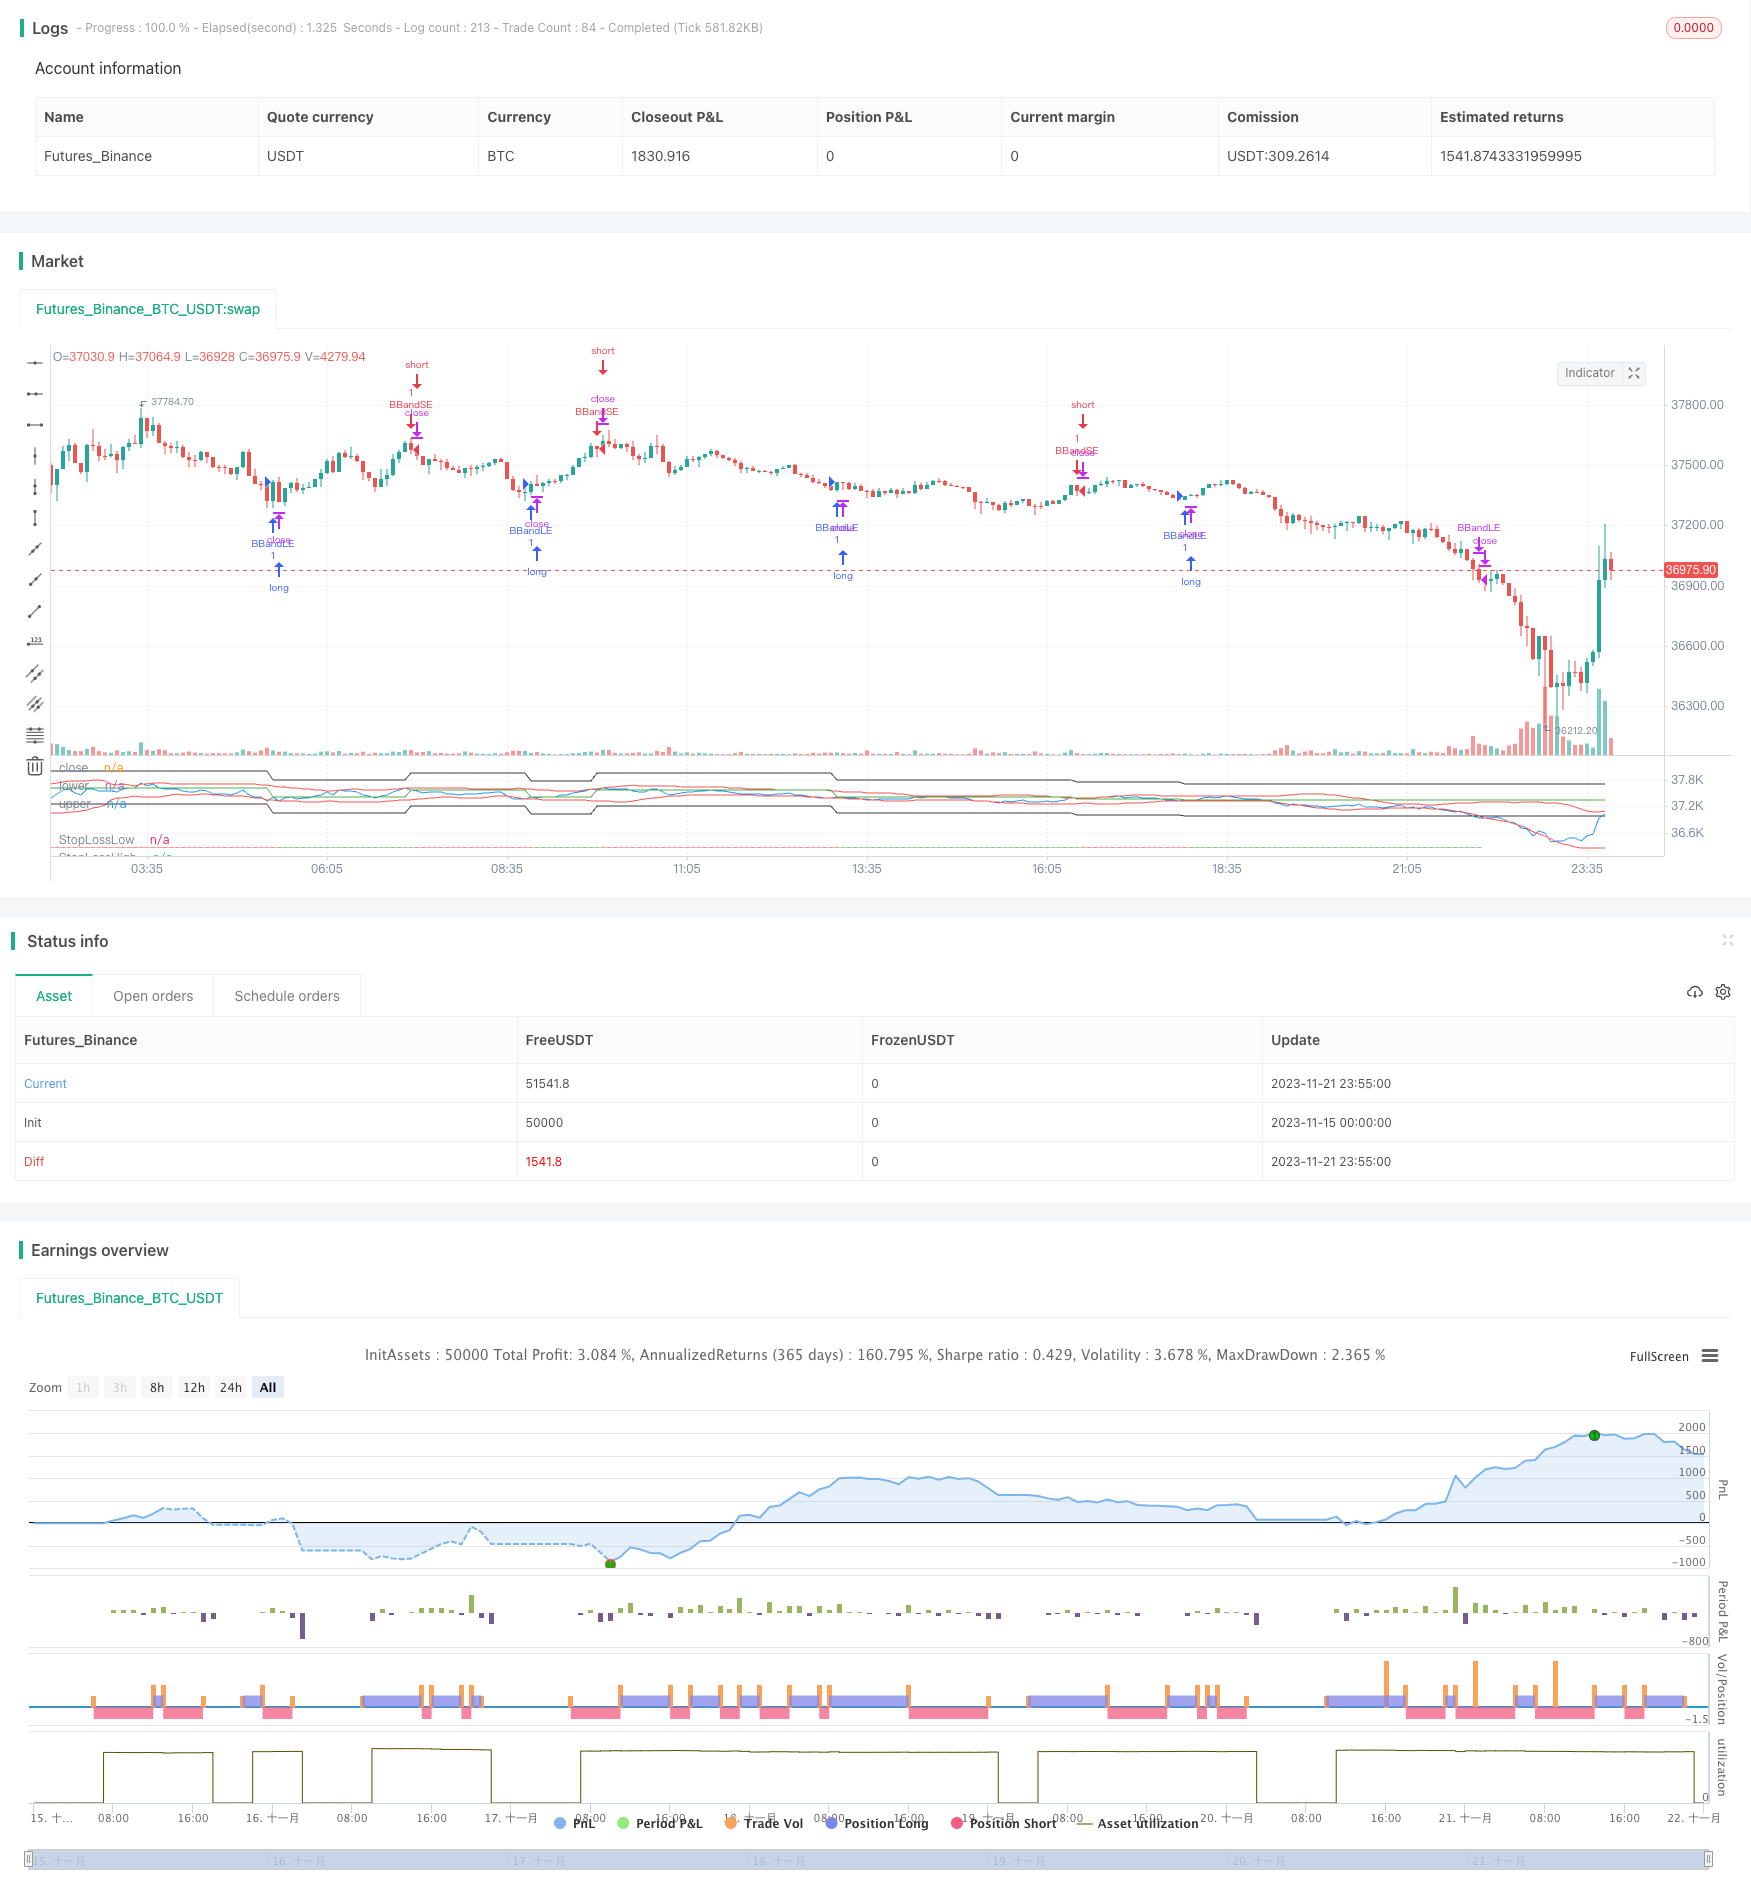 [trans]
概述
波道策略(Bollinger Bands Strategy)是一个利用布林线波动带进行趋势跟踪和超买超卖信号的经典策略。这个版本在原有策略基础上增加了止损机制来控制风险。
策略通过布林带的上下轨的金叉死叉判断市场的超买超卖情况,通过追踪布林带进行趋势跟踪。布林带上轨和下轨之间的区域反映了当前市场的波动范围。布林带由中轨、上轨和下轨构成,中轨是n日简单移动平均线,上轨和下轨由中轨加减k倍的n日标准差确定。
原理
布林带是一个反映市场波动率和震荡幅度的技术指标。当价格刚好触及布林带下轨附近时,说明市场处于超卖状态,此时连续出现的缺口有较大概率被补上,根据回归特征应该考虑建立多头头寸。当价格刚好触及布林带上轨附近时,说明此时市场可能处于超买状态,这时价格可能产生反转向下的行情,应该考虑建立空头头寸以获利于下跌行情。
该策略结合布林带的超买超卖信号实现建立趋势跟踪头寸,并增加止损机制来控制风险。
当价格上穿布林带下轨时,说明市场由超卖区域进入合理区域,此时可以建立多头头寸。当价格下穿布林带上轨时,说明市场进入超买区域,此时可以建立空头头寸。
建仓后,设置固定百分比的止损位来控制风险。当亏损超过设置止损幅度时止损退出当前头寸,避免过大亏损。
优势
-
该策略结合布林带指标判断超买超卖区域,通过判断价格与上下轨交叉实现低买高卖
-
利用布林带波动性特性进行趋势跟踪交易
-
增加止损机制,可以有效控制单笔交易的最大损失
-
结合趋势跟踪和止损,可以获得稳定收益
风险及优化
-
布林带的参数设定会影响交易信号质量。中轨长度n和标准差倍数k需要根据不同市场合理设定,否则会影响交易信号准确率。
-
止损设置过大过小都会影响收益稳定性。止损幅度设置过大会加大单笔亏损风险,过小会增加止损被触发概率。需要根据不同品种合理设置止损百分比。
-
可以考虑结合其他指标进行信号过滤,提高交易信号准确率。
-
可以测试不同持仓时间设定,如结合小时级或更短周期布林带进行更高频交易,提高资金使用效率。
总结
该策略结合布林带判断超买超卖区域建立头寸,增加止损来控制风险,是一种常见的趋势跟踪型策略。通过优化参数设置,结合更准确的交易信号和止损水平的设定,可以获得稳定的盈利。
||
Overview
The Bollinger Bands Strategy is a classic strategy that utilizes Bollinger Bands for trend tracking and overbought/oversold signals. This version adds stop loss mechanisms to control risks over the original strategy.
The strategy judges overbought/oversold conditions through golden/dead crossovers of the upper/lower Bollinger Bands to establish positions. The area between the bands reflects current market volatility range. The bands consist of middle, upper and lower bands, where the middle band is the N-day simple moving average and the upper/lower bands are middle band +/- K standard deviations.
Principles
Bollinger Bands reflect market volatility and oscillation range. Touching the lower band means oversold status quo - gaps have higher probabilities of being filled up. Thus long positions should be considered based on mean-reversion principle. Likewise, touching the upper band represents potential overbought conditions and likely price reversals, so short positions can be established to profit on the down moves.
This strategy combines the overbought/oversold signals from Bollinger Bands for trend tracking entries. Stop loss mechanisms are incorporated to control risks.
When price crosses above the lower band, market exits oversold area into reasonable range. Long positions can be opened. When price crosses below upper band, market becomes overbought. Shorts can then be opened.
After orders are filled, fixed percentage stop loss levels are set to manage risks. When losses exceed stop loss percentage, current positions are stopped out to limit further losses.
Advantages
-
Identify overbought/oversold levels with Bollinger Bands for low-buy-high-sell setups judging by band crossovers.
-
Capture trends through volatility property of Bollinger Bands.
-
Stop loss mechanism effectively limits max loss per trade.
-
Combining trend tracking and stop loss leads to steady gains.
Risks and Optimization
-
Parameter settings impacts signal quality. Middle band length N and standard deviation multiplier K should be rationally set for different markets, or accuracy will suffer.
-
Oversized or undersized stop loss hurts return stability. Overlarge percentage risks heavier losses per trade, while undersized percentage risks premature stop loss triggers. Reasonable percentage should be set based on different products.
-
Additional filters with other indicators may improve signal accuracy.
-
Different holding period settings can be tested, such as combining hourly or shorter period bands for higher frequency trading and capital usage efficiency improvements.
Conclusion
This strategy leverages Bollinger Bands for overbought/oversold signals and incorporates stop loss for risk control. It is a common trend tracking strategy. Through optimizing parameters, integrating more accurate signals and stop loss levels, steady profits can be achieved.
[/trans]
Strategy Arguments
| Argument | Default | Description |
|---|---|---|
| v_input_1_close | 0 | Source: close |
| v_input_int_1 | 20 | length |
| v_input_float_1 | 2 | mult |
| v_input_float_2 | true | Stop Loss Percent |
Source (PineScript)
/*backtest
start: 2023-11-15 00:00:00
end: 2023-11-22 00:00:00
period: 5m
basePeriod: 1m
exchanges: [{"eid":"Futures_Binance","currency":"BTC_USDT"}]
*/

//@version=5
strategy(title="Bollinger Bands Strategy", overlay=false, shorttitle="BBS", pyramiding=0, currency=currency.USD, commission_type=strategy.commission.percent, commission_value=0.03, initial_capital=1000)
source = input(close, "Source")
length = input.int(20, minval=1)
mult = input.float(2.0, minval=0.001, maxval=50, step=0.001)
stopLossFactor = input.float(1, "Stop Loss Percent", maxval = 100, minval = 0, step=0.1)

basis = ta.sma(source, length)
dev = mult * ta.stdev(source, length)
upper = basis + dev
lower = basis - dev

var float lastTradePrice = na
var float stopLossLow = na
var float stopLossHigh = na
var bool currentIsLong = na

var bool nextExpectedIsLong = true

var bool existedLong = false
var bool existedShort = false

buyEntry = ta.crossover(source, lower)
sellEntry = ta.crossunder(source, upper)

if (buyEntry and nextExpectedIsLong == true)
	strategy.entry("BBandLE", strategy.long, comment="BBandLE")
	nextExpectedIsLong := false
	if(nz(strategy.position_size[1], 0) < 0) // new position detected
	    lastTradePrice := close
	    stopLossLow := lastTradePrice * (1 - (stopLossFactor / 100))
	    stopLossHigh := lastTradePrice * (1 + (stopLossFactor / 100))
else
    strategy.cancel("BBandLE")

if (sellEntry and nextExpectedIsLong == false)
	strategy.entry("BBandSE", strategy.short, comment="BBandSE")
	nextExpectedIsLong := true
	if(nz(strategy.position_size[1], 0) > 0) // new position detected
        lastTradePrice := close
        stopLossLow := lastTradePrice * (1 - (stopLossFactor / 100))
        stopLossHigh := lastTradePrice * (1 + (stopLossFactor / 100))
else
    strategy.cancel("BBandSE")

strategy.close("BBandLE", close < stopLossLow)
strategy.close("BBandSE", close > stopLossHigh)

// if(nz(strategy.position_size[1], 0) < 0 and close > stopLossHigh)
//     strategy.entry("BBandLE", strategy.long, comment="BBandLE")
// 	lastTradePrice := close
// 	stopLossLow := lastTradePrice * (1 - (stopLossFactor / 100))
// 	stopLossHigh := lastTradePrice * (1 + (stopLossFactor / 100))
// if(nz(strategy.position_size[1], 0) > 0 and close < stopLossLow)
//     strategy.exit("BBandSE", strategy.short, comment="BBandSE")
//     lastTradePrice := close
//     stopLossLow := lastTradePrice * (1 - (stopLossFactor / 100))
//     stopLossHigh := lastTradePrice * (1 + (stopLossFactor / 100))

plot(source, "close", color.blue)
plot(lower, "lower", color.red)
plot(upper, "upper", color.red)
plot(stopLossLow, "StopLossLow", color.black)
plot(stopLossHigh, "StopLossHigh", color.black)
plot(lastTradePrice, "lastTradePrice", color.green)
plotchar(strategy.position_size > 0, char="-", size=size.tiny, location=location.bottom, color=color.green)
plotchar(strategy.position_size < 0, char="-", size=size.tiny, location=location.bottom, color=color.red)
Detail
https://www.fmz.com/strategy/433013
Last Modified
2023-11-23 15:49:12