
9.5 KiB
Name
波林格带动态止盈策略-Dynamic-Take-Profit-Bollinger-Bands-Strategy
Author
ChaoZhang
Strategy Description
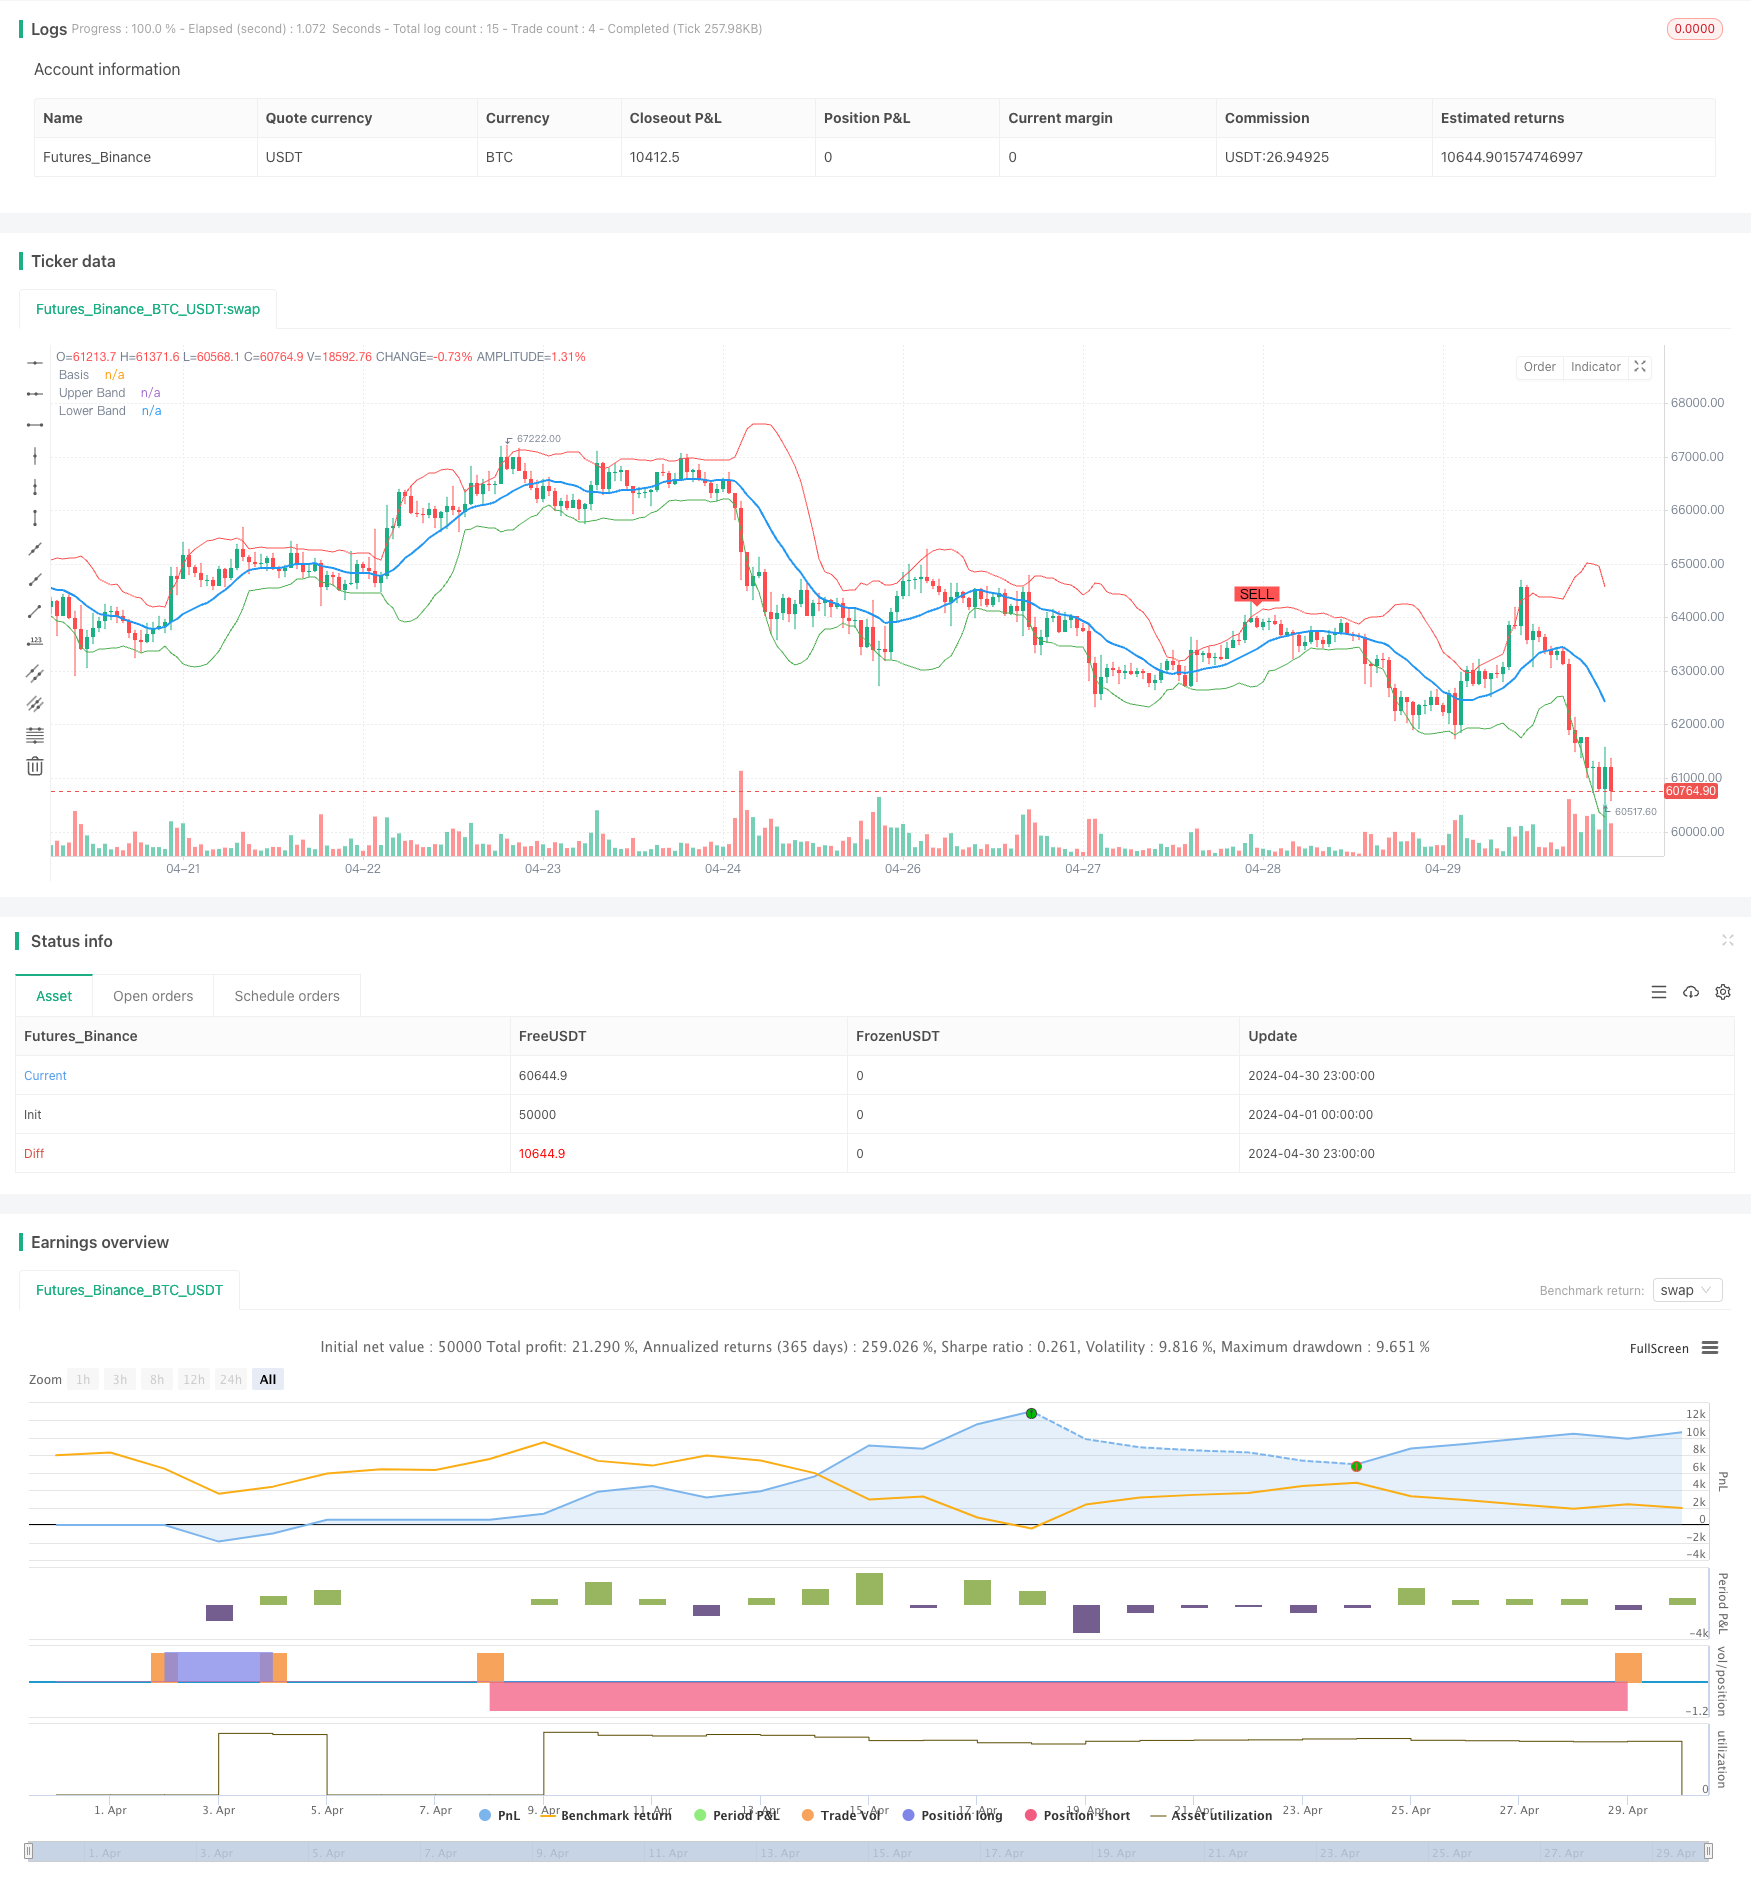
[trans]
概述
该策略利用波林格带(Bollinger Bands)指标,在价格触及上轨时做空,触及下轨时做多,并设置动态止盈位,当持仓达到1%的盈利就平仓。该策略的核心思想是价格总是在波林格带内波动,具有均值回归的特性,因此可以在价格偏离移动平均线过远时进行反向操作,博取价差收益。
策略原理
- 计算移动平均线和标准差:使用简单移动平均(SMA)计算收盘价的移动平均值(basis),然后计算收盘价相对移动平均线的标准差(dev)。
- 计算上轨和下轨:上轨(upper)为 basis + dev * multiplier,下轨(lower)为 basis - dev * multiplier,其中 multiplier 为波动幅度的倍数。
- 产生交易信号:当收盘价上穿下轨且当前收盘价小于开盘价时产生做多信号;当收盘价下穿上轨且当前收盘价大于开盘价时产生做空信号。
- 动态止盈:开仓后,根据开仓价和止盈比例(takeProfitPercentage)计算止盈价格,当价格达到止盈价时平仓。
- 可视化:在图表上绘制波林格带、移动平均线以及交易信号。
策略优势
- 简单有效:该策略逻辑清晰,只利用了一个技术指标,便于理解和实施。
- 适用性广:波林格带具有普适性,可以用于各种不同的交易标的和市场。
- 动态止盈:与固定止盈相比,动态止盈可以让盈利单的利润最大化,同时控制住风险。
- 有效把握趋势:在趋势行情中,价格触及上轨或下轨后,通常会沿原方向继续运行一段时间,该策略可以有效把握这种趋势机会。
策略风险
- 震荡市中表现不佳:当市场处于宽幅震荡、价格在波林格带内反复突破时,该策略可能会频繁出现交易信号,导致交易次数过多,手续费成本上升。
- 趋势行情中回撤较深:如果趋势持续时间很长,价格长期偏离均线,该策略逆势而为,回撤可能较深。
- 参数选择困难:波林格带的参数(如长度、倍数)对策略表现影响很大,但并没有放之四海而皆准的最优参数。
策略优化方向
- 结合趋势判断:在策略中加入趋势判断指标(如移动平均线),在趋势行情中可暂停交易,或者顺势交易。
- 优化止盈止损:可以根据ATR等波动率指标对止盈止损进行动态调整,以期获得更好的收益风险比。
- 多因子组合:考虑将波林格带与其他技术指标(如RSI、MACD等)结合使用,提高信号准确性,减少虚假信号。
- 基本面过滤:在产生交易信号后,可以通过基本面数据(如财报、行业数据等)进行二次确认,从而提高策略的稳健性。
总结
该策略利用波林格带构建了一个简单有效的交易系统,以价格触及上下轨为信号,同时采用动态止盈的方式控制风险。策略在趋势行情中表现较好,但在震荡市中可能面临频繁交易的问题。后续可以从趋势判断、止盈止损优化、因子组合、基本面过滤等方面对策略进行完善,以期获得更加稳健的收益。
||
Overview
This strategy utilizes the Bollinger Bands indicator to go short when the price touches the upper band and go long when it touches the lower band. It sets a dynamic take profit level and closes the position when it reaches 1% profit. The core idea is that the price always fluctuates within the Bollinger Bands and has a mean-reverting characteristic, so we can take reverse positions when the price deviates too far from the moving average to capture the price difference.
Strategy Principles
- Calculate the moving average and standard deviation: Use the Simple Moving Average (SMA) to calculate the moving average of the closing price (basis), and then calculate the standard deviation (dev) of the closing price relative to the moving average.
- Calculate the upper and lower bands: The upper band is basis + dev * multiplier, and the lower band is basis - dev * multiplier, where multiplier is a multiple of the volatility amplitude.
- Generate trading signals: When the closing price crosses above the lower band and the current close is less than the open, a long signal is generated; when the closing price crosses below the upper band and the current close is greater than the open, a short signal is generated.
- Dynamic take profit: After opening a position, calculate the take profit price based on the entry price and the take profit percentage. Close the position when the price reaches the take profit level.
- Visualization: Plot the Bollinger Bands, moving average, and trading signals on the chart.
Strategy Advantages
- Simple and effective: The strategy logic is clear and uses only one technical indicator, making it easy to understand and implement.
- Wide applicability: Bollinger Bands have universal applicability and can be used for various trading instruments and markets.
- Dynamic take profit: Compared to fixed take profit, dynamic take profit can maximize the profit of winning trades while controlling risk.
- Effectively capture trends: In trending markets, after the price touches the upper or lower band, it usually continues to move in the original direction for some time. This strategy can effectively seize such trend opportunities.
Strategy Risks
- Poor performance in ranging markets: When the market is in wide fluctuations and prices repeatedly break through the Bollinger Bands, the strategy may generate frequent trading signals, resulting in excessive trading and increased transaction costs.
- Deep retracements in trending markets: If a trend lasts for a long time and prices deviate from the moving average for an extended period, the strategy goes against the trend, potentially leading to deep retracements.
- Difficulty in parameter selection: The parameters of the Bollinger Bands (such as length and multiplier) have a significant impact on the strategy performance, but there are no universally optimal parameters.
Strategy Optimization Directions
- Incorporate trend analysis: Add trend identification indicators (such as moving averages) to the strategy. In trending markets, trading can be suspended or follow the trend.
- Optimize take profit and stop loss: Dynamically adjust the take profit and stop loss based on volatility indicators such as ATR to achieve a better risk-reward ratio.
- Multi-factor combination: Consider combining Bollinger Bands with other technical indicators (such as RSI, MACD, etc.) to improve signal accuracy and reduce false signals.
- Fundamental filtering: After generating trading signals, use fundamental data (such as financial reports, industry data, etc.) for secondary confirmation to enhance the robustness of the strategy.
Summary
This strategy constructs a simple and effective trading system using Bollinger Bands, taking the price touching the upper and lower bands as signals, and adopting dynamic take profit to control risk. The strategy performs well in trending markets but may face frequent trading issues in ranging markets. Further improvements can be made in terms of trend analysis, take profit and stop loss optimization, factor combination, and fundamental filtering to achieve more robust returns.
[/trans]
Source (PineScript)
/*backtest
start: 2024-04-01 00:00:00
end: 2024-04-30 23:59:59
period: 1h
basePeriod: 15m
exchanges: [{"eid":"Futures_Binance","currency":"BTC_USDT"}]
*/

//@version=5
strategy("Future Price Prediction", overlay=true)

// Ayarlar
length = input.int(14, "Length")
mult = input.float(2.0, "Multiplier")
showBands = input.bool(true, "Show Bands")
takeProfitPercentage = 1.0

// Ortalama ve Standart Sapma Hesaplamaları
basis = ta.sma(close, length)
dev = mult * ta.stdev(close, length)

// Üst ve Alt Bantlar
upper = basis + dev
lower = basis - dev

// Grafikte Gösterim
plot(basis, color=color.blue, linewidth=2, title="Basis")
plot(showBands ? upper : na, color=color.red, linewidth=1, title="Upper Band")
plot(showBands ? lower : na, color=color.green, linewidth=1, title="Lower Band")

// Al-Sat Sinyalleri
longCondition = ta.crossover(close[1], lower[1]) and close[1] < open[1]
shortCondition = ta.crossunder(close[1], upper[1]) and close[1] > open[1]

// Kar al seviyeleri
float longTakeProfit = na
float shortTakeProfit = na

if longCondition
    longTakeProfit := close * (1 + takeProfitPercentage / 100)
if shortCondition
    shortTakeProfit := close * (1 - takeProfitPercentage / 100)

// Strateji Giriş ve Çıkış
if longCondition
    strategy.entry("Buy", strategy.long)
    strategy.exit("Take Profit", from_entry="Buy", limit=longTakeProfit)

if shortCondition
    strategy.entry("Sell", strategy.short)
    strategy.exit("Take Profit", from_entry="Sell", limit=shortTakeProfit)

// Al-Sat Sinyalleri Grafikte Gösterim
plotshape(series=longCondition, title="Buy Signal", location=location.belowbar, color=color.green, style=shape.labelup, text="BUY")
plotshape(series=shortCondition, title="Sell Signal", location=location.abovebar, color=color.red, style=shape.labeldown, text="SELL")

// Bilgi Tablosu
var table data = table.new(position.bottom_right, 2, 2, frame_color=color.black, frame_width=1)
if barstate.islast
    table.cell(data, 0, 0, "Current Price", text_color=color.white)
    table.cell(data, 1, 0, str.tostring(close))
    table.cell(data, 0, 1, "Predicted Basis", text_color=color.white)
    table.cell(data, 1, 1, str.tostring(basis))
Detail
https://www.fmz.com/strategy/452360
Last Modified
2024-05-24 17:54:47