
7.1 KiB
Name
波动突破交易策略Volatility-Breakout-Trading-Strategy
Author
ChaoZhang
Strategy Description
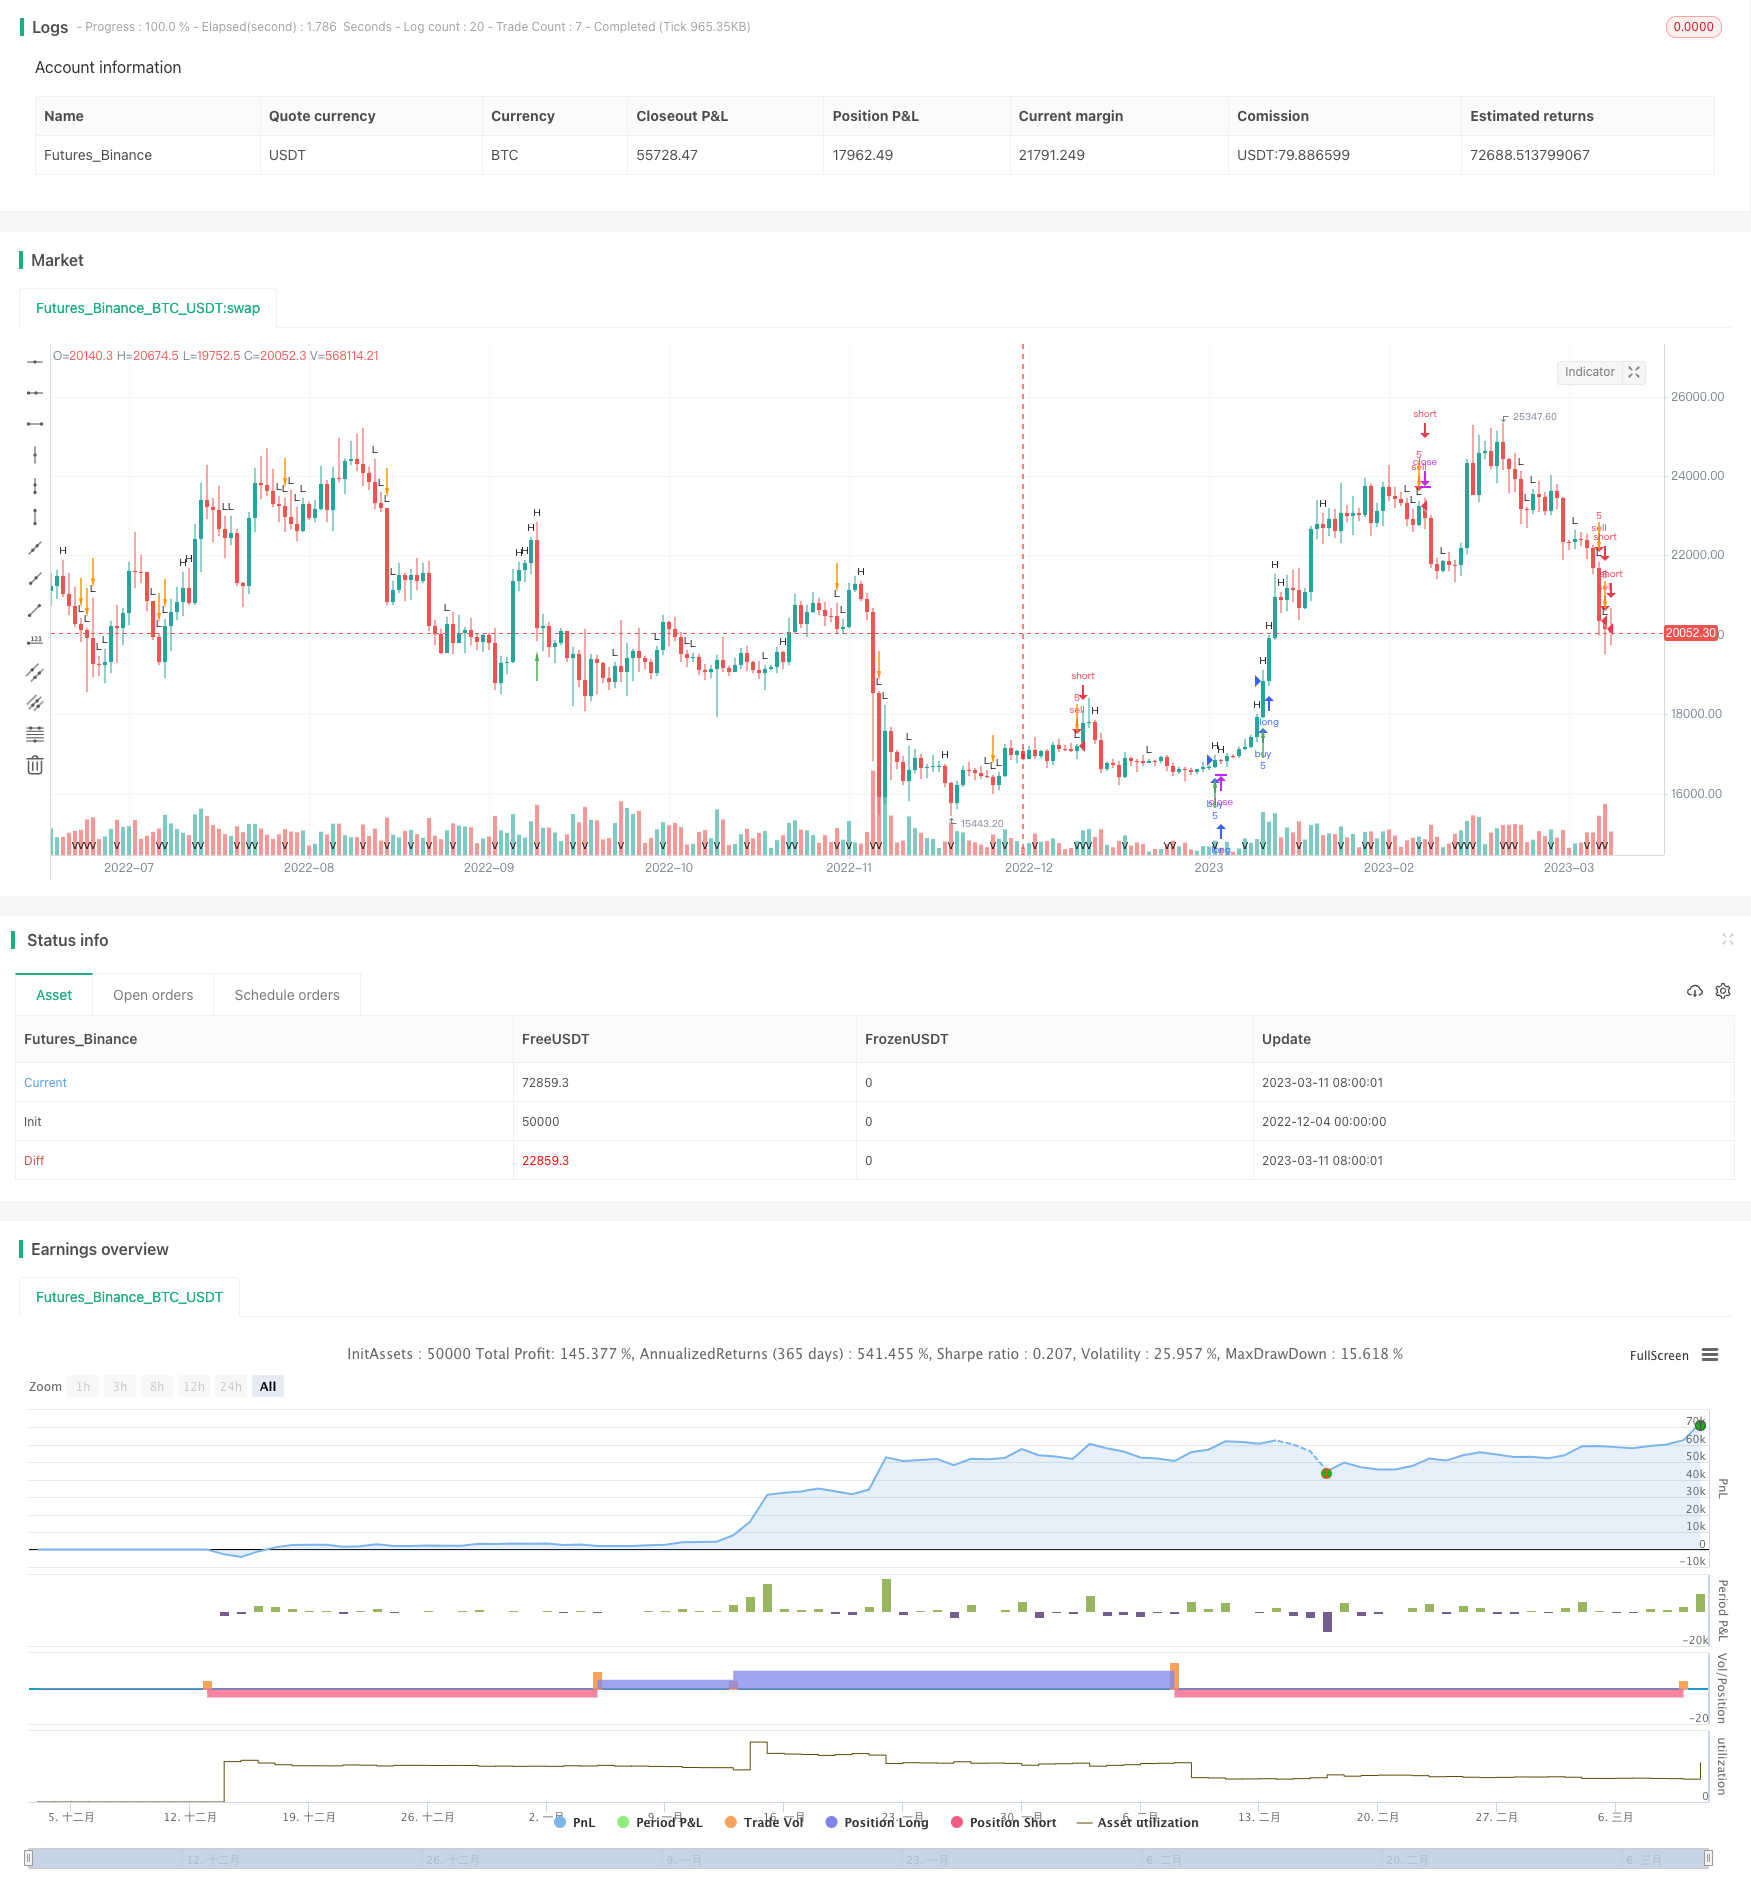 [trans]
概述
波动突破交易策略是一个基于单个价格行动的策略。它通过分析价格和成交量的变化来触发买入和卖出信号。这个策略还可以与警报结合使用,在其他交易所或系统中触发订单。
策略原理
该策略通过分析K线的收盘价、开盘价、最高价和最低价来判断价格走势和力度。
具体来说,它会分析最近3根K线的收盘价是否连续高于或低于开盘价。如果是,则表明价格在连续向上或向下突破,产生趋势性行情。
此外,该策略还会统计一定周期内的最大成交量。如果当前K线的成交量超过最近周期内的最大值,则说明成交量放大,反映出巨大的交易力量进入市场。
在价格产生三根连续突破K线和成交量放大的同时,该策略便会产生买入或卖出信号。
策略优势
这是一个利用价格行动和交易量信号的简单有效策略。其主要优势有:
- 原理清晰,易于理解和实现
- 对突发性行情高度敏感,能及时捕捉市场变化
- 只需分析基本的K线和成交量数据,无需复杂算法
- 可以灵活地调整参数,适应不同品种和周期
- 成本低廉,适合中小本金的投资者
风险分析
该策略也存在一些潜在风险:
- 无法对价格走势进行预判,存在一定的盲目性
- 对错触发信号较为敏感,可能增加无谓交易
- 在盘整行情中容易产生错误信号
- 没有止损措施,存在亏损扩大的风险
为控制这些风险,可以考虑加入移动止损,优化参数组合,或与其他指标或策略组合使用。
优化方向
这是一个基础策略,还有很大的优化空间,主要方向有:
- 增加止损策略,以控制亏损
- 优化参数,适应更多品种和周期
- 加入其它指标过滤信号
- 与趋势跟踪策略组合,实现趋势自动调整
- 结合机器学习算法,实现动态参数与信号优化
- 增加量化研究与反馈模块,使策略不断进化与优化
总结
本策略整体来说是一个非常实用的基于价格行动理念的策略。它具有 participating、容易理解、实施成本低等优点。同时也存在一定的盲目性,需要进一步优化与组合来实现更好的策略增强。总的来说这是一个非常有价值的策略思路,值得深入研究与应用。
||
Overview
The Volatility Breakout Trading Strategy is a single price action based strategy. It generates buy and sell signals by analyzing price and volume changes. This strategy can also be combined with alerts to trigger orders on other exchanges or systems.
Strategy Logic
This strategy analyzes the close, open, high and low prices of candlesticks to determine price trends and momentum.
Specifically, it checks if the closing prices of the most recent 3 candlesticks are continuously higher or lower than the opening prices. If so, it indicates prices are breaking out up or down consecutively, generating a trending market.
In addition, this strategy tracks the maximum volume over a certain period. If the current candlestick's volume exceeds the maximum value over the recent period, it suggests surging trading volume and strong forces entering the market.
When price breaks out on three consecutive candlesticks and trading volume expands, the strategy will produce buy or sell signals.
Advantages
This is a simple yet effective strategy utilizing price action and volume signals. The main advantages are:
- Clear logic, easy to understand and implement
- Highly sensitive to volatile market changes, catching shifts timely
- Requires only basic candlestick and volume data, no complex algorithms
- Flexible parameters adaptable to different products and timeframes
- Low cost, suitable for small account investors
Risk Analysis
There are also some potential risks:
- No price forecasting, some blindness exists
- Prone to false signals from accidental touches
- May generate improper signals in range-bound markets
- No stop loss mechanism, risks expanding losses
To mitigate these risks, one may consider adding moving stop loss, optimizing parameter combinations, or combining with other indicators or strategies.
Optimization Directions
As a basic strategy, there is still large room for optimization:
- Add stop loss mechanisms to control losses
- Optimize parameters to suit more products and periods
- Add other indicators to filter signals
- Combine with trend tracking strategies for automatic trend adjustment
- Incorporate machine learning algorithms for dynamic parameter and signal optimization
- Build in quantitative research and feedback modules for continuous evolution
Conclusion
In conclusion, this is a very practical price action based strategy. It has the merits of being intuitive, easy to understand and implement at low costs. Meanwhile, it also has certain blindness and needs further optimizations and combinations for enhanced performance. Overall this is a valuable strategy concept worthy of in-depth research and application.
[/trans]
Strategy Arguments
| Argument | Default | Description |
|---|---|---|
| v_input_1 | 3 | Volume length |
Source (PineScript)
/*backtest
start: 2022-12-04 00:00:00
end: 2023-03-12 00:00:00
period: 1d
basePeriod: 1h
exchanges: [{"eid":"Futures_Binance","currency":"BTC_USDT"}]
*/

//@version=4
strategy("SPAS", overlay=true, pyramiding=5, calc_on_order_fills=true)

int signal_hh = 0
int signal_ll = 0

if close[1] >= open[1] and close[2] >= open[2] and close[3] >= open[3]
    signal_hh := 1

if close[1] <= open[1] and close[2] <= open[2] and close[3] <= open[3]
    signal_ll := 1

plotchar(signal_hh, char='H', size=size.tiny, location=location.abovebar)
plotchar(signal_ll, char='L', size=size.tiny, location=location.abovebar)

int signal_vol = 0
float max_volume = 0.0
int vol_length = input(title="Volume length", type=input.integer, defval=3)

for i = vol_length to 1
    if volume[i] > max_volume
        max_volume := volume[i]

if volume[0] > max_volume
    signal_vol := 1

plotchar(signal_vol, char='V', size=size.tiny, location=location.bottom)

int signal_buy = 0
int signal_sell = 0

if signal_hh and signal_vol
    signal_buy := 1
    label.new(bar_index, high, "B", color=color.green)
    strategy.entry("buy", strategy.long, 5)//, when=strategy.position_size <= 0)

if signal_ll and signal_vol
    signal_sell := 1
    label.new(bar_index, low, "S", color=color.red)
    strategy.entry("sell", strategy.short, 5)//, when=strategy.position_size > 0)

//plotchar(signal_buy, char='B', color=color.green, size=size.tiny, location=location.abovebar)
plotarrow(signal_buy, colorup=color.green, colordown=color.orange, transp=0, maxheight=20)

//plotchar(signal_sell, char='S', color=color.red, size=size.tiny, location=location.abovebar)
plotarrow(signal_sell * -1, colorup=color.green, colordown=color.orange, transp=0, maxheight=20)
Detail
https://www.fmz.com/strategy/434975
Last Modified
2023-12-11 14:20:48