
7.6 KiB
Name
波动尖峰指标智能交易策略-Volatility-Spike-Indicator-Smart-Trading-Strategy
Author
ianzeng123
Strategy Description
[trans]
概述
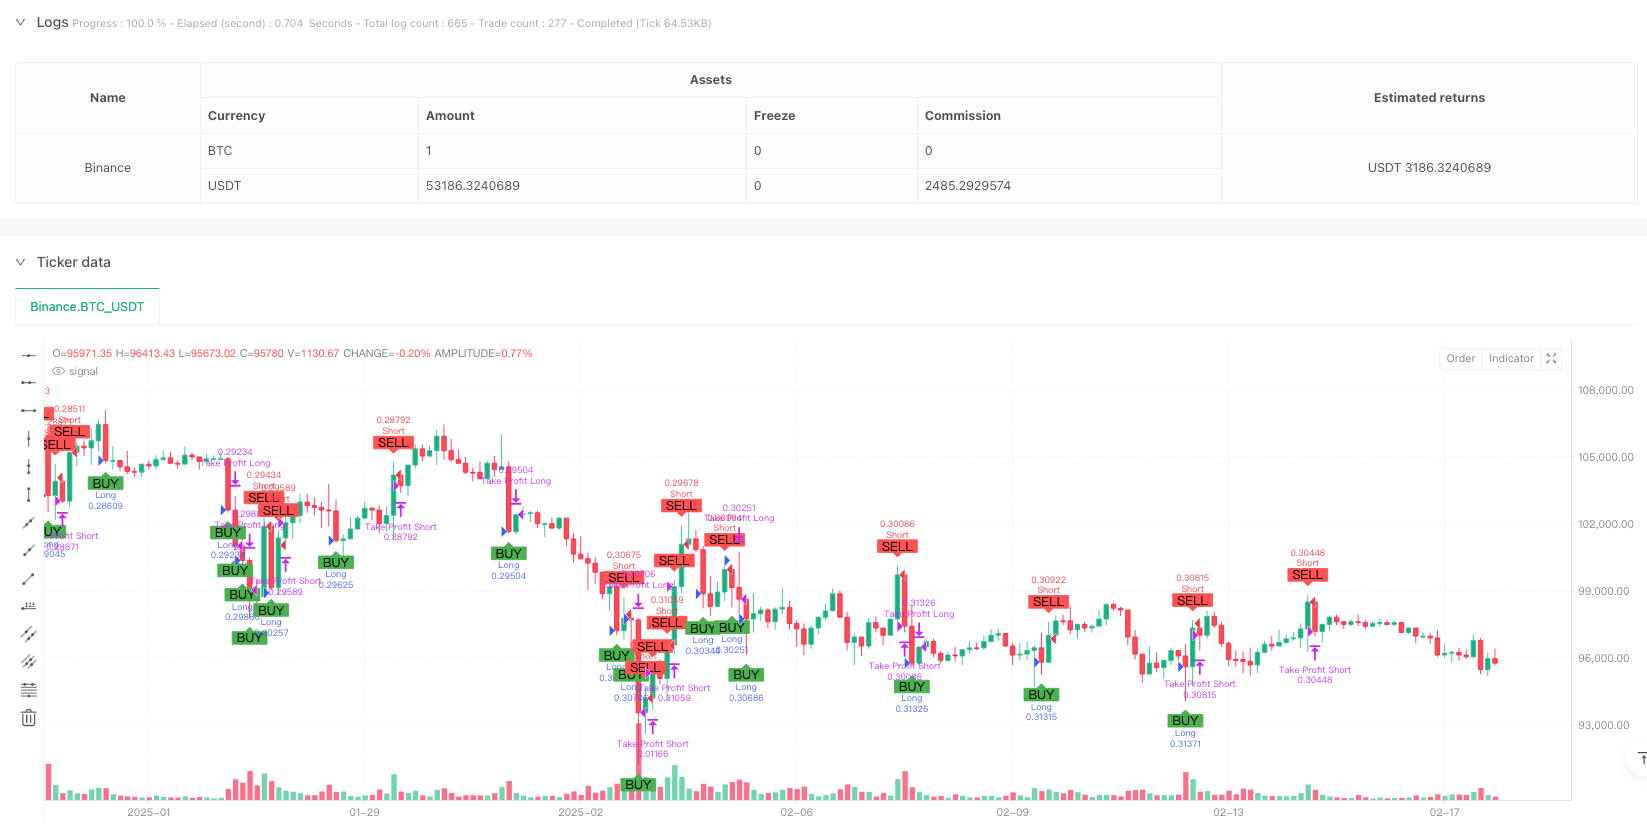
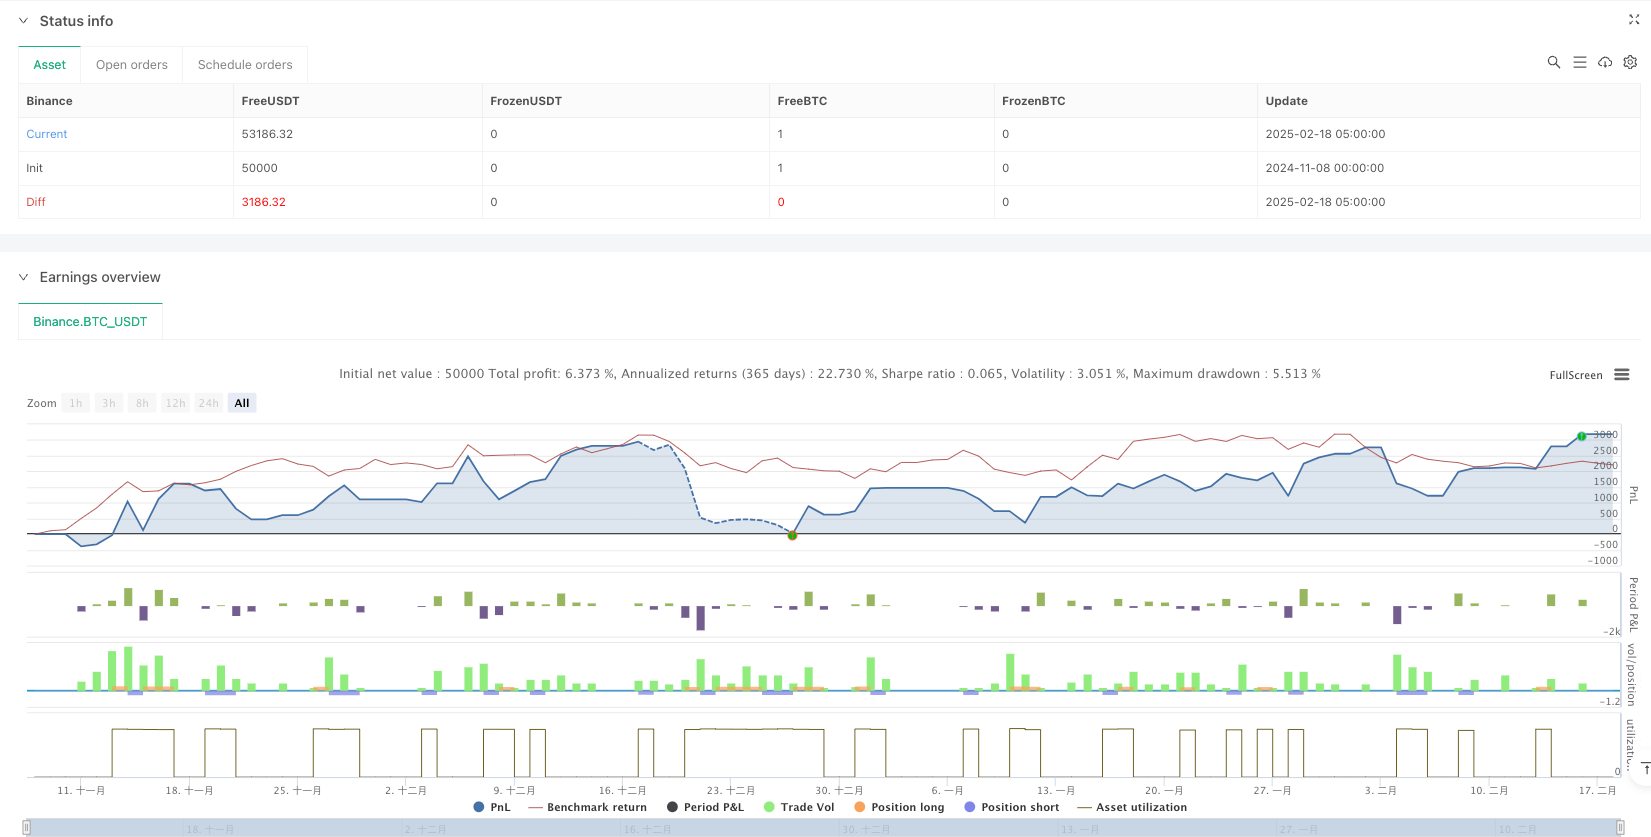
本策略是一个基于价格波动尖峰识别的智能交易系统。策略通过监测1小时K线图上的价格波动,当出现显著的上涨或下跌尖峰时触发交易信号。系统采用固定投资金额30,000 USDT,并根据当前市场价格自动计算交易数量,实现资金的最优配置。
策略原理
策略的核心是通过detect_spike函数识别价格波动尖峰。当价格出现大于0.62%的波动时,系统判定为有效的交易信号。具体包括:
- 上涨尖峰判定:当(最高价-收盘价)/收盘价 >= 0.62%
- 下跌尖峰判定:当(收盘价-最低价)/收盘价 >= 0.62% 策略采用固定止盈率0.42%和止损率1%,在触发信号后自动执行交易并设置相应的止盈止损位。
策略优势
- 信号明确:通过严格的数学模型计算波动尖峰,交易信号清晰客观
- 风险可控:采用固定止损和止盈比例,有效控制每笔交易的风险
- 资金管理优化:使用固定投资金额并动态计算交易数量,提高资金利用效率
- 自动化程度高:系统自动识别信号、执行交易、管理持仓,减少人为干预
- 适应性强:策略参数可根据市场情况进行优化调整
策略风险
- 市场波动风险:在剧烈波动市场中可能出现虚假信号
- 滑点风险:实际成交价格可能与信号价格存在偏差
- 流动性风险:大额交易可能面临流动性不足问题
- 技术风险:系统运行可能受到网络延迟等技术因素影响
策略优化方向
- 引入多周期确认:结合多个时间周期的信号进行交叉验证
- 优化参数动态调整:根据市场波动率自适应调整策略参数
- 增加市场情绪指标:引入交易量、趋势强度等辅助指标
- 完善风险控制:增加回撤控制、持仓时间限制等风控手段
- 优化资金管理:引入动态仓位管理和复利机制
总结
该策略通过严谨的数学模型识别市场机会,结合完善的风险控制体系,实现稳健的交易收益。策略具有良好的可扩展性和优化空间,通过持续改进可以适应不同市场环境,是一个具有实用价值的量化交易策略。 ||
Overview
This strategy is an intelligent trading system based on price volatility spike detection. The strategy monitors price movements on the 1-hour candlestick chart and triggers trading signals when significant upward or downward spikes occur. The system uses a fixed investment amount of 30,000 USDT and automatically calculates trading quantities based on current market prices to achieve optimal capital allocation.
Strategy Principle
The core of the strategy is to identify price volatility spikes through the detect_spike function. When price movement exceeds 0.62%, the system determines it as a valid trading signal. Specifically includes:
- Bullish spike determination: when (high price - closing price)/closing price >= 0.62%
- Bearish spike determination: when (closing price - low price)/closing price >= 0.62% The strategy adopts a fixed take-profit rate of 0.42% and stop-loss rate of 1%, automatically executing trades and setting corresponding profit and loss levels after triggering signals.
Strategy Advantages
- Clear signals: Calculates volatility spikes through strict mathematical models, providing clear and objective trading signals
- Controlled risk: Uses fixed stop-loss and take-profit ratios to effectively control risk for each trade
- Optimized capital management: Uses fixed investment amounts and dynamically calculates trading quantities for improved capital efficiency
- High automation: System automatically identifies signals, executes trades, and manages positions, reducing human intervention
- Strong adaptability: Strategy parameters can be optimized and adjusted according to market conditions
Strategy Risks
- Market volatility risk: False signals may occur in highly volatile markets
- Slippage risk: Actual execution prices may deviate from signal prices
- Liquidity risk: Large trades may face insufficient liquidity issues
- Technical risk: System operation may be affected by network latency and other technical factors
Strategy Optimization Directions
- Introduce multi-period confirmation: Cross-validate signals using multiple time periods
- Optimize parameter dynamic adjustment: Adaptively adjust strategy parameters based on market volatility
- Add market sentiment indicators: Incorporate auxiliary indicators such as trading volume and trend strength
- Improve risk control: Add drawdown control, position time limits and other risk management measures
- Optimize capital management: Introduce dynamic position management and compound interest mechanisms
Summary
The strategy identifies market opportunities through rigorous mathematical models and combines a comprehensive risk control system to achieve stable trading returns. The strategy has good scalability and optimization potential, and through continuous improvement can adapt to different market environments, making it a practical quantitative trading strategy.[/trans]
Source (PineScript)
/*backtest
start: 2024-11-08 00:00:00
end: 2025-02-18 08:00:00
period: 3h
basePeriod: 3h
exchanges: [{"eid":"Binance","currency":"BTC_USDT"}]
*/

//@version=6
strategy("Spike Strategy 1h Optimized", overlay=true, margin_long=100, margin_short=100, default_qty_type=strategy.percent_of_equity, default_qty_value=100)

// Fixed investment amount per trade (30,000 USDT)
fixed_investment = 30000

// Optimized parameters
spike_threshold = 0.62 // Spike threshold (0.80%)
profit_target = 0.42 // Take profit (0.48%)
stop_loss = 1  // Stop loss (10%)

// Function to detect spikes
detect_spike(threshold, close_price, high_price, low_price) =>
    spike_up = (high_price - close_price) / close_price >= threshold / 100   // Bullish spike (high - close)
    spike_down = (close_price - low_price) / close_price >= threshold / 100  // Bearish spike (close - low)
    [spike_up, spike_down]

// Detecting spikes
[spike_up, spike_down] = request.security(syminfo.tickerid, "60", detect_spike(spike_threshold, close, high, low))

// Entry conditions
long_condition = spike_up and not spike_down  // Only bullish spikes
short_condition = spike_down and not spike_up // Only bearish spikes

// Calculate the quantity to invest based on the current price
qty_long = fixed_investment / close
qty_short = fixed_investment / close

// Executing the orders
if (long_condition)
    strategy.entry("Long", strategy.long, qty=qty_long)

if (short_condition)
    strategy.entry("Short", strategy.short, qty=qty_short)

// Exiting orders with take profit and stop loss
if (strategy.position_size > 0)
    strategy.exit("Take Profit Long", "Long", limit=strategy.position_avg_price * (1 + profit_target / 100), stop=strategy.position_avg_price * (1 - stop_loss / 100))

if (strategy.position_size < 0)
    strategy.exit("Take Profit Short", "Short", limit=strategy.position_avg_price * (1 - profit_target / 100), stop=strategy.position_avg_price * (1 + stop_loss / 100))

// Plot spikes (optional)
plotshape(series=long_condition, title="Long Spike", location=location.belowbar, color=color.green, style=shape.labelup, text="BUY")
plotshape(series=short_condition, title="Short Spike", location=location.abovebar, color=color.red, style=shape.labeldown, text="SELL")
Detail
https://www.fmz.com/strategy/482817
Last Modified
2025-02-27 17:43:22