
16 KiB
Name
比特币动量跟踪止损策略Bitcoin-Momentum-Trailing-Stop-Strategy
Author
ChaoZhang
Strategy Description
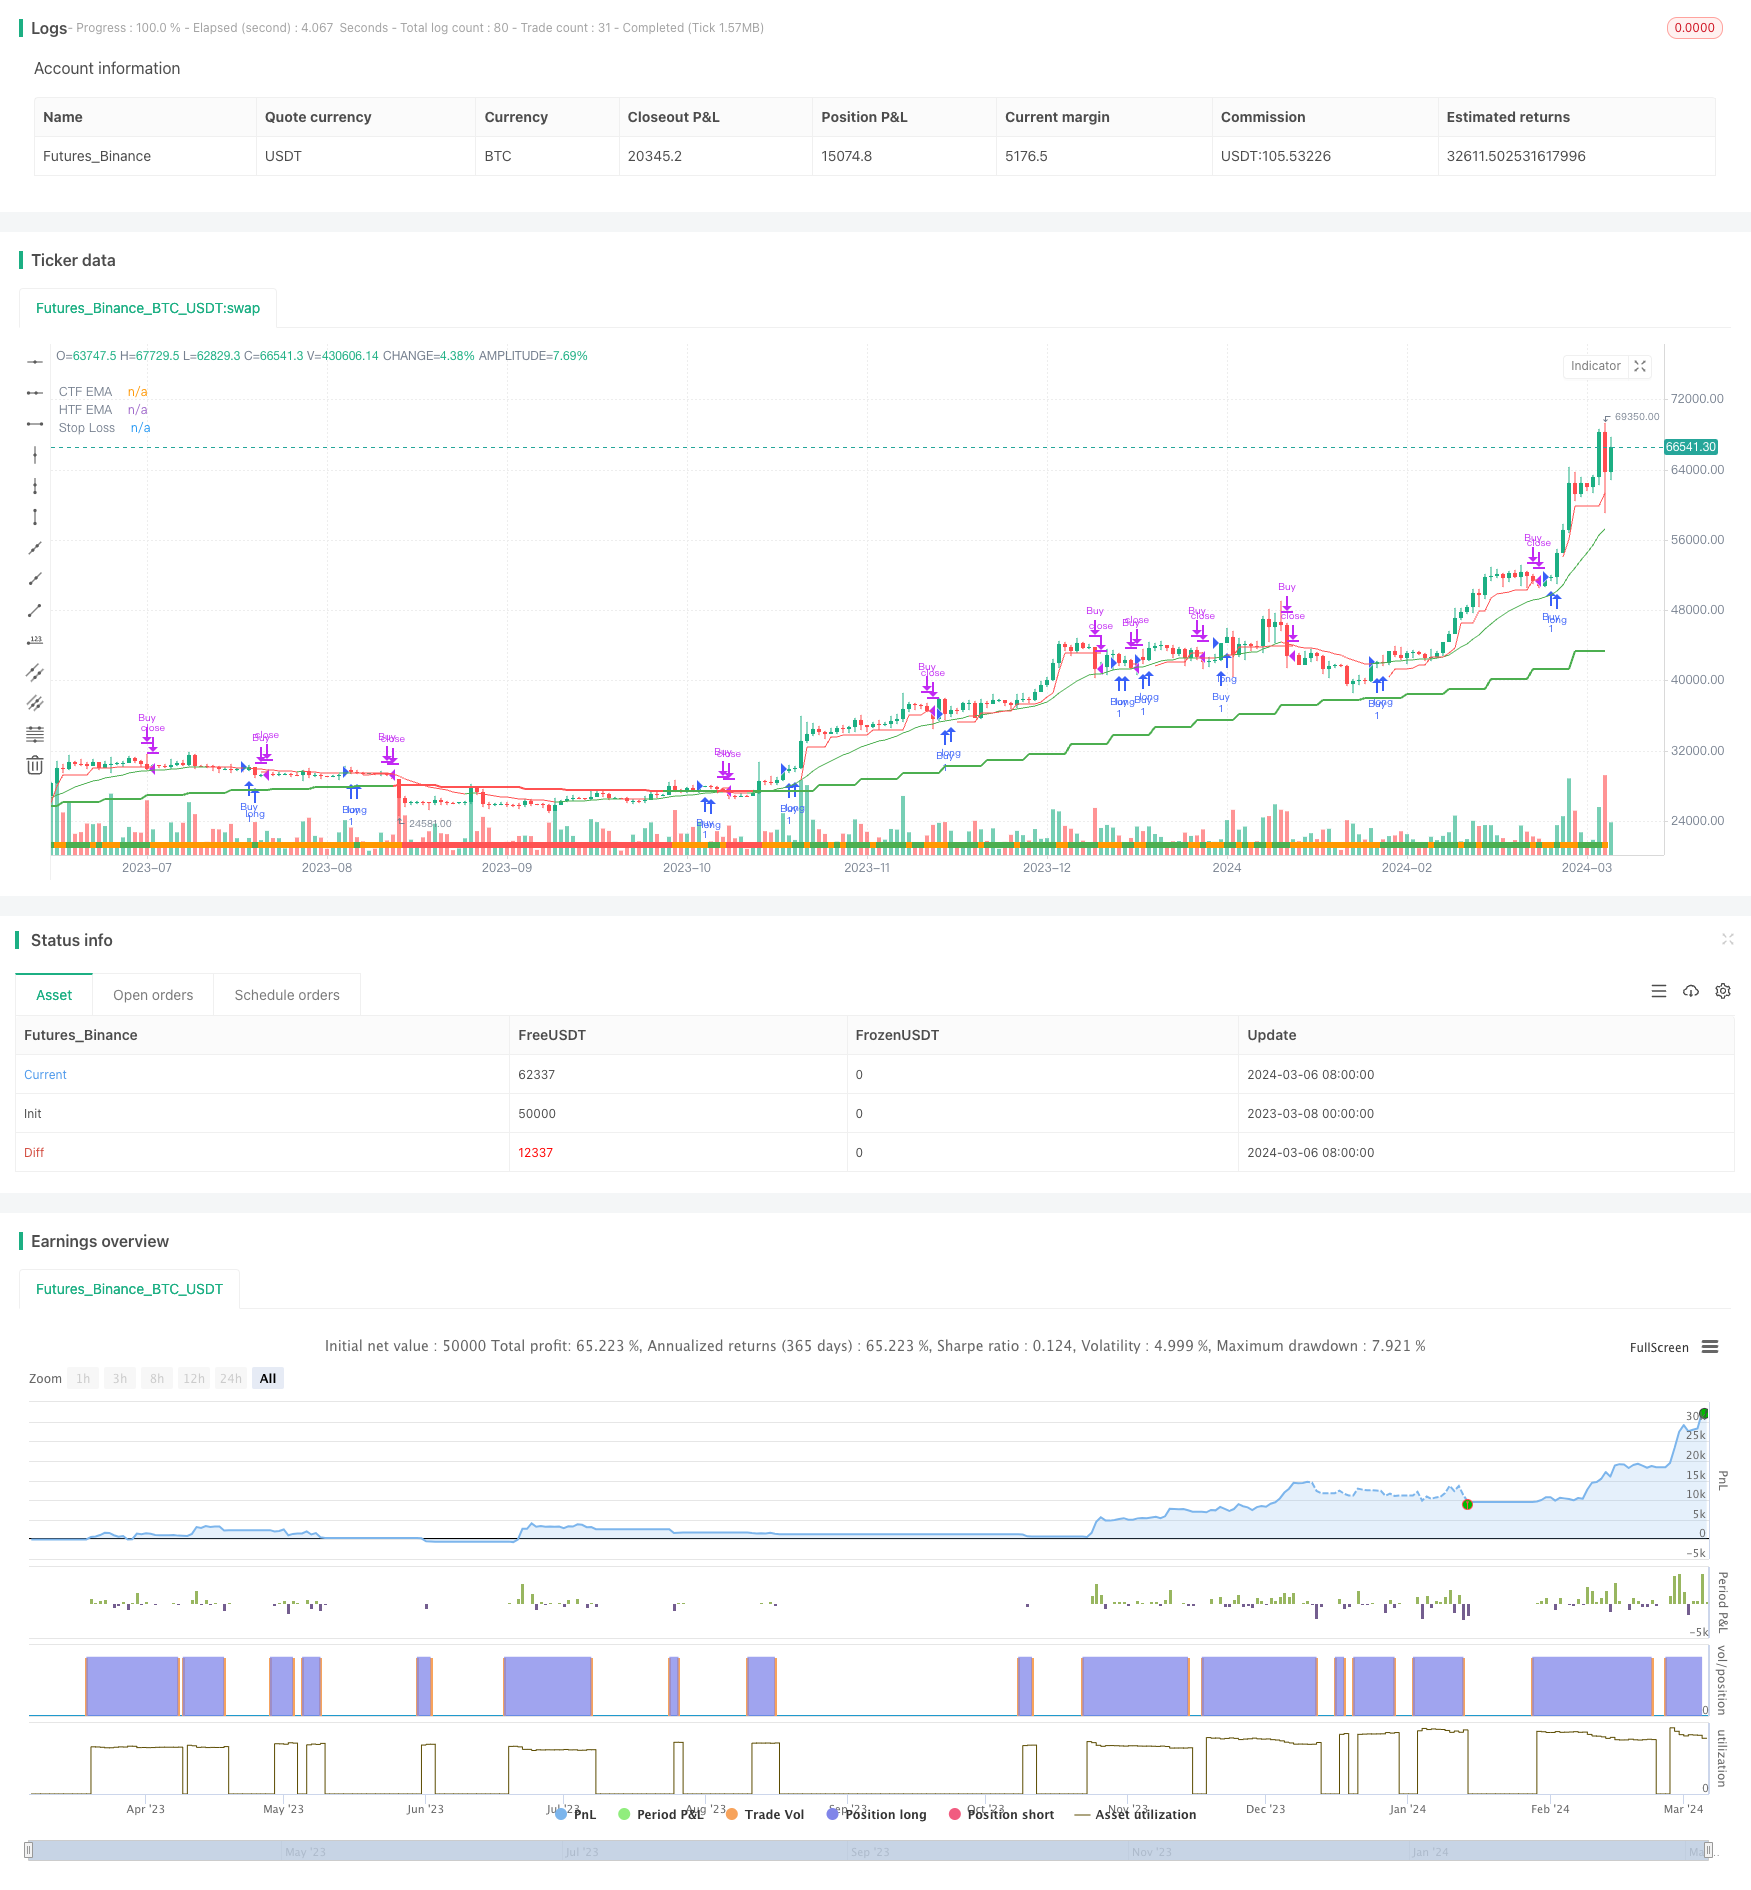 [trans]
策略概述
比特币动量跟踪止损策略是一种基于动量的长仓策略,旨在捕捉比特币的上涨趋势,同时通过动态调整止损来规避下跌风险。该策略使用了简单而巧妙的动量跟踪止损技术,在高度看跌的波动期内收紧止损以保护敞口利润,而在持续看涨的动量期间放宽止损以让利润奔跑。只要比特币价格高于20周均线(EMA),该策略就会一直持仓,当价格跌破20周均线时就会平仓止损。该策略只交易一个头寸,不做空,但如果你知道自己在做什么,可以很容易地调整它来做任何你喜欢的事情。
策略原理
- 比特币当前价格必须高于高级别时间框架的EMA(20周EMA)
- 比特币不能处于"警戒"状态,即比特币最近的波峰减去当前K线的最低价大于1.5倍的ATR,或者当日收盘价低于当日20EMA
- 止损设置为最近波峰减去1个ATR,如果处于警戒状态,则减去ATR的20%(即0.2 ATR)
- 当价格收盘低于止损价时,在下一根K线开盘平仓
该策略使用周线图表和20周EMA作为趋势过滤器,只在价格高于20周EMA时入场。5周期ATR用于动态调整跟踪止损的距离,在警戒状态下会收紧止损。警戒状态通过两个条件定义:近期波峰到当前最低价的距离大于1.5倍ATR,或者当日收盘价低于当日20EMA。这种动态止损调整方法可以在趋势强劲时给予更大的回撤空间,在趋势减弱时快速锁定利润。
策略优势
-
简单有效:该策略逻辑简单清晰,容易理解和实施,同时能够有效捕捉比特币的主要上涨趋势。
-
动态止损:根据市场波动状况动态调整止损位置,既能控制回撤,又能让利润奔跑,是一种较为平衡和稳健的止损方法。
-
趋势过滤:通过高级别均线(20周EMA)过滤,只在明确的上涨趋势中入场,大大提高了策略胜率和盈亏比。
-
仓位管理:默认全仓交易,能够最大程度地利用资金,提高资金利用效率。同时也可灵活调整仓位大小。
-
适用性广:该策略逻辑可以方便地移植到其他标的和市场中,具有较好的通用性。
策略风险
-
参数适用性:该策略参数是基于比特币市场的特点设置的,对其他市场的适用性有待验证,可能需要针对不同标的进行参数优化。
-
趋势识别:该策略主要依赖高级别EMA和ATR等技术指标判断趋势,对行情的把握不如基本面分析全面,在市场转折点容易出现失误。
-
止损风险:虽然动态止损可以一定程度上控制风险,但在极端行情下(如暴跌或快速深幅震荡),仍可能出现较大的回撤。而且止损位比较靠近,在震荡行情中可能会频繁止损。
-
盈利空间:策略在单边上涨趋势中表现出色,但在震荡市更容易陷入频繁止损的困境,整体盈利空间可能有限。
-
实盘表现:该策略在回测中表现良好,但实盘受到滑点、手续费等因素影响,可能与理论收益存在一定差距,需谨慎评估。
优化方向
-
趋势判断:可以尝试引入更多高级别均线、波动率指标甚至基本面数据,提高趋势识别的准确性和可靠性。
-
动态参数:止损位和ATR参数可以进一步优化,引入与价格或波动率相关的动态调整机制,以适应不同的市场状态。
-
仓位管理:可以根据趋势强度、波动率等指标,动态调整仓位大小,在趋势强劲时加大仓位,在高波动率时减小仓位,提高收益风险比。
-
多空机制:在熊市中引入做空机制,扩大策略的适用范围和潜在盈利空间。但需要重新设计入场、止损等规则。
-
组合策略:将该策略与其他策略(如反转、均值回归等)进行组合,互补优势,提高策略稳定性和盈利能力。
策略总结
比特币动量跟踪止损策略是一个简单有效的动量策略,它利用高级别均线和ATR指标,捕捉比特币强劲的上涨趋势,并通过动态调整止损的方式控制下行风险。该策略逻辑清晰,易于实施和优化,适用于追求稳健收益的中长线投资者。但在震荡市中表现一般,整体盈利空间有限。 该策略可以作为一个基础模板,投资者可以根据自己的需求和经验,在趋势判断、参数优化、仓位管理、多空机制等方面进一步完善,或与其他策略进行组合,以期获得更高的收益风险比。但需要注意,该策略在实盘中的表现可能与回测结果存在差异,需要谨慎评估和控制风险。任何策略在使用前都需要进行充分的历史数据回测和模拟交易,并根据市场变化进行动态调整。
||
Strategy Overview
The Bitcoin Momentum Trailing Stop Strategy is a long-only momentum-based strategy designed to capture Bitcoin's uptrends while mitigating downside risk through dynamically adjusted stop-losses. The strategy employs a simple yet clever momentum trailing stop technique, which tightens the stop-loss during highly bearish volatility to protect open profits and loosens the stop-loss during sustained bullish momentum to let profits run. The strategy remains invested as long as the Bitcoin price is above the 20-week exponential moving average (EMA) and exits when the price closes below it. It trades only one position and does not short, but it can be easily tweaked to do whatever you like if you know what you're doing.
Strategy Principle
- Bitcoin's current price must be trading above the higher-timeframe EMA (20-week EMA).
- Bitcoin must not be in a "caution" state, defined as the recent swing high minus the current bar's low being greater than 1.5 times the ATR, or the daily close being lower than the daily 20 EMA.
- The stop-loss is set at the recent swing high minus 1 ATR, or minus 20% of the ATR (i.e., 0.2 ATR) if in the caution state.
- Exit on the next bar's open when the price closes below the stop-loss.
The strategy uses the weekly chart and the 20-week EMA as a trend filter, only entering when the price is above the 20-week EMA. A 5-period ATR is used to dynamically adjust the distance of the trailing stop, which tightens in the caution state. The caution state is defined by two conditions: the distance from the recent swing high to the current low being greater than 1.5 times the ATR, or the daily close being below the daily 20 EMA. This dynamic stop-loss adjustment approach allows for greater pullback room when the trend is strong and quickly locks in profits when the trend weakens.
Strategy Advantages
-
Simplicity and effectiveness: The strategy logic is simple, clear, easy to understand and implement, while effectively capturing Bitcoin's major uptrends.
-
Dynamic stop-loss: The stop-loss position is dynamically adjusted based on market volatility conditions, controlling drawdowns while letting profits run, which is a relatively balanced and robust approach to stop-loss management.
-
Trend filtering: By filtering with a higher-level moving average (20-week EMA), the strategy only enters during clear uptrends, greatly improving the strategy's win rate and risk-reward ratio.
-
Position sizing: The default is to trade with a full position, maximizing capital utilization and improving capital efficiency. Position size can also be flexibly adjusted.
-
Wide applicability: The strategy logic can be easily ported to other assets and markets, having good generalizability.
Strategy Risks
-
Parameter applicability: The strategy parameters are set based on the characteristics of the Bitcoin market, and their applicability to other markets needs to be validated and may require parameter optimization for different assets.
-
Trend identification: The strategy mainly relies on technical indicators such as higher-level EMAs and ATRs to judge trends, which is not as comprehensive as fundamental analysis in grasping market conditions and is prone to errors at market turning points.
-
Stop-loss risk: Although dynamic stop-losses can control risk to a certain extent, significant drawdowns may still occur in extreme market conditions (such as sharp drops or rapid deep fluctuations). Moreover, the stop-loss position is relatively tight, which may lead to frequent stop-outs in choppy markets.
-
Profit potential: The strategy performs well in unidirectional uptrends but is more likely to fall into the dilemma of frequent stop-losses in rangebound markets, potentially limiting overall profit potential.
-
Live performance: While the strategy performs well in backtesting, live trading is affected by factors such as slippage and commissions, and actual results may differ from theoretical returns, requiring careful evaluation.
Optimization Directions
-
Trend determination: Consider introducing more higher-level moving averages, volatility indicators, or even fundamental data to improve the accuracy and reliability of trend identification.
-
Dynamic parameters: Stop-loss positions and ATR parameters can be further optimized by introducing dynamic adjustment mechanisms related to price or volatility to adapt to different market states.
-
Position sizing: Dynamically adjust position size based on indicators such as trend strength and volatility, increasing position size when the trend is strong and reducing position size during high volatility to improve the risk-reward ratio.
-
Long/short mechanism: Introduce a short-selling mechanism in bear markets to expand the strategy's applicability and potential profitability. However, entry and stop-loss rules need to be redesigned.
-
Strategy combination: Combine this strategy with other strategies (such as mean reversion) to complement each other's strengths and improve strategy stability and profitability.
Strategy Summary
The Bitcoin Momentum Trailing Stop Strategy is a simple and effective momentum strategy that captures Bitcoin's strong uptrends using higher-level moving averages and ATR indicators while controlling downside risk through dynamically adjusted stop-losses. The strategy logic is clear, easy to implement and optimize, and suitable for medium to long-term investors seeking steady returns. However, it performs averagely in rangebound markets with limited overall profit potential. This strategy can serve as a basic template, and investors can further refine it based on their own needs and experience in areas such as trend determination, parameter optimization, position management, and long/short mechanisms, or combine it with other strategies to achieve a higher risk-reward ratio. However, it should be noted that the live performance of the strategy may differ from backtesting results, requiring careful risk assessment and control. Any strategy should be thoroughly backtested on historical data and forward tested before use, and dynamically adjusted based on market changes. [/trans]
Strategy Arguments
| Argument | Default | Description |
|---|---|---|
| v_input_timeframe_1 | W | (?G_STRATEGY)Higher Timeframe |
| v_input_int_1 | 20 | EMA Length |
| v_input_int_2 | 5 | ATR Length |
| v_input_source_1_low | 0 | (?G_EXIT)Trail Stop Source: low |
| v_input_int_3 | 7 | Trail Stop Lookback |
| v_input_float_1 | 0.2 | Trailing Stop Ratchet Multiplier |
| v_input_1 | timestamp(01 Jan 2000 13:30 +0000) | (?G_FILTER)Start Filter |
| v_input_2 | timestamp(1 Jan 2099 19:30 +0000) | End Filter |
Source (PineScript)
/*backtest
start: 2023-03-08 00:00:00
end: 2024-03-07 00:00:00
period: 1d
basePeriod: 1h
exchanges: [{"eid":"Futures_Binance","currency":"BTC_USDT"}]
*/

// This source code is subject to the terms of the Mozilla Public License 2.0 at https://mozilla.org/MPL/2.0/
// © ZenAndTheArtOfTrading
// ------------------------------------------------------------------------------------------------------
// System Concept: Capture as much Bitcoin upside volatility as possible while side-stepping downside volatility.
//  Entry Rule #1: Bitcoin must be trading above higher-timeframe EMA (Weekly 20 EMA)
//  Entry Rule #2: Bitcoin must not be in 'caution' condition
//      -> Caution: True if BTC's recent swing high minus its current low is > 1.5x ATR OR close < Daily EMA
//  Trailing Stop: Stop is trailed 1 ATR from recent swing high, OR 20% of ATR if in caution condition
// ------------------------------------------------------------------------------------------------------
// @version=5
strategy("Bitcoin Momentum Strategy",
     overlay=true)

// Get user input
var const string    G_STRATEGY  = "Strategy Entry Settings"
var const string    G_EXIT      = "Strategy Exit Settings"
var const string    G_FILTER    = "Strategy Filters"
i_HigherTimeframe   = input.timeframe("W", "Higher Timeframe", group=G_STRATEGY, tooltip="Higher timeframe MA reference")
i_EmaLength         = input.int(20, "EMA Length", group=G_STRATEGY, tooltip="Moving average period length")
i_AtrLength         = input.int(5, "ATR Length", group=G_STRATEGY, tooltip="ATR period length")
i_TrailStopSource   = input.source(low, "Trail Stop Source", group=G_EXIT, tooltip="Lowest price source for trailing stop")
i_TrailStopLookback = input.int(7, "Trail Stop Lookback", group=G_EXIT, tooltip="How many bars to look back for trailing price source")
i_TrailStopMulti    = input.float(0.2, "Trailing Stop Ratchet Multiplier", group=G_EXIT, tooltip="When momentum is yellow (caution), shrink ATR distance for TS by this much")
i_StartTime         = input(timestamp("01 Jan 2000 13:30 +0000"), "Start Filter", group=G_FILTER, tooltip="Start date & time to begin searching for setups")
i_EndTime           = input(timestamp("1 Jan 2099 19:30 +0000"), "End Filter", group=G_FILTER, tooltip="End date & time to stop searching for setups")

// Define custom security function which does not repaint
RequestSecurity_NonRP(_market, _res, _exp) => request.security(_market, _res, _exp[barstate.isrealtime ? 1 : 0])[barstate.isrealtime ? 0 : 1]

// Define date filter check
DateFilter(int start, int end) => time >= start and time <= end

// Get indicator values
float   atrValue    = ta.atr(i_AtrLength)
float   emaValue    = ta.ema(close, i_EmaLength)
float   htfEmaValue = RequestSecurity_NonRP(syminfo.tickerid, i_HigherTimeframe, emaValue)
float   marketPrice = close

// Check for bullishness / bearish volatility caution
bool    isBullish   = marketPrice > htfEmaValue
bool    isCaution   = isBullish and (ta.highest(high, 7) - low > (atrValue * 1.5) or marketPrice < emaValue)

// Set momentum color
color bgCol = color.red
if isBullish[1]
    bgCol := color.green
if isCaution[1]
    bgCol := color.orange

// Handle strategy entry, and reset trailing stop
var float trailStop = na
if isBullish and strategy.position_size == 0 and not isCaution
    strategy.entry(id="Buy", direction=strategy.long)
    trailStop := na

// Update trailing stop
float temp_trailStop = ta.highest(i_TrailStopSource, i_TrailStopLookback) - (isCaution[1] ? atrValue * i_TrailStopMulti : atrValue)
if strategy.position_size > 0
    if temp_trailStop > trailStop or na(trailStop)
        trailStop := temp_trailStop

// Handle strategy exit
if (close < trailStop or close < htfEmaValue) and barstate.isconfirmed
    strategy.close("Buy", comment="Sell")

// Draw trailing stop, HTF EMA and color-coded momentum indicator
plotshape(true, color=bgCol, style=shape.square, location=location.bottom, size=size.auto, title="Momentum Strength")
plot(htfEmaValue, color=close > htfEmaValue ? color.green : color.red, linewidth=2, title="HTF EMA")
plot(emaValue, color=close > emaValue ? color.green : color.red, linewidth=1, title="CTF EMA")
plot(strategy.position_size[1] > 0 ? trailStop : na, style=plot.style_linebr, color=color.red, title="Stop Loss")
Detail
https://www.fmz.com/strategy/444020
Last Modified
2024-03-08 16:20:16