
8.0 KiB
Name
枢轴点突破策略Pivot-Points-Breakout-Strategy
Author
ChaoZhang
Strategy Description
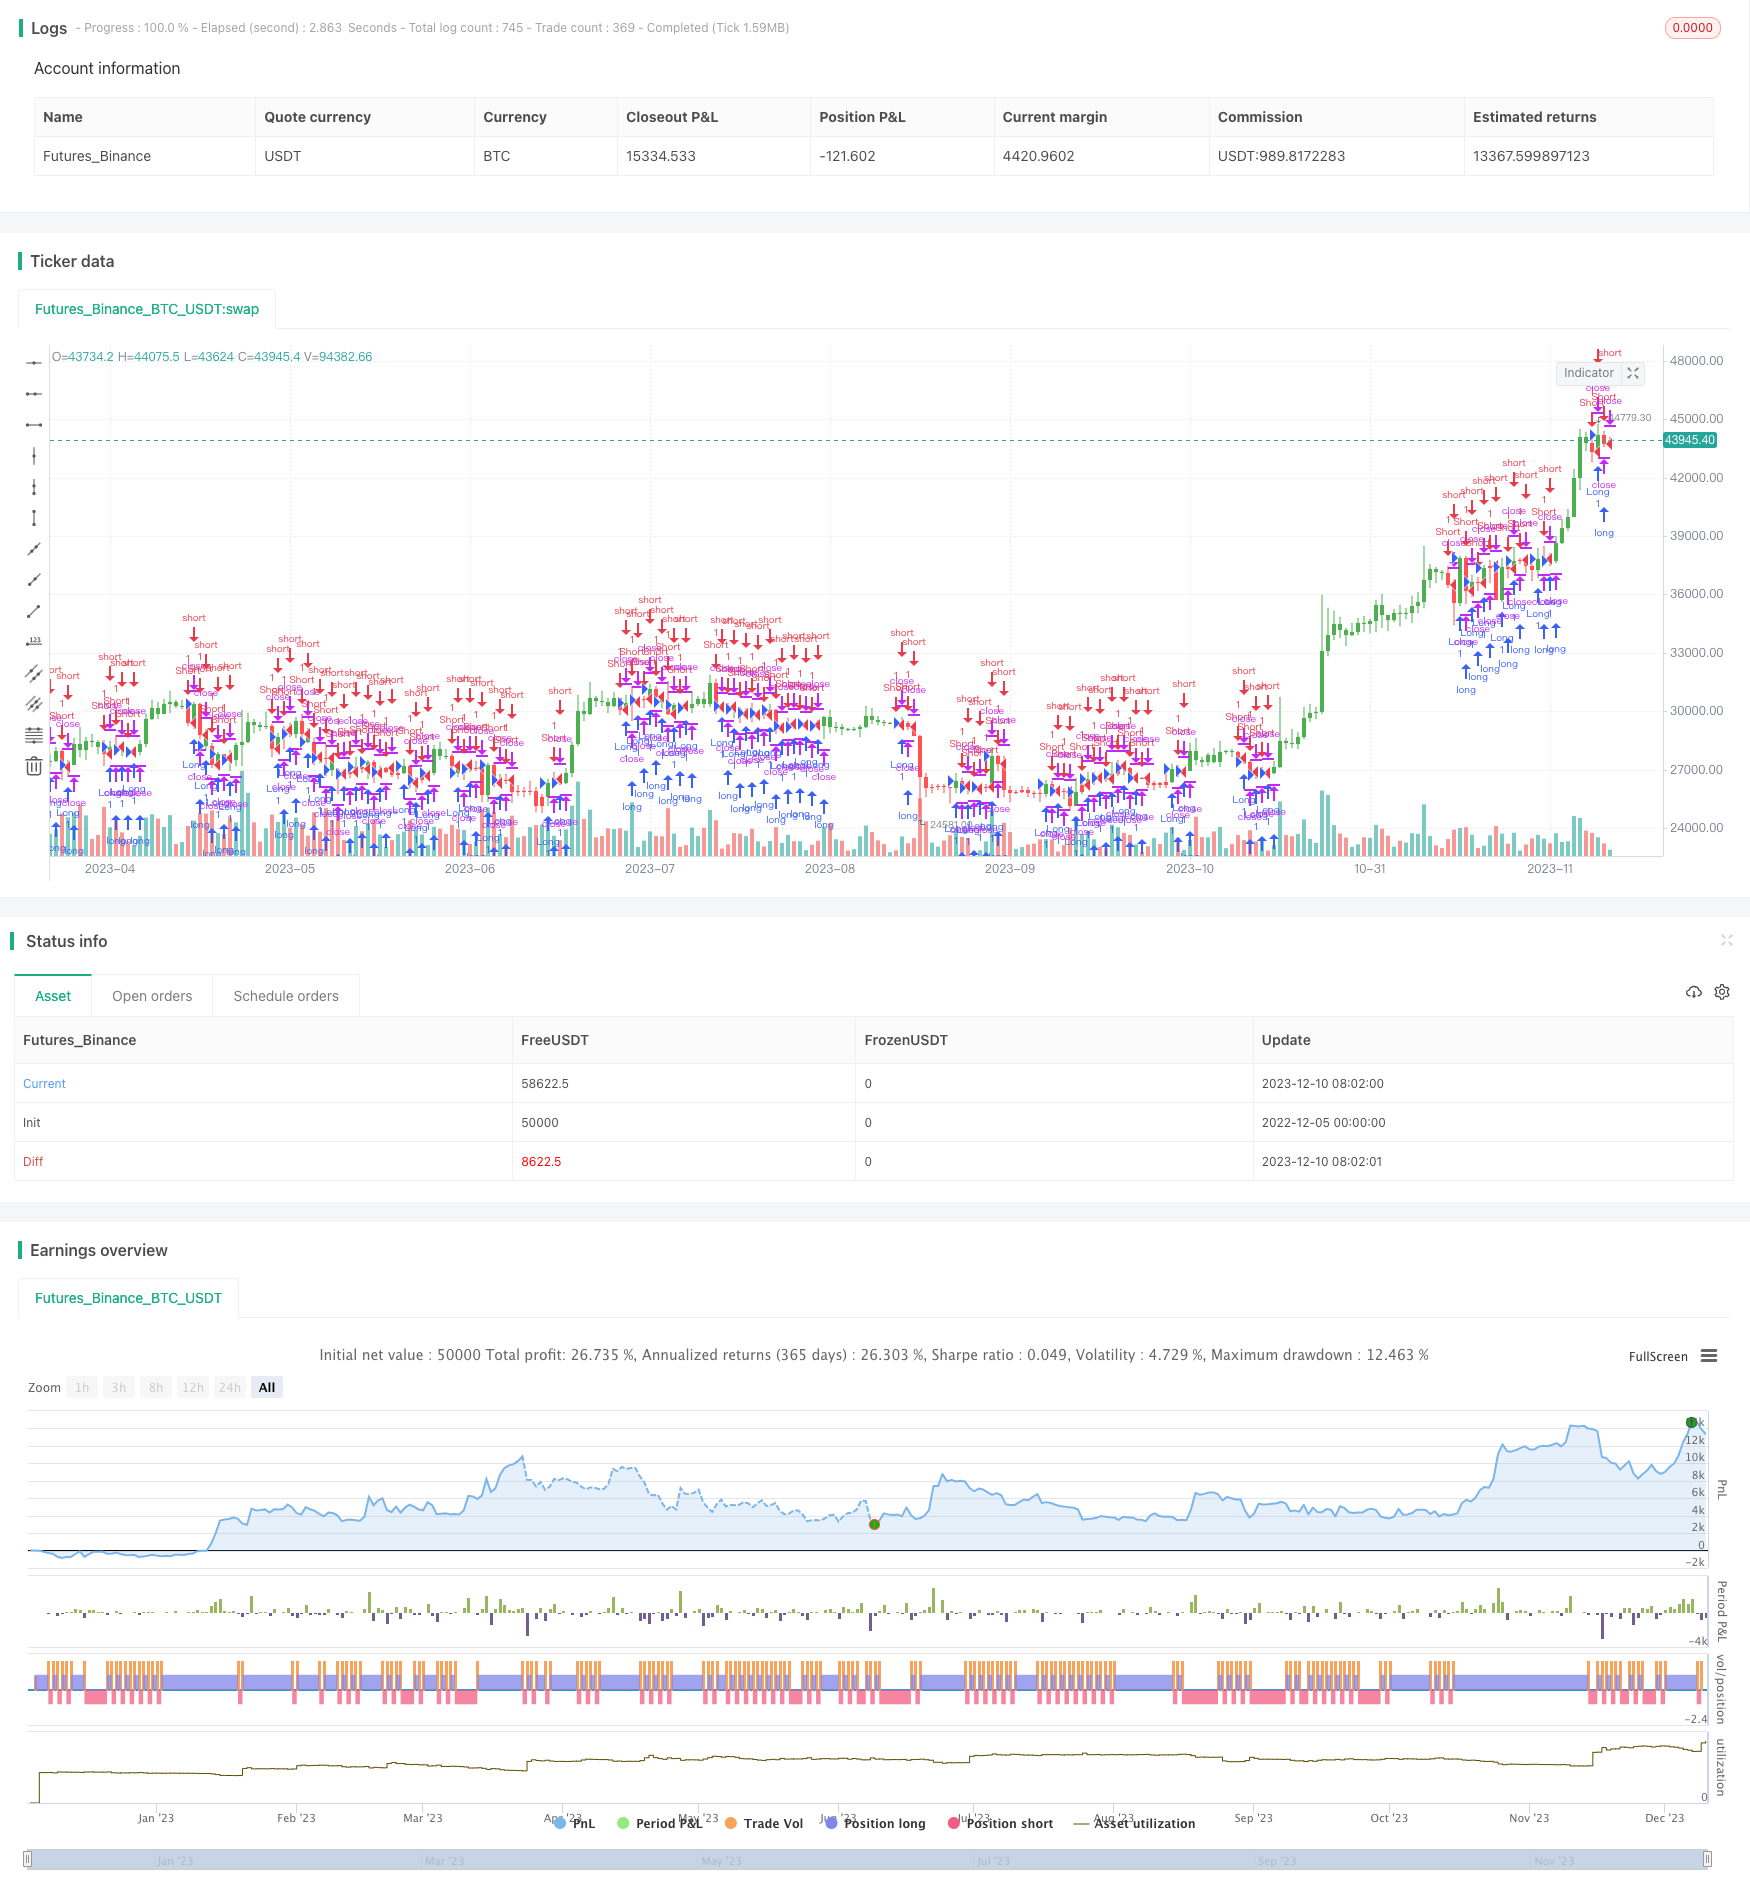
[trans]
概述
枢轴点突破策略(Pivot Points Breakout Strategy)是一种基于前一天的最高价、最低价、收盘价计算出的枢轴点,以及上轨和下轨来判断市场趋势和进行交易操作的量化交易策略。该策略的主要思路是,如果价格突破上轨,做多;如果价格突破下轨,做空。
策略原理
枢轴点突破策略的计算公式如下:
枢轴点价格(Pivot Price,PP)=(前一天的最高价+前一天的最低价+前一天的收盘价)/3
上轨阻力线(First Resistance,R1)= (枢轴点价格*2)-前一天的最低价
下轨支撑线(First Support,S1)= (枢轴点价格*2)-前一天的最高价
交易信号的判断逻辑是:
如果收盘价>上轨阻力线R1,做多
如果收盘价<下轨支撑线S1,做空
该策略的主要优点有:
- 使用前一天的数据计算枢轴点,响应灵敏
- 突破上下轨形成强势趋势的概率大
- 策略规则简单明确,容易实现
优势分析
枢轴点突破策略具有以下几个优势:
-
计算公式简单,易于实现。只需要前一日的最高价、最低价和收盘价即可计算出枢轴点和上下轨。
-
响应迅速。枢轴点和上下轨每日更新,能快速捕捉到价格变化。
-
捕捉趋势早。价格突破上下轨代表发生较大变化,可能形成新趋势。
-
回撤小。设置止损可以限制亏损风险。
-
容易优化。可以调整参数,如使用不同周期数据计算枢轴点。
风险分析
枢轴点突破策略也存在一些风险:
-
错误突破风险。价格可能出现一时的错误突破,导致交易亏损。
-
市场震荡风险。当市场长期震荡时,价格可能多次触碰上下轨带来损失。
-
param风险。如果参数设置不当,如交易周期太短,也可能增加损失。
对策:
-
设置止损止盈,严格控制风险。
-
优化参数,调整周期长度。
-
结合其他指标过滤信号。
优化方向
枢轴点突破策略还可以从以下几个方面进行优化:
-
周期优化。可以测试使用更长周期如周线或月线数据计算枢轴点。
-
参数优化。可以测试调整上轨和下轨参数的数值,如1.5或2.5等。
-
过滤优化。结合移动平均线等指标过滤误差信号。
-
风控优化。设置动态止损止盈机制,根据市场变化调整止损位。
总结
枢轴点突破策略整体来说是一种较为简单实用的趋势跟踪策略。它快速响应市场变化,可以有效捕捉新趋势的形成。但也存在一定的错误信号风险。通过参数优化、信号过滤以及风控手段,可以在保持其优势的同时,控制潜在风险,提高策略稳定性和盈利能力。
||
Overview
The Pivot Points Breakout Strategy is a quantitative trading strategy that uses pivot points calculated based on the previous day's high, low and close prices, as well as upper and lower rails, to determine market trends and make trading decisions. The main idea of this strategy is to go long when prices break through the upper rail and go short when prices break through the lower rail.
Strategy Principle
The calculation formulas for the Pivot Points Breakout Strategy are as follows:
Pivot Price (PP) = (Previous day's high + Previous day's low + Previous day's close) / 3
First Resistance (R1) = (Pivot Price * 2) - Previous day's low
First Support (S1) = (Pivot Price * 2) - Previous day's high
The logic for trade signals is:
If close > First Resistance (R1), go long
If close < First Support (S1), go short
The main advantages of this strategy are:
- Uses previous day's data to calculate pivot points, responsive
- High probability of forming strong trends after breaking through upper/lower rails
- Simple and clear strategy rules, easy to implement
Advantage Analysis
The Pivot Points Breakout Strategy has the following advantages:
-
The calculation formula is simple and easy to implement. It only requires the previous day's high, low and close prices to calculate the pivot points and upper/lower rails.
-
It responds quickly. The pivot points and upper/lower rails update daily and can quickly capture price changes.
-
It captures trends early. Prices breaking through the upper/lower rails represent significant changes that may form new trends.
-
It has small drawdowns. Setting stop loss can limit downside risk.
-
It is easy to optimize. Parameters can be adjusted such as using different period data to calculate the pivot points.
Risk Analysis
The Pivot Points Breakout Strategy also has some risks:
-
Wrong breakout risk. Prices may temporarily break out incorrectly, leading to trading losses.
-
Market fluctuation risk. When the market fluctuates for an extended time, prices may touch the upper/lower rails multiple times leading to losses.
-
Parameter risk. If parameters are set inappropriately, such as the trading period is too short, it may also increase losses.
Countermeasures:
-
Set stop loss/take profit to strictly control risks.
-
Optimize parameters, adjust cycle length.
-
Combine with other indicators to filter signals.
Optimization Directions
The Pivot Points Breakout Strategy can also be optimized in the following aspects:
-
Cycle optimization. Test using longer cycle data such as weekly or monthly to calculate the pivot points.
-
Parameter optimization. Test adjusting the parameter values for the upper/lower rails, such as 1.5 or 2.5 etc.
-
Filter optimization. Combine with moving averages and other indicators to filter erroneous signals.
-
Risk control optimization. Set dynamic stop loss/take profit mechanisms, adjust stop loss price based on market changes.
Conclusion
Overall, the Pivot Points Breakout Strategy is a relatively simple and practical trend following strategy. It responds quickly to market changes and can effectively capture new trend formations. But there are also certain risks of wrong signals. By optimizing parameters, filtering signals and implementing risk control measures, the advantages can be maintained while controlling potential risks to improve the stability and profitability of the strategy.
[/trans]
Strategy Arguments
| Argument | Default | Description |
|---|---|---|
| v_input_1 | false | Trade reverse |
Source (PineScript)
/*backtest
start: 2022-12-05 00:00:00
end: 2023-12-11 00:00:00
period: 1d
basePeriod: 1h
exchanges: [{"eid":"Futures_Binance","currency":"BTC_USDT"}]
*/

//@version=2
////////////////////////////////////////////////////////////
//  Copyright by HPotter v1.0 27/06/2018
// The name ‘Floor-Trader Pivot,’ came from the fact that Pivot points can
// be calculated quickly, on the fly using price data from the previous day
// as an input. Although time-frames of less than a day can be used, Pivots are
// commonly plotted on the Daily Chart; using price data from the previous day’s
// trading activity.
//
// You can change long to short in the Input Settings
// WARNING:
// - For purpose educate only
// - This script to change bars colors.
////////////////////////////////////////////////////////////
strategy(title="Floor Pivot Points Backtest", shorttitle="FPP", overlay = true)
xHigh  = request.security(syminfo.tickerid,"D", high[1])
xLow   = request.security(syminfo.tickerid,"D", low[1])
xClose = request.security(syminfo.tickerid,"D", close[1])
reverse = input(false, title="Trade reverse")
vPP = (xHigh+xLow+xClose) / 3
vR1 = (vPP * 2) - xLow
vS1 = (vPP * 2) - xHigh
pos = iff(close > vR1, 1,
       iff(close < vS1, -1, nz(pos[1], 0)))
possig = iff(reverse and pos == 1, -1,
          iff(reverse and pos == -1, 1, pos))
if (possig == 1)
    strategy.entry("Long", strategy.long)
if (possig == -1)
    strategy.entry("Short", strategy.short)
barcolor(possig == -1 ? red: possig == 1 ? green : blue )
Detail
https://www.fmz.com/strategy/435151
Last Modified
2023-12-12 16:47:17