
9.7 KiB
Name
机器学习自适应超级趋势量化交易策略-Machine-Learning-Adaptive-SuperTrend-Quantitative-Trading-Strategy
Author
ChaoZhang
Strategy Description
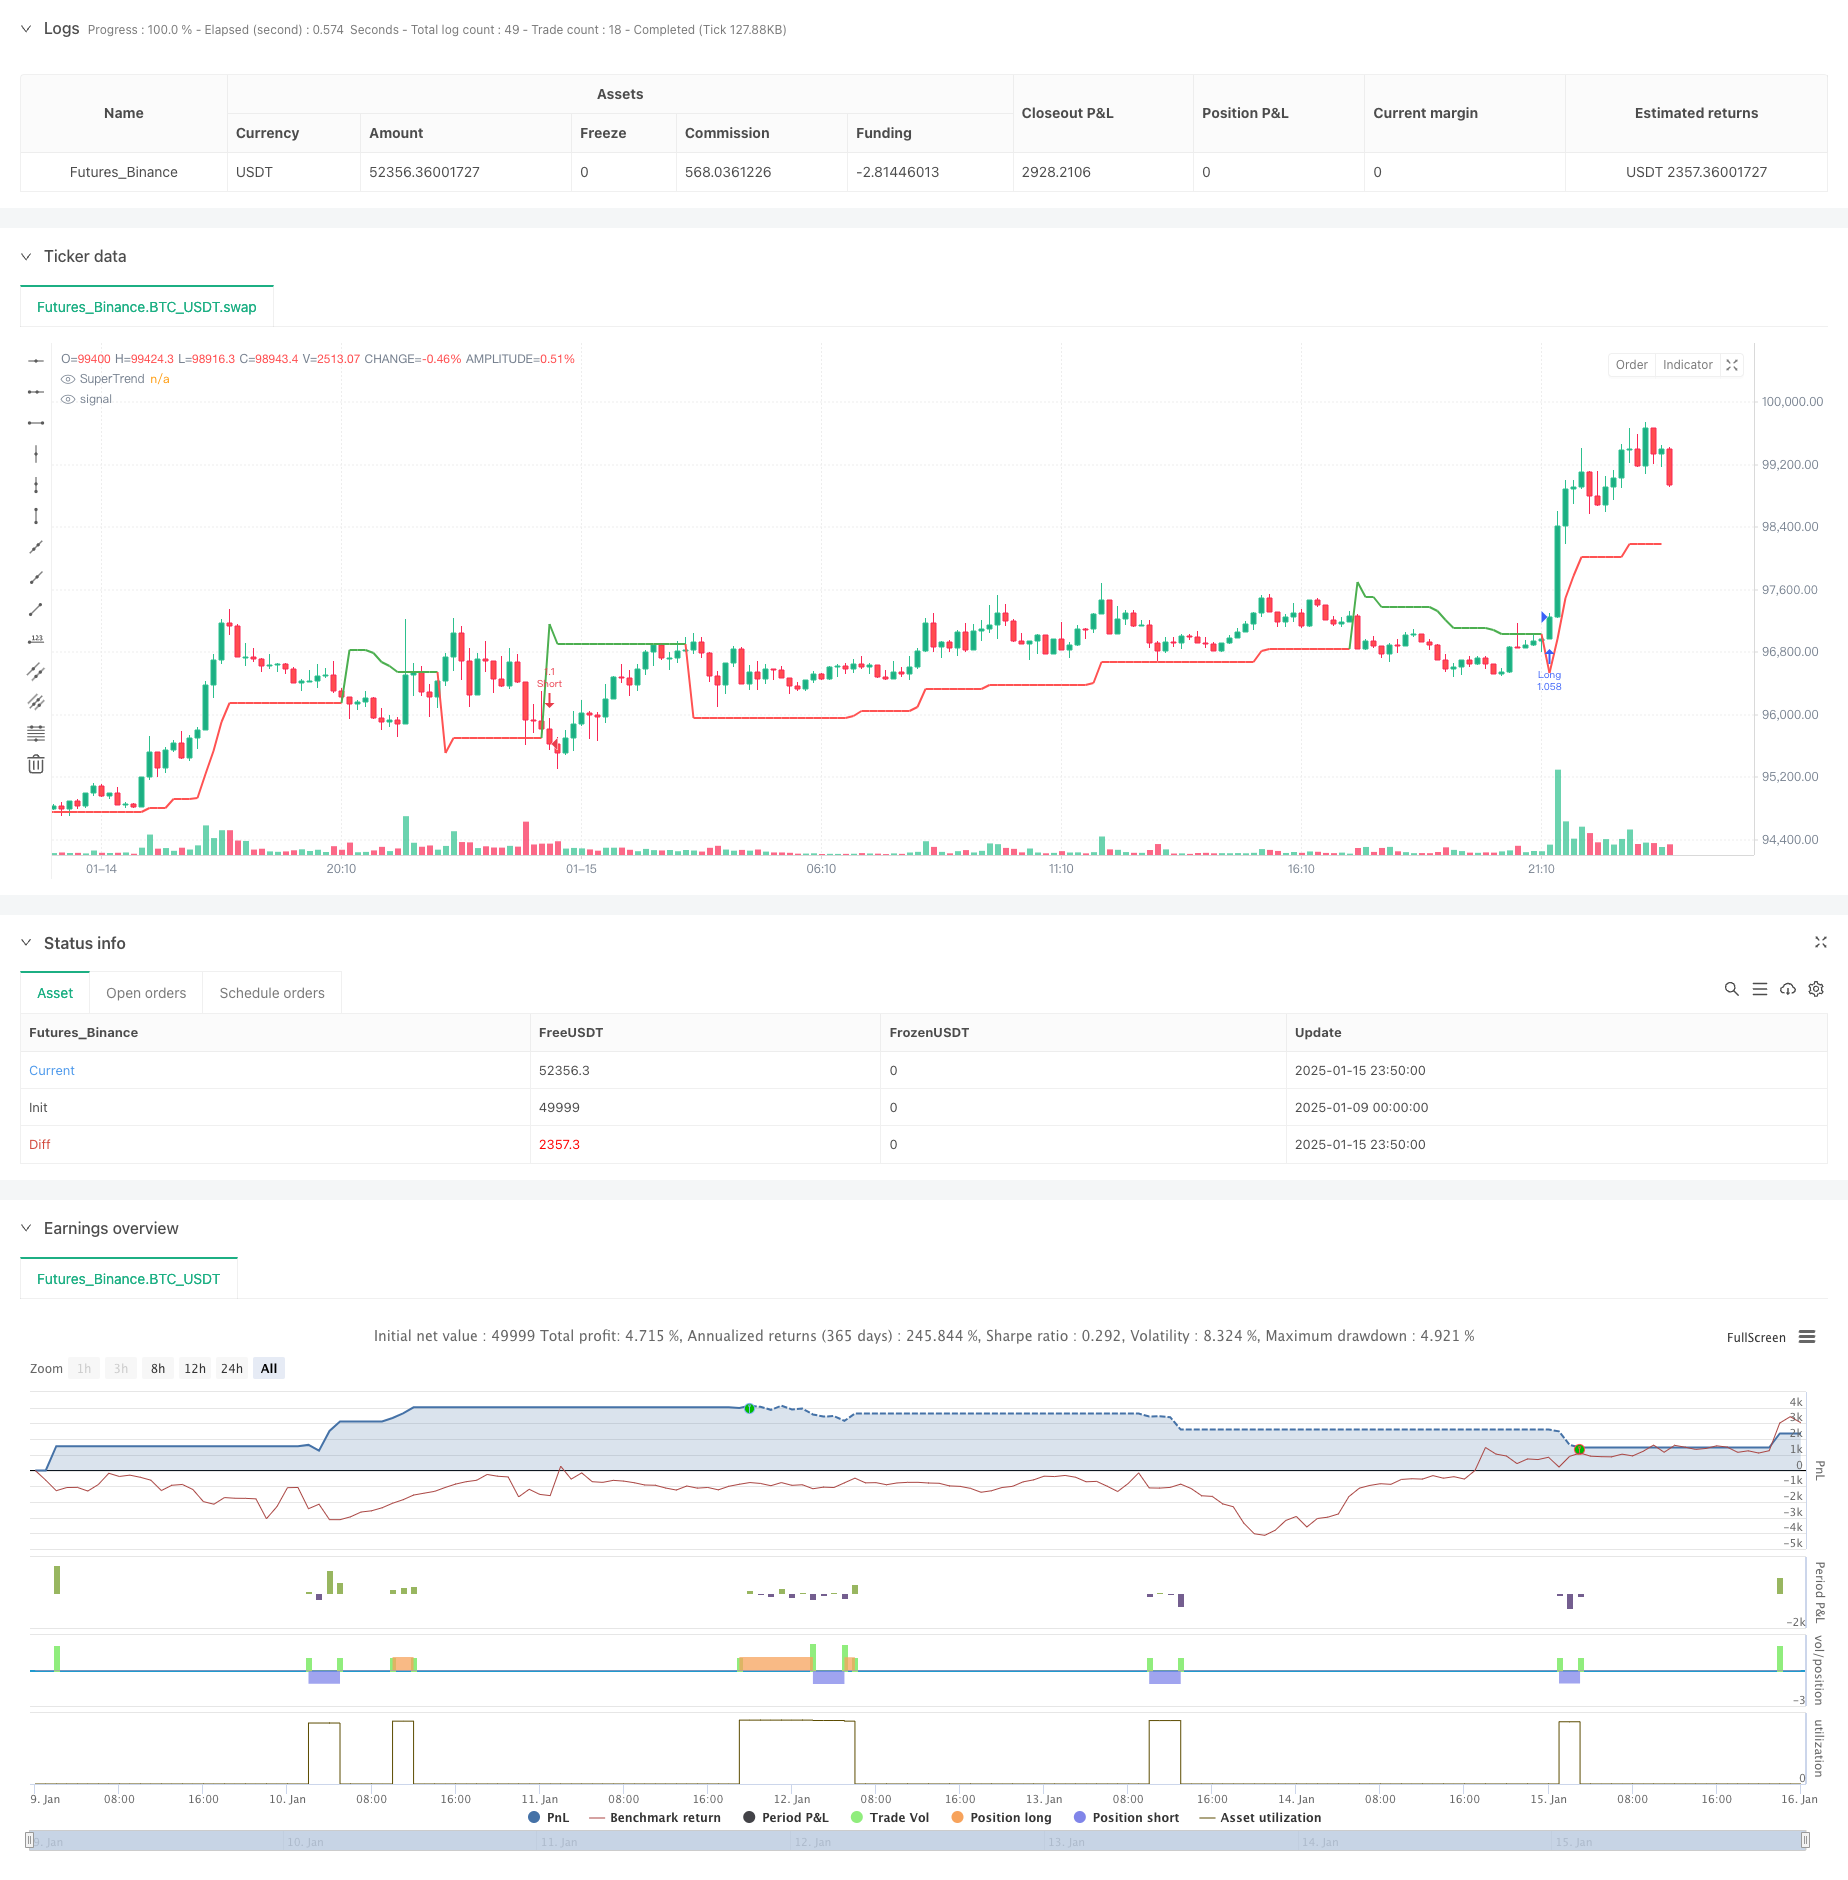
[trans]
概述
本策略是一个基于机器学习的自适应超级趋势交易系统,通过整合波动率聚类、自适应ATR趋势检测和结构化的进出场机制,提高了传统SuperTrend指标的可靠性。策略核心在于通过机器学习方法对市场波动率进行分类,在合适的市场环境下进行趋势跟踪交易,同时运用动态的止损止盈来控制风险。
策略原理
策略包含三个关键组成部分:1)基于ATR的自适应SuperTrend计算,用于确定趋势方向和转折点;2)基于K-means算法的波动率聚类,将市场状态分为高、中、低三种波动环境;3)基于波动率环境的差异化交易规则。在低波动率环境下寻找趋势性机会,在高波动率环境下保持谨慎。系统通过ta.crossunder和ta.crossover函数捕捉趋势转向信号,并结合价格与SuperTrend线的位置关系确定交易方向。
策略优势
- 自适应性强:通过机器学习方法动态调整对市场波动率的判断,使策略能够适应不同的市场环境。
- 风险控制完善:基于ATR的动态止损止盈机制,能够根据市场波动情况自动调整风险控制参数。
- 假信号过滤:通过波动率聚类方法有效过滤掉高波动期间的虚假信号。
- 应用范围广:策略可以应用于外汇、加密货币、股票和大宗商品等多个市场。
- 多时间周期适用:从15分钟到月线等不同时间周期都具有良好的适用性。
策略风险
- 参数敏感性:ATR长度、SuperTrend因子等参数的选择会显著影响策略表现。
- 趋势反转风险:在强趋势突然反转时可能造成较大回撤。
- 市场环境依赖:在震荡市场中可能产生频繁交易并累积交易成本。
- 计算复杂度:机器学习组件增加了策略的计算复杂度,可能影响实时执行效率。
策略优化方向
- 优化波动率聚类算法:可以考虑使用更先进的聚类方法如DBSCAN或GMM来提高市场状态分类的准确性。
- 引入多重时间框架分析:结合更长周期的趋势判断来提高交易方向的准确性。
- 动态调整参数:开发自适应参数调整机制,根据市场表现自动优化ATR长度和SuperTrend因子。
- 增加市场情绪指标:整合基于成交量和价格动量的市场情绪指标,提高信号质量。
- 完善资金管理:引入更复杂的仓位管理算法,优化资金利用效率。
总结
该策略通过将机器学习技术与传统技术分析方法相结合,创造了一个智能化的趋势跟踪系统。策略的核心优势在于其自适应性和风险控制能力,通过波动率聚类实现了对市场状态的智能识别。虽然存在参数敏感性等风险,但通过持续优化和完善,策略有望在各类市场环境中保持稳定的表现。建议交易者在实盘应用时充分测试参数敏感性,并结合市场具体特征进行针对性优化。
||
Overview
This strategy is a machine learning-based adaptive SuperTrend trading system that enhances the reliability of the traditional SuperTrend indicator by integrating volatility clustering, adaptive ATR trend detection, and structured entry/exit mechanisms. The core concept lies in classifying market volatility through machine learning methods, executing trend-following trades in suitable market conditions, while employing dynamic stop-loss and take-profit levels for risk control.
Strategy Principles
The strategy consists of three key components: 1) Adaptive SuperTrend calculation based on ATR for determining trend direction and turning points; 2) K-means-based volatility clustering that categorizes market states into high, medium, and low volatility environments; 3) Differentiated trading rules based on volatility environments. It seeks trending opportunities in low volatility environments while maintaining caution in high volatility conditions. The system captures trend reversal signals using ta.crossunder and ta.crossover functions, combined with price position relative to the SuperTrend line.
Strategy Advantages
- Strong adaptability: Dynamically adjusts market volatility assessment through machine learning methods to adapt to different market environments.
- Comprehensive risk control: Dynamic stop-loss and take-profit mechanism based on ATR automatically adjusts risk control parameters according to market volatility.
- False signal filtering: Effectively filters out false signals during high volatility periods through volatility clustering.
- Wide application range: Strategy can be applied to multiple markets including forex, cryptocurrency, stocks, and commodities.
- Multi-timeframe compatibility: Works well across different timeframes from 15-minute to monthly charts.
Strategy Risks
- Parameter sensitivity: Selection of ATR length, SuperTrend factor, and other parameters significantly affects strategy performance.
- Trend reversal risk: May experience significant drawdowns during sudden trend reversals.
- Market environment dependency: May generate frequent trades and accumulate trading costs in ranging markets.
- Computational complexity: Machine learning components increase strategy computational complexity, potentially affecting real-time execution efficiency.
Strategy Optimization Directions
- Optimize volatility clustering algorithm: Consider using more advanced clustering methods like DBSCAN or GMM to improve market state classification accuracy.
- Incorporate multiple timeframe analysis: Combine longer-term trend analysis to improve trade direction accuracy.
- Dynamic parameter adjustment: Develop adaptive parameter adjustment mechanisms to automatically optimize ATR length and SuperTrend factor based on market performance.
- Add market sentiment indicators: Integrate market sentiment indicators based on volume and price momentum to improve signal quality.
- Enhance money management: Introduce more sophisticated position sizing algorithms to optimize capital utilization efficiency.
Summary
This strategy creates an intelligent trend-following system by combining machine learning techniques with traditional technical analysis methods. Its core advantages lie in its adaptability and risk control capabilities, achieving intelligent market state identification through volatility clustering. While risks such as parameter sensitivity exist, continuous optimization and refinement can help maintain stable performance across various market environments. Traders are advised to thoroughly test parameter sensitivity and optimize based on specific market characteristics when implementing the strategy in live trading.[/trans]
Source (PineScript)
/*backtest
start: 2025-01-09 00:00:00
end: 2025-01-16 00:00:00
period: 10m
basePeriod: 10m
exchanges: [{"eid":"Futures_Binance","currency":"BTC_USDT","balance":49999}]
*/

//@version=5
strategy("Adaptive SuperTrend Strategy", overlay=true, default_qty_type=strategy.percent_of_equity, default_qty_value=200)

// Import Indicator Components
atr_len = input.int(10, "ATR Length", group="SuperTrend Settings")
fact = input.float(3, "SuperTrend Factor", group="SuperTrend Settings")
training_data_period = input.int(100, "Training Data Length", group="K-Means Settings")

// Volatility Clustering
volatility = ta.atr(atr_len)
upper = ta.highest(volatility, training_data_period)
lower = ta.lowest(volatility, training_data_period)

high_volatility = lower + (upper-lower) * 0.75
medium_volatility = lower + (upper-lower) * 0.5
low_volatility = lower + (upper-lower) * 0.25

cluster = volatility >= high_volatility ? 0 : volatility >= medium_volatility ? 1 : 2

// SuperTrend Calculation
pine_supertrend(factor, atr) =>
    src = hl2
    upperBand = src + factor * atr
    lowerBand = src - factor * atr
    prevLowerBand = nz(lowerBand[1])
    prevUpperBand = nz(upperBand[1])

    lowerBand := lowerBand > prevLowerBand or close[1] < prevLowerBand ? lowerBand : prevLowerBand
    upperBand := upperBand < prevUpperBand or close[1] > prevUpperBand ? upperBand : prevUpperBand
    int _direction = na
    float superTrend = na
    prevSuperTrend = superTrend[1]
    if na(atr[1])
        _direction := 1
    else if prevSuperTrend == prevUpperBand
        _direction := close > upperBand ? -1 : 1
    else
        _direction := close < lowerBand ? 1 : -1
    superTrend := _direction == -1 ? lowerBand : upperBand
    [superTrend, _direction]

[ST, dir] = pine_supertrend(fact, volatility)

// Entry Conditions
longEntry = ta.crossunder(dir, 0) and cluster > 1 and close > ST
shortEntry = ta.crossover(dir, 0) and cluster == 0 and close < ST

// Stop Loss & Take Profit
atr_mult = input.float(2, "ATR Multiplier for SL/TP", group="Risk Management")
sl = atr_mult * ta.atr(atr_len)

longStopLoss = close - sl
longTakeProfit = close + (sl * 1.5)
shortStopLoss = close + sl
shortTakeProfit = close - (sl * 1.5)

// Execute Trades
if longEntry
    strategy.entry("Long", strategy.long)
    strategy.exit("Take Profit", from_entry="Long", limit=longTakeProfit, stop=longStopLoss)

if shortEntry
    strategy.entry("Short", strategy.short)
    strategy.exit("Take Profit", from_entry="Short", limit=shortTakeProfit, stop=shortStopLoss)

// Plot SuperTrend
plot(ST, title="SuperTrend", color=dir > 0 ? color.green : color.red, linewidth=2)

// Alerts
alertcondition(longEntry, title="Long Entry Signal", message="Buy Signal - Trend Shift Up")
alertcondition(shortEntry, title="Short Entry Signal", message="Sell Signal - Trend Shift Down")
Detail
https://www.fmz.com/strategy/478712
Last Modified
2025-01-17 15:11:40