
6.4 KiB
Name
月末动量突破200日均线策略End-of-Month-Breakout-on-200-Day-Moving-Average-Strategy
Author
ChaoZhang
Strategy Description
[trans]
概述
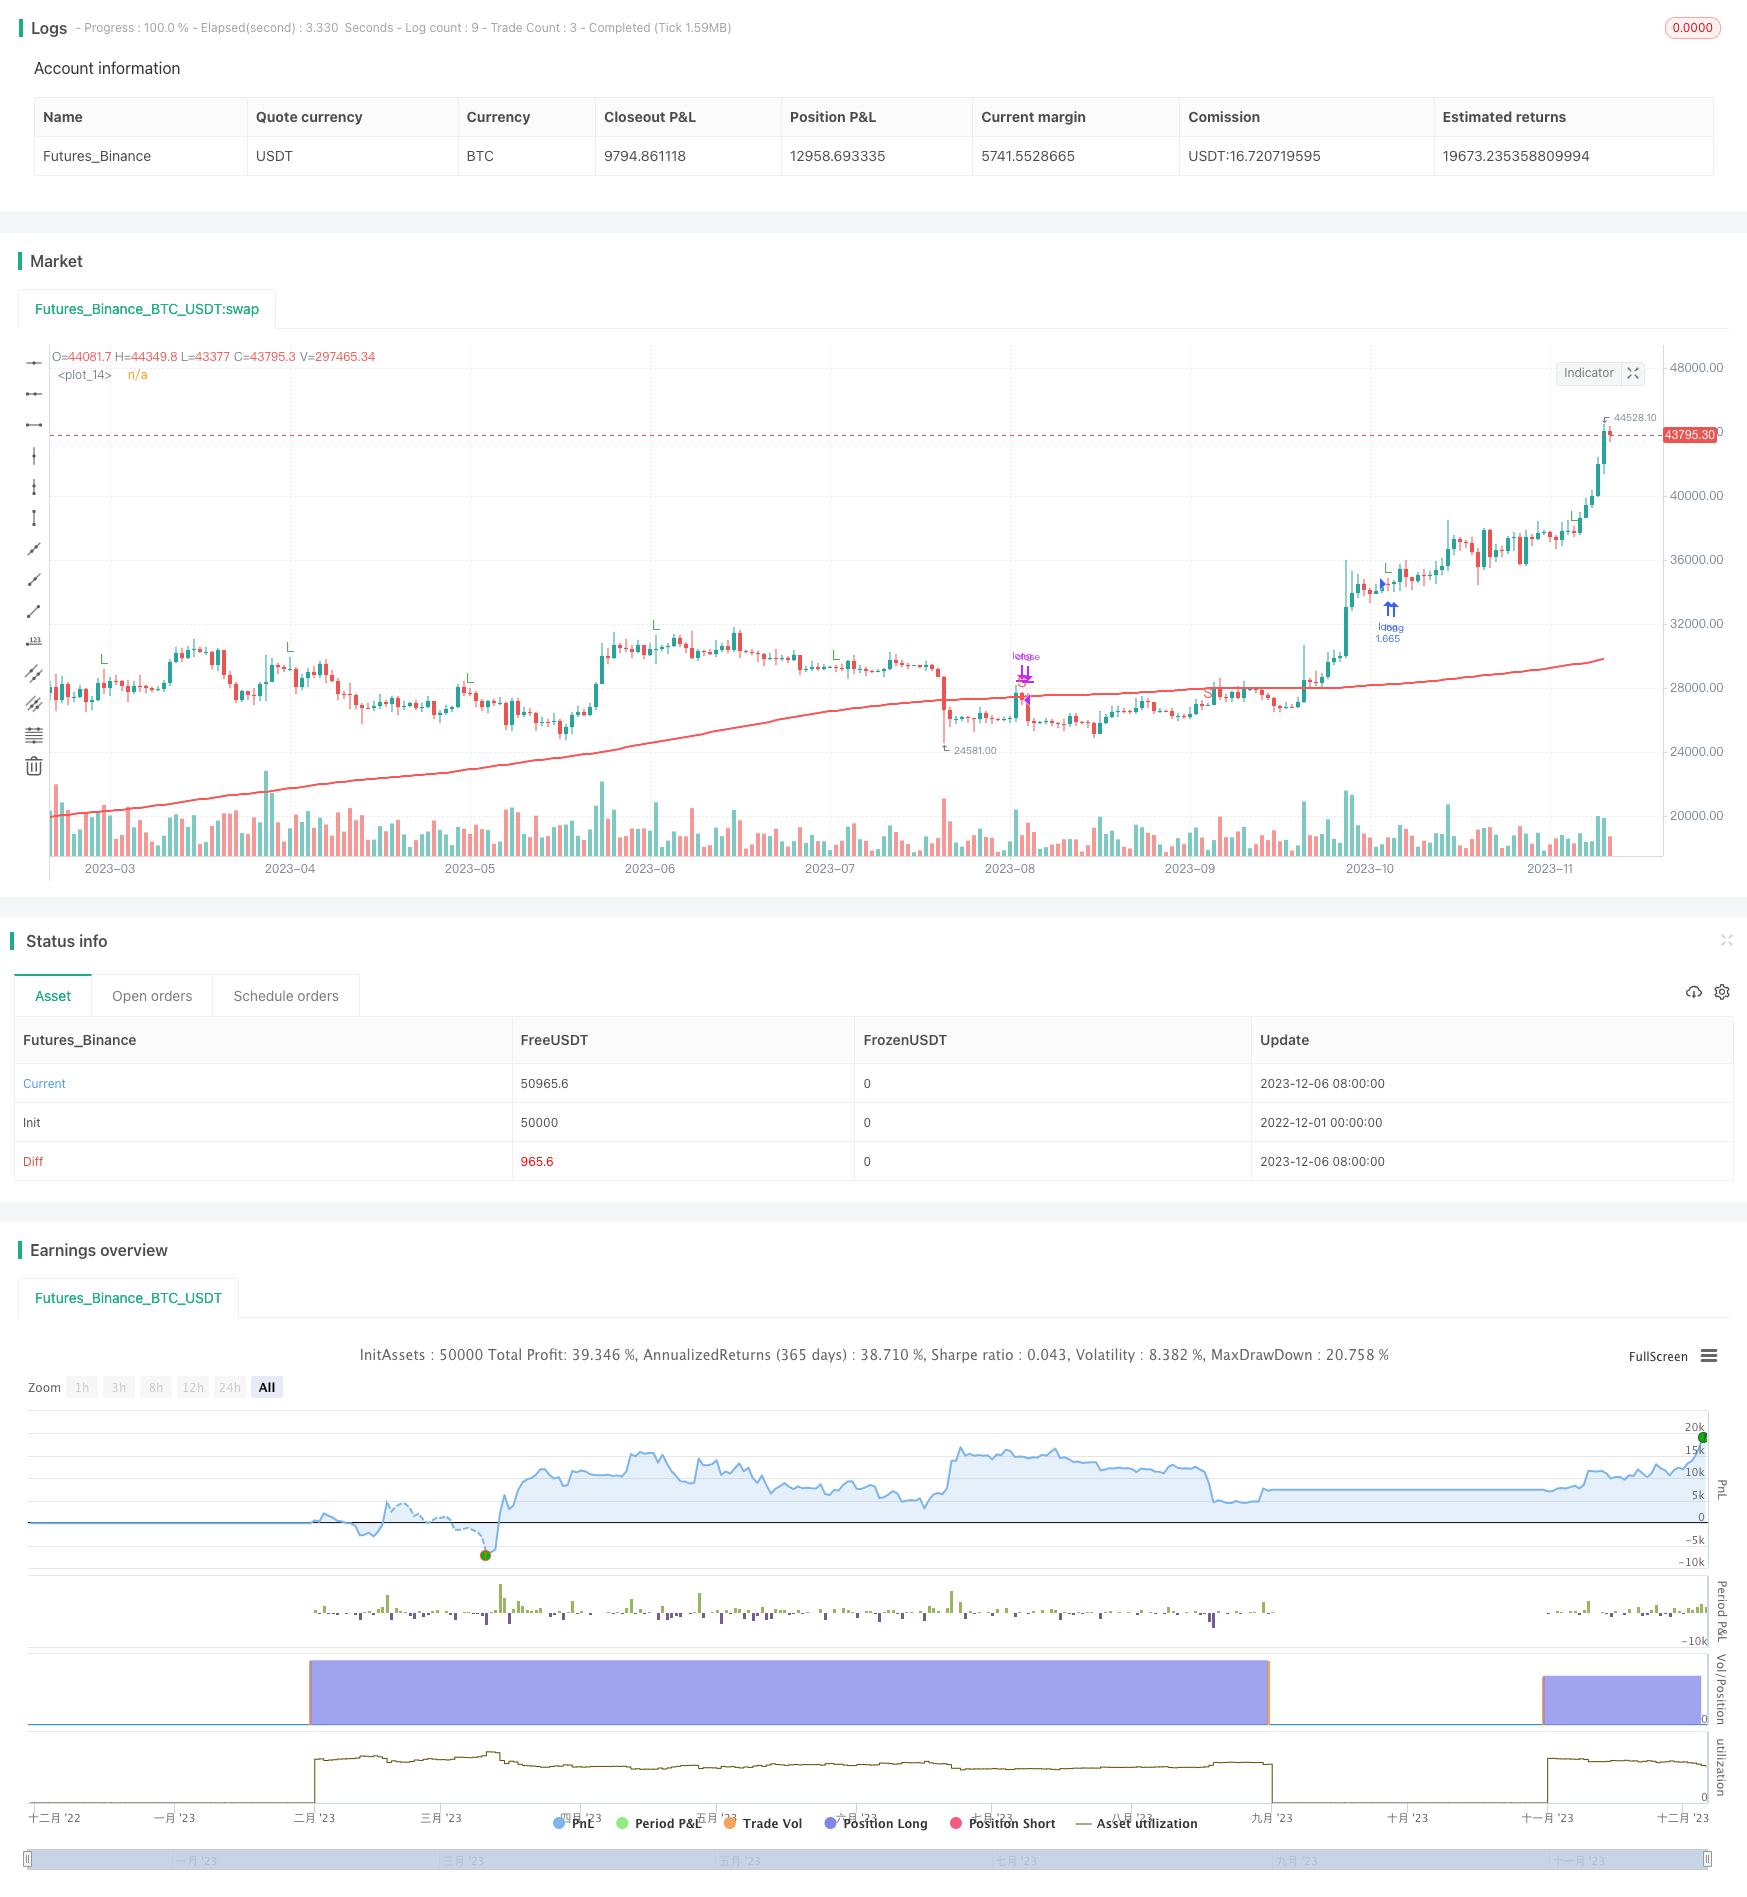
该策略基于月末时点,判断股票价格是否突破200日移动平均线,以捕捉股票价格的趋势性方向。当价格突破200日均线时建立多头头寸,否则清仓观望。
策略原理
- 使用200日简单移动平均线dma200作为判断价格趋势的指标
- 在每月最后一个交易日,判断当日收盘价close是否高于dma200
- 如果收盘价突破200日均线,则在下一交易日开盘建立全仓多头头寸
- 如果收盘价跌破200日均线,则在下一交易日开盘清仓
- 这样可以达到趋势跟踪的效果,在股票价格进入上升趋势时建仓,避开下跌趋势
优势分析
- 策略优势在于简单有效,容易理解和实现
- 利用月末时点建仓,可以减少交易频率,降低交易成本和滑点影响
- 200日均线是非常常用的中长期趋势判断指标,对大部分股票有效
- 策略回撤和最大跌幅都较小,风险可控
风险分析
- 200日均线对于一些股票可能不够灵敏,无法及时捕捉到价格转折
- 月末只有1个交易点建仓,可能错过中间涨跌机会
- 大盘整体趋势不确定时,该策略可能无法正确判断
- 应该组合其他指标判断来降低这些风险
优化方向
- 可以考虑在月初或月中增加建仓点,提高策略频率
- 增加如布林带等指标来判断价格震荡,避免错交易 3.评估不同均线参数对不同股票的拟合效果,寻找最佳参数组合
- 可以建立动态仓位管理机制,当回撤过大时主动止损
总结
该策略整体较为简单实用,通过月末突破200日均线的方式,有效捕捉股票中长期价格趋势,回撤和风险较小。通过结合更多指标判断和动态优化,可以进一步增强策略稳定性和收益率。
||
Overview
This strategy is based on the price breakout of the 200-day moving average at month end to capture the trend direction of stock prices. A long position will be established when the price breaks through the 200-day MA, otherwise the position will be cleared.
Strategy Principle
- Use the 200-day simple moving average dma200 as an indicator to judge the price trend
- On the last trading day of each month, judge whether the closing price close is higher than dma200
- If the closing price breaks through the 200-day MA, establish a full long position at the opening of next trading day
- If the closing price breaks below the 200-day MA, clear all positions at the opening of next trading day
- This can achieve the effect of trend following, establishing positions when stock prices enter an upward trend and avoiding downward trends
Advantage Analysis
- The advantage of the strategy is that it is simple and effective, easy to understand and implement
- Taking positions at month end can reduce trading frequency and minimize trading costs and slippage impacts
- The 200-day MA is a very commonly used medium and long term trend judgment indicator, effective for most stocks
- The strategy has relatively small drawdown and maximum decline, with controllable risks
Risk Analysis
- The 200-day MA may not be sensitive enough for some stocks to capture price reversals in time
- There is only 1 trading point per month for taking positions, which may miss upside/downside opportunities
- The strategy may fail to judge correctly when the overall market trend is uncertain
- Other indicators should be combined to reduce these risks
Optimization Directions
- Consider increasing trading points at beginning or middle of month to improve strategy frequency
- Add indicators like Bollinger Bands to judge price fluctuation and avoid wrong trades
- Evaluate fitting effects of different MA parameters on different stocks to find optimal parameter combinations
- Establish dynamic position sizing mechanisms to stop loss actively when drawdown gets too high
Summary
The strategy is relatively simple and practical overall, effectively capturing medium and long term price trends of stocks through month end breakout of the 200-day MA, with relatively small drawdown and risks. By combining more indicators and dynamic optimizations, the stability and profitability of the strategy can be further enhanced.
[/trans]
Strategy Arguments
| Argument | Default | Description |
|---|---|---|
| v_input_int_1 | true | From Day |
| v_input_int_2 | true | From Month |
| v_input_int_3 | 2018 | From Year |
| v_input_int_4 | true | To Day |
| v_input_int_5 | true | To Month |
| v_input_int_6 | 9999 | To Year |
Source (PineScript)
/*backtest
start: 2022-12-01 00:00:00
end: 2023-12-07 00:00:00
period: 1d
basePeriod: 1h
exchanges: [{"eid":"Futures_Binance","currency":"BTC_USDT"}]
*/

// This source code is subject to the terms of the Mozilla Public License 2.0 at https://mozilla.org/MPL/2.0/
// © muscleriot
//200 dma
//2000-2016 backtested
//1 signal per month only at end of month
//If > 200DMA enter long
//If < 200DMA goto cash
//results: 318% drawdown 17% vs 125% with 55% drawdown for buy and hold
//@version=5
strategy("200DMA last DOM - ajh", overlay =true,default_qty_type=strategy.percent_of_equity, default_qty_value=100)
// Use 100% of  equity always

dma200 = ta.sma(close, 200)
plot(dma200, color=color.red, linewidth = 2)
//e =dayofmonth(time)
// backtesting date range
from_day = input.int(defval=1, title="From Day", minval=1, maxval=31)
from_month = input.int(defval=1, title="From Month", minval=1, maxval=12)
from_year = input.int(defval=2018, title="From Year", minval=1900)

to_day = input.int(defval=1, title="To Day", minval=1, maxval=31)
to_month = input.int(defval=1, title="To Month", minval=1, maxval=12)
to_year = input.int(defval=9999, title="To Year", minval=1900)

time_cond = time > timestamp(from_year, from_month, from_day, 00, 00) and
   time < timestamp(to_year, to_month, to_day, 23, 59)


xLong = dayofmonth(time) == 30 and (close > dma200) ? true : na
xSell = dayofmonth(time) == 30 and (close < dma200) ? true : na
plotchar(xLong, "long","L", color=color.green)
plotchar(xSell, "Sell","S", color=color.red)
if (xLong == true) and time_cond
    strategy.entry("long", strategy.long)
if (xSell == true) and time_cond
    strategy.close("long")
Detail
https://www.fmz.com/strategy/434710
Last Modified
2023-12-08 16:02:08