
9.1 KiB
Name
最高最低价格止损策略Highest-High-Lowest-Low-Stop-Strategy
Author
ChaoZhang
Strategy Description
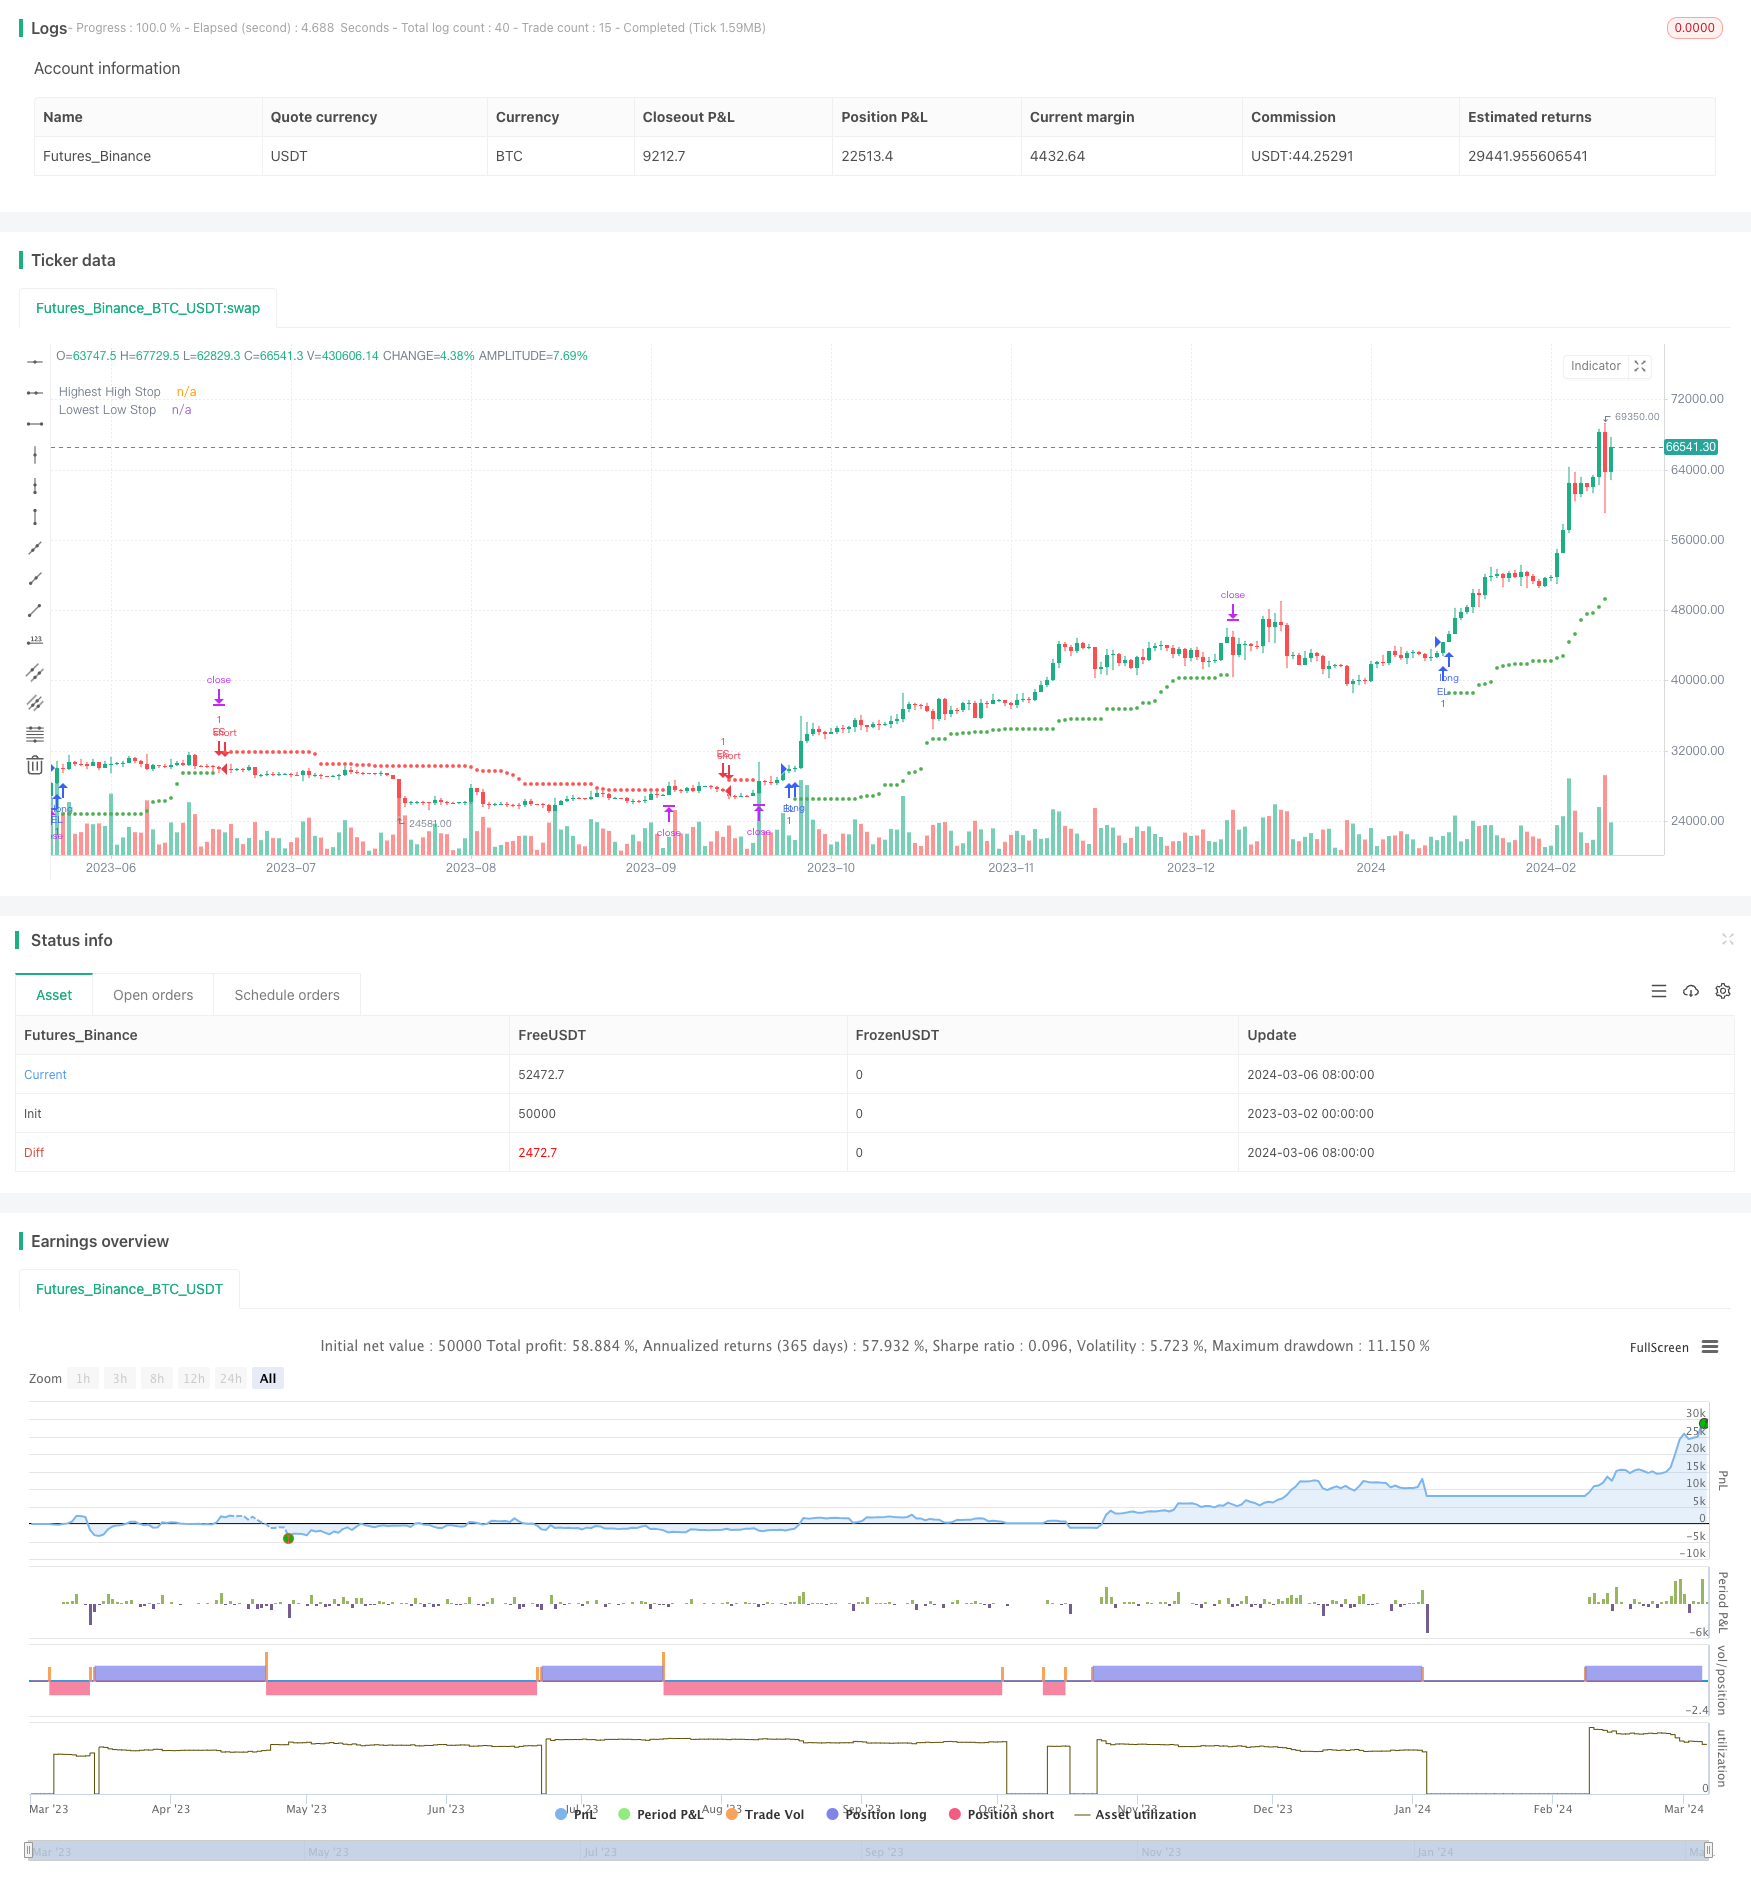 [trans]
概述
该策略基于近期最高价和最低价设置止损点,以快速切入趋势并严格控制风险。当价格出现连续上涨时开多单,连续下跌时开空单。持仓时,多单止损位置为最近几根K线的最低价,空单止损位置为最近几根K线的最高价。这种动态止损方式能高效捕捉趋势,同时严格限制损失。
策略原理
- 通过
input函数设置最高价和最低价参考周期hiLen和loLen,默认为20。 - 用
ta.highest(high, hiLen)[1]计算前一根K线为止的最高价hiHighs,用ta.lowest(low, loLen)[1]计算前一根K线为止的最低价loLows。 - 画出止损位置,多单止损位置为
loLows,空单止损位置为hiHighs,不持仓时不画,方便直观确认。 - 定义交易信号条件:
- 最近3根K线收盘价连续上涨为
higherCloses - 最近3根K线收盘价连续下跌为
lowerCloses - 当前无持仓为
isFlat
- 最近3根K线收盘价连续上涨为
- 开仓:满足
isFlat和higherCloses时开多单,满足isFlat和lowerCloses时开空单。 - 止损:多单持仓时,止损价格为
loLows,空单持仓时,止损价格为hiHighs。
简言之,该策略用近期最高最低价设置移动止损,快速切入强劲趋势并严格限损,能高效捕捉趋势收益。
优势分析
- 简单有效:该策略逻辑清晰简单,基于价格本身设置止损,能有效捕捉趋势。
- 快速切入:连续三根K线同向运动即可开仓,能快速切入新趋势。
- 止损严格:止损位置为近期最高价或最低价,与当前价格紧密相关,风险控制严格。
- 移动止损:止损位置会随着价格不断更新,既能锁定利润,又能保留趋势空间。
- 适应性强:适用于各类市场与品种,参数也可灵活调整。
风险分析
- 震荡市风险:震荡市场会导致频繁开仓止损,策略表现不佳。解决办法是避开震荡市,或增大开仓条件以过滤。
- 趋势末期风险:当趋势即将反转时,有可能刚开仓就遇到反转,导致亏损。解决办法是配合趋势判断指标,及时了结。
- 极端行情风险:极端超跌反弹或超涨杀跌时,移动止损可能无法很好地保护头寸。解决办法是设置固定止损位。
- 参数风险:参数设置不当会导致开仓止损过于频繁。解决办法是做好参数优化。
优化方向
- 趋势判断:增加趋势判断指标,如均线,只在大趋势方向开仓,提高胜率。
- 结合波动:根据ATR等波动指标调整参数,应对不同波动。
- 动量确认:加入动量指标确认,如MACD,只在动量支持下开仓。
- 优化止损:可以结合百分比止损,避免极端行情;也可增加保护性止损,降低单笔亏损。
- 仓位管理:可以优化仓位管理,如根据风险水平调整仓位,提高风险收益比。
总结
该最高最低价格止损策略基于价格本身设置动态止损,能高效捕捉强劲趋势,严格控制风险。其优点是简单有效,快速切入,止损严格,适应性强。但在震荡市、趋势末期、极端行情下表现欠佳,参数设置也需要注意。未来可通过增加趋势和动量判断、优化止损和仓位管理等方式改进。总的来说,这是一个兼顾趋势捕捉和风险控制的简单有效策略,值得在实践中深入研究和优化。
||
Overview
This strategy sets stop-loss points based on recent highest highs and lowest lows to quickly enter trends and strictly control risks. It enters long positions when prices rise consecutively and short positions when prices fall consecutively. When holding positions, the stop-loss level for long positions is the lowest low of the recent few bars, and the stop-loss level for short positions is the highest high. This dynamic stop-loss approach can efficiently capture trends while strictly limiting losses.
Strategy Principles
- Use the
inputfunction to set the lookback periodshiLenandloLenfor highest highs and lowest lows, defaulting to 20. - Calculate the highest high
hiHighsup to the previous bar usingta.highest(high, hiLen)[1], and the lowest lowloLowsusingta.lowest(low, loLen)[1]. - Plot the stop-loss levels, with
loLowsfor long positions andhiHighsfor short positions. Don't plot when flat for easy confirmation. - Define trade signal conditions:
higherCloses: the last 3 bars have consecutively higher closeslowerCloses: the last 3 bars have consecutively lower closesisFlat: no current position
- Entry: enter long when
isFlatandhigherCloses, enter short whenisFlatandlowerCloses. - Stop-loss: for long positions, stop out at
loLows; for short positions, stop out athiHighs.
In short, this strategy uses recent highest highs and lowest lows to set trailing stops, quickly entering strong trends and strictly limiting losses, thus efficiently capturing trend profits.
Advantage Analysis
- Simple and effective: the strategy has clear and simple logic, setting stops based on prices themselves to effectively capture trends.
- Quick entry: entering on 3 consecutive bars moving in the same direction allows quickly entering new trends.
- Strict stops: stops are set at recent extreme prices, closely tied to current prices for strict risk control.
- Trailing stops: stop levels are continuously updated with prices, both locking in profits and retaining trend room.
- Highly adaptable: suitable for various markets and instruments, with flexibly adjustable parameters.
Risk Analysis
- Choppy market risk: choppy markets can cause frequent entries and stops, degrading performance. Avoid choppy markets or increase entry conditions to filter.
- Trend end risk: when a trend is about to reverse, a new entry may immediately face reversal and loss. Use trend identification indicators to exit in time.
- Extreme movement risk: in extreme oversold bounces or overbought drops, trailing stops may not protect positions well. Set fixed stop levels.
- Parameter risk: improper parameters can cause overly frequent entries and exits. Perform parameter optimization.
Optimization Directions
- Trend identification: add trend indicators like moving averages and only trade in the major trend direction to improve win rate.
- Incorporate volatility: adjust parameters based on volatility indicators like ATR to adapt to different volatilities.
- Momentum confirmation: add momentum indicators like MACD to confirm entries only with momentum support.
- Optimize stops: combine with percentage stops for extreme moves; add protective stops to reduce per-trade losses.
- Position sizing: optimize position sizing, e.g. adjust size based on risk levels to improve risk-reward ratio.
Summary
This highest high/lowest low stop strategy sets dynamic stops based on prices themselves to efficiently capture strong trends and strictly control risks. Its advantages are simplicity, effectiveness, quick entries, strict stops, and high adaptability. However, it performs poorly in choppy markets, trend ends, and extreme movements, and requires attention to parameter settings. Future improvements can add trend and momentum confirmation, optimize stops and position sizing. Overall, it is a simple and effective strategy balancing trend-capturing and risk control that deserves in-depth research and optimization in practice.
[/trans]
Strategy Arguments
| Argument | Default | Description |
|---|---|---|
| v_input_int_1 | 20 | Highest High Lookback |
| v_input_int_2 | 20 | Lowest Low Lookback |
Source (PineScript)
/*backtest
start: 2023-03-02 00:00:00
end: 2024-03-07 00:00:00
period: 1d
basePeriod: 1h
exchanges: [{"eid":"Futures_Binance","currency":"BTC_USDT"}]
*/

//@version=5
strategy(title="Highest high/lowest low stop", overlay=true)

// STEP 1:
// Make inputs for length of highest high and lowest low
hiLen = input.int(20, title="Highest High Lookback", minval=2)
loLen = input.int(20, title="Lowest Low Lookback", minval=2)

// STEP 2:
// Calculate recent extreme high and low
hiHighs = ta.highest(high, hiLen)[1]
loLows  = ta.lowest(low, loLen)[1]

// Plot stop values for visual confirmation
plot(strategy.position_size > 0 ? loLows : na,
     style=plot.style_circles, color=color.green, linewidth=3,
     title="Lowest Low Stop")

plot(strategy.position_size < 0 ? hiHighs : na,
     style=plot.style_circles, color=color.red, linewidth=3,
     title="Highest High Stop")

// Trading conditions for this example strategy
higherCloses = close > close[1] and
     close[1] > close[2] and
     close[2] > close[3]

lowerCloses = close < close[1] and
     close[1] < close[2] and
     close[2] < close[3]

isFlat = strategy.position_size == 0

// Submit entry orders
if isFlat and higherCloses
    strategy.entry("EL", strategy.long)

if isFlat and lowerCloses
    strategy.entry("ES", strategy.short)

// STEP 3:
// Submit stops based on highest high and lowest low
if strategy.position_size > 0
    strategy.exit("XL HH", stop=loLows)

if strategy.position_size < 0
    strategy.exit("XS LL", stop=hiHighs)
Detail
https://www.fmz.com/strategy/443993
Last Modified
2024-03-08 14:32:30