
7.3 KiB
Name
智能均线交叉策略与动态止盈止损系统-Intelligent-Moving-Average-Crossover-Strategy-with-Dynamic-Profit-Loss-Management-System
Author
ChaoZhang
Strategy Description
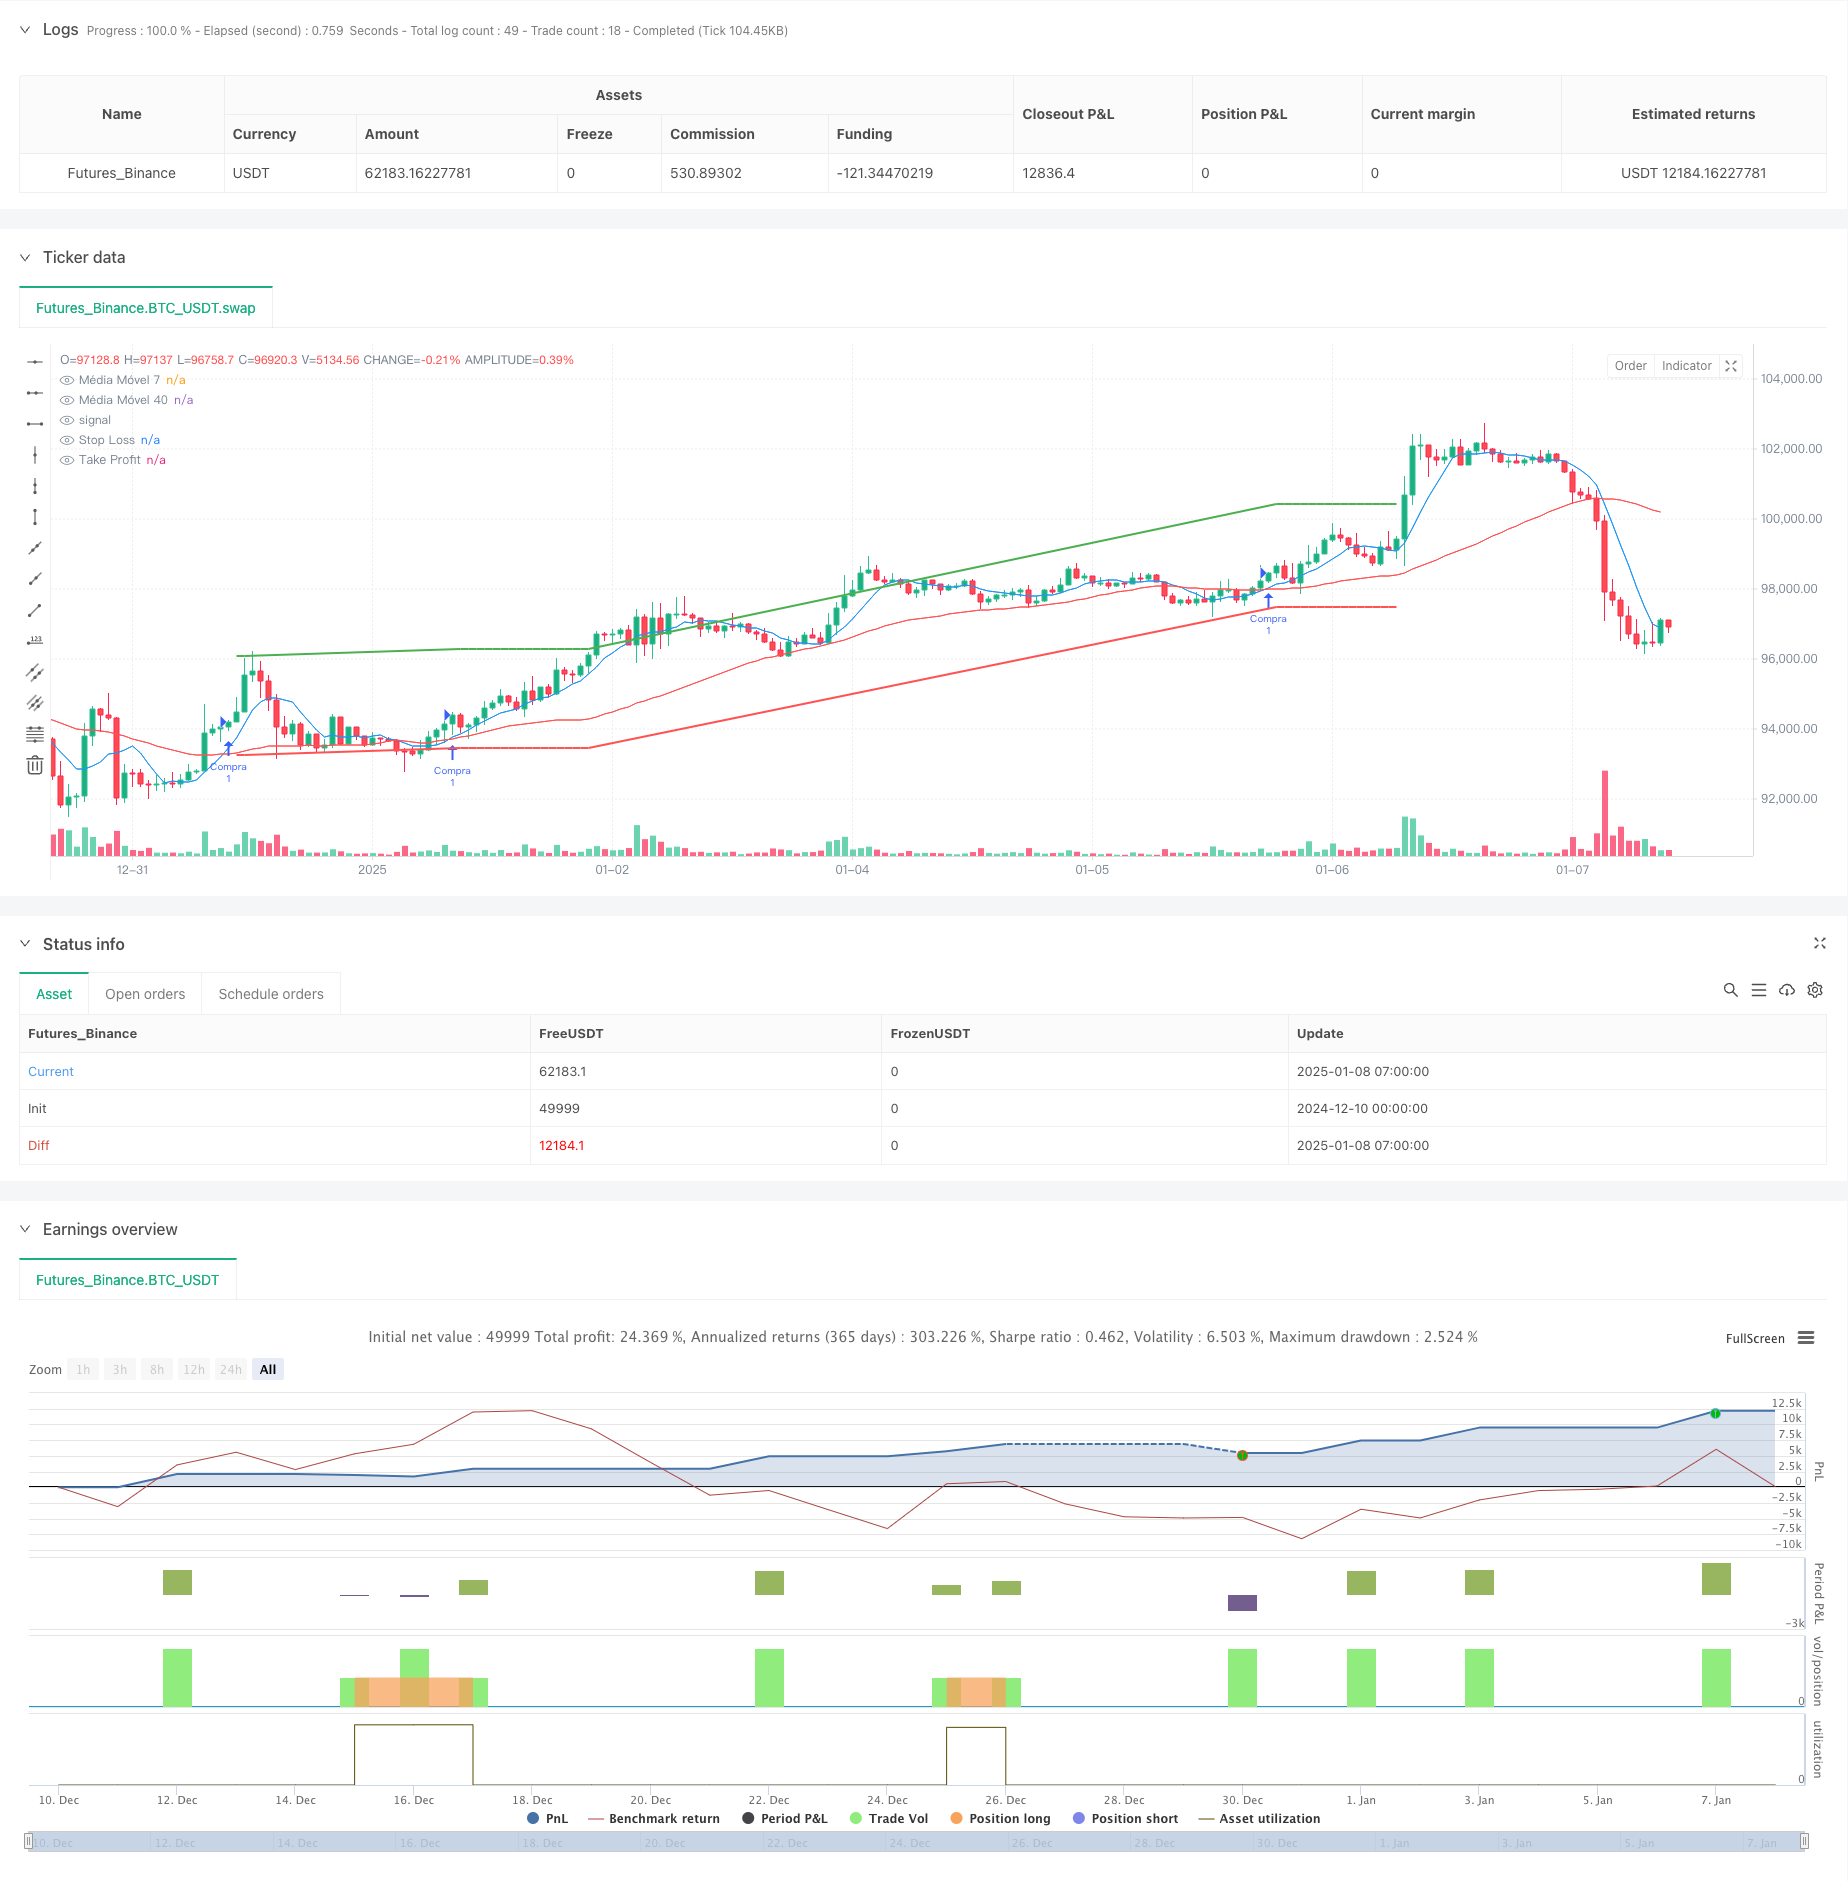
[trans]
概述
本策略是一个基于均线交叉信号的智能交易系统,结合了动态止盈止损管理机制。策略核心采用7周期和40周期两条简单移动平均线(SMA)的交叉来产生交易信号,同时集成了基于百分比的止盈止损控制系统,实现了对交易风险的精确管理。
策略原理
策略运作基于以下核心机制:
- 信号生成:通过观察短周期(7日)均线与长周期(40日)均线的交叉情况产生交易信号。当短期均线向上穿越长期均线时产生买入信号,向下穿越时产生卖出信号。
- 仓位管理:系统采用单一持仓机制,在已有持仓的情况下不会重复开仓,确保资金使用的有效性。
- 风险控制:集成了基于开仓价格的动态止盈止损系统。止损位设置为开仓价格下方1%,止盈位设置为开仓价格上方2%,实现了对每笔交易风险的量化管理。
策略优势
- 信号可靠性:通过结合快速和慢速均线,能够有效捕捉价格趋势的变化。
- 风险管理完善:引入了动态止盈止损机制,对每笔交易的风险进行精确控制。
- 参数灵活性:所有关键参数均可通过界面进行调整,包括均线周期、止盈止损比例等。
- 可视化效果:在图表上清晰显示均线、止盈止损位置,便于交易者实时监控。
策略风险
- 均线滞后性:移动平均线本质上是滞后指标,在剧烈波动市场中可能产生延迟。
- 震荡市场风险:在横盘震荡市场中可能频繁产生虚假信号。
- 固定止损风险:百分比固定止损可能在某些市场条件下不够灵活。
策略优化方向
- 信号过滤:建议引入趋势过滤器,如ADX指标,用于识别趋势强度。
- 动态止损:可考虑将止损位与市场波动率挂钩,实现更智能的风险管理。
- 仓位管理:引入基于波动率的动态仓位管理系统。
- 市场适应性:增加市场状态识别模块,在不同市场条件下采用不同的参数设置。
总结
该策略通过均线交叉捕捉市场趋势,结合动态止盈止损实现风险管理,具有较强的实用性。虽然存在一定的滞后性风险,但通过建议的优化方向可以进一步提升策略的稳定性和盈利能力。策略的可配置性强,适合进一步完善和个性化调整。 ||
Overview
This strategy is an intelligent trading system based on moving average crossover signals, combined with a dynamic profit/loss management mechanism. The core strategy uses the crossover of 7-period and 40-period Simple Moving Averages (SMA) to generate trading signals, while integrating a percentage-based stop-loss and take-profit control system for precise risk management.
Strategy Principles
The strategy operates based on the following core mechanisms:
- Signal Generation: Trading signals are generated by observing the crossover between short-period (7-day) and long-period (40-day) moving averages. Buy signals are generated when the short-term MA crosses above the long-term MA, and sell signals when it crosses below.
- Position Management: The system employs a single position mechanism, preventing multiple entries while a position is open to ensure effective capital utilization.
- Risk Control: Integrates a dynamic stop-loss/take-profit system based on entry price. Stop-loss is set at 1% below entry price, and take-profit at 2% above, enabling quantified risk management for each trade.
Strategy Advantages
- Signal Reliability: Effectively captures price trend changes by combining fast and slow moving averages.
- Comprehensive Risk Management: Incorporates dynamic stop-loss/take-profit mechanisms for precise risk control of each trade.
- Parameter Flexibility: All key parameters can be adjusted through the interface, including MA periods and profit/loss percentages.
- Visualization: Clearly displays moving averages and profit/loss levels on the chart for real-time monitoring.
Strategy Risks
- MA Lag: Moving averages are inherently lagging indicators, potentially causing delays in volatile markets.
- Sideways Market Risk: May generate frequent false signals in range-bound markets.
- Fixed Stop-Loss Risk: Percentage-based fixed stops may lack flexibility under certain market conditions.
Strategy Optimization Directions
- Signal Filtering: Recommend incorporating trend filters, such as ADX, to identify trend strength.
- Dynamic Stops: Consider linking stop-loss levels to market volatility for smarter risk management.
- Position Sizing: Introduce volatility-based dynamic position sizing system.
- Market Adaptability: Add market state recognition module for different parameter settings under various market conditions.
Summary
This strategy captures market trends through moving average crossovers while implementing risk management through dynamic profit/loss controls, demonstrating strong practicality. While there are inherent lag risks, the suggested optimization directions can further enhance strategy stability and profitability. The strategy's high configurability makes it suitable for further refinement and customization.[/trans]
Source (PineScript)
/*backtest
start: 2024-12-10 00:00:00
end: 2025-01-08 08:00:00
period: 1h
basePeriod: 1h
exchanges: [{"eid":"Futures_Binance","currency":"BTC_USDT","balance":49999}]
*/

//@version=5
strategy("Cruzamento de Médias Móveis (Configuração Interativa)", overlay=true)

// Permite que o usuário defina os períodos das médias móveis na interface
periodo_ma7 = input.int(7, title="Período da Média Móvel 7", minval=1)
periodo_ma40 = input.int(40, title="Período da Média Móvel 40", minval=1)

// Definindo as médias móveis com os períodos configuráveis
ma7 = ta.sma(close, periodo_ma7)
ma40 = ta.sma(close, periodo_ma40)

// Parâmetros de stop loss e take profit
stop_loss_pct = input.float(1, title="Stop Loss (%)", minval=0.1) / 100
take_profit_pct = input.float(2, title="Take Profit (%)", minval=0.1) / 100

// Condições para compra e venda
compra = ta.crossover(ma7, ma40)
venda = ta.crossunder(ma7, ma40)

// Impede novas entradas enquanto já houver uma posição aberta
if (compra and strategy.position_size == 0)
    strategy.entry("Compra", strategy.long)

// Cálculo do preço de stop loss e take profit
stop_loss_price = strategy.position_avg_price * (1 - stop_loss_pct)
take_profit_price = strategy.position_avg_price * (1 + take_profit_pct)

// Estratégia de saída com stop loss e take profit
strategy.exit("Saída", from_entry="Compra", stop=stop_loss_price, limit=take_profit_price)

// Sinal de venda (fechamento da posição)
if (venda)
    strategy.close("Compra")

// Plotando as médias móveis no gráfico
plot(ma7, color=color.blue, title="Média Móvel 7")
plot(ma40, color=color.red, title="Média Móvel 40")

// Plotando o Stop Loss e Take Profit no gráfico
plot(stop_loss_price, color=color.red, style=plot.style_line, linewidth=2, title="Stop Loss")
plot(take_profit_price, color=color.green, style=plot.style_line, linewidth=2, title="Take Profit")
Detail
https://www.fmz.com/strategy/477955
Last Modified
2025-01-10 15:39:12