
19 KiB
Name
智能交易动量均线混合策略-Smart-Trading-Momentum-and-Moving-Average-Hybrid-Strategy
Author
ianzeng123
Strategy Description
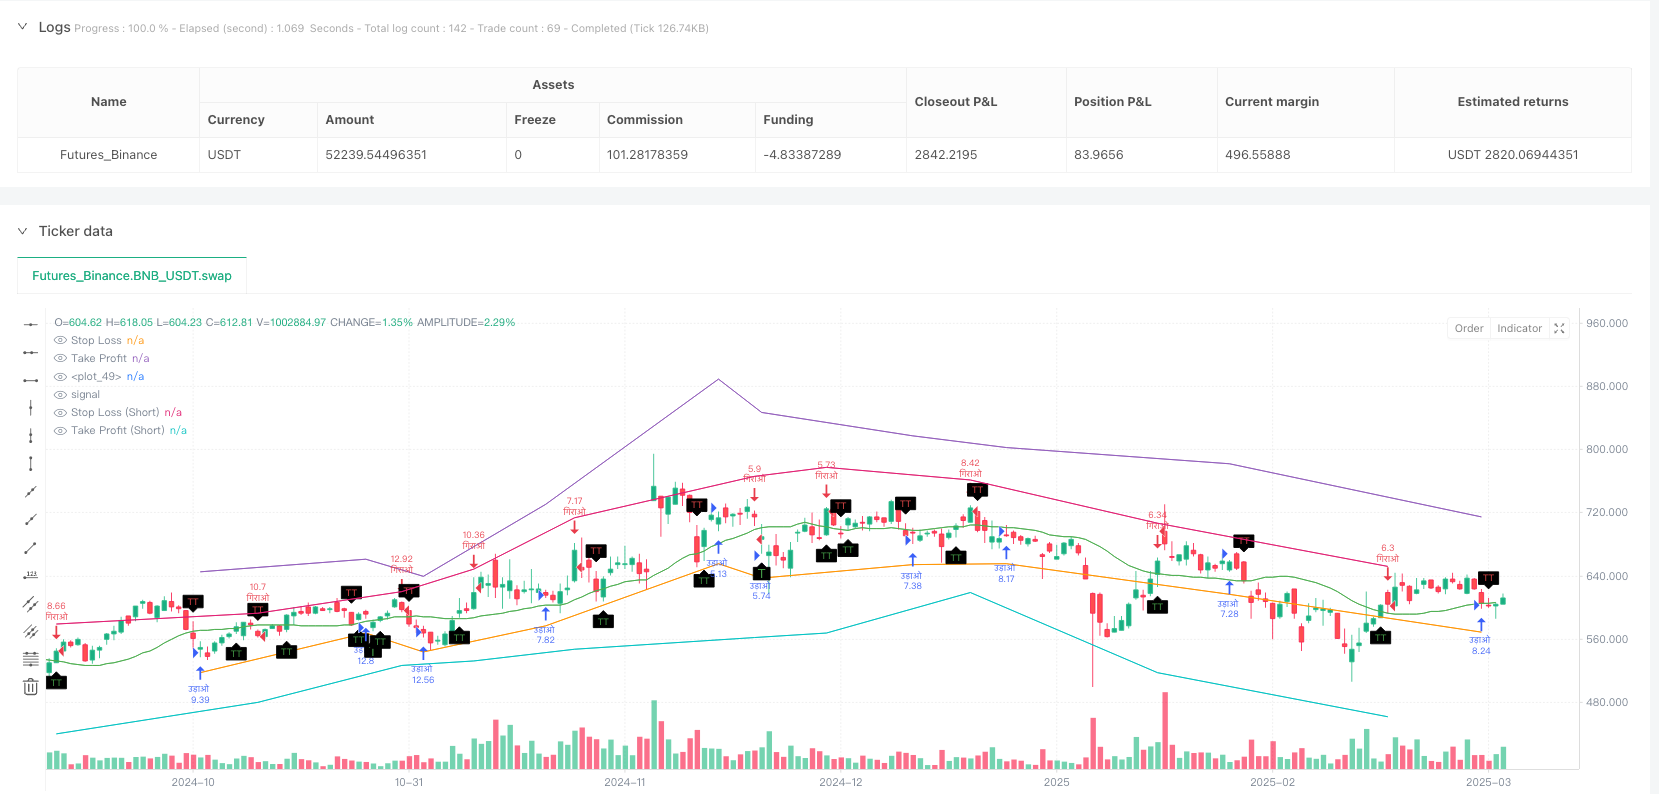
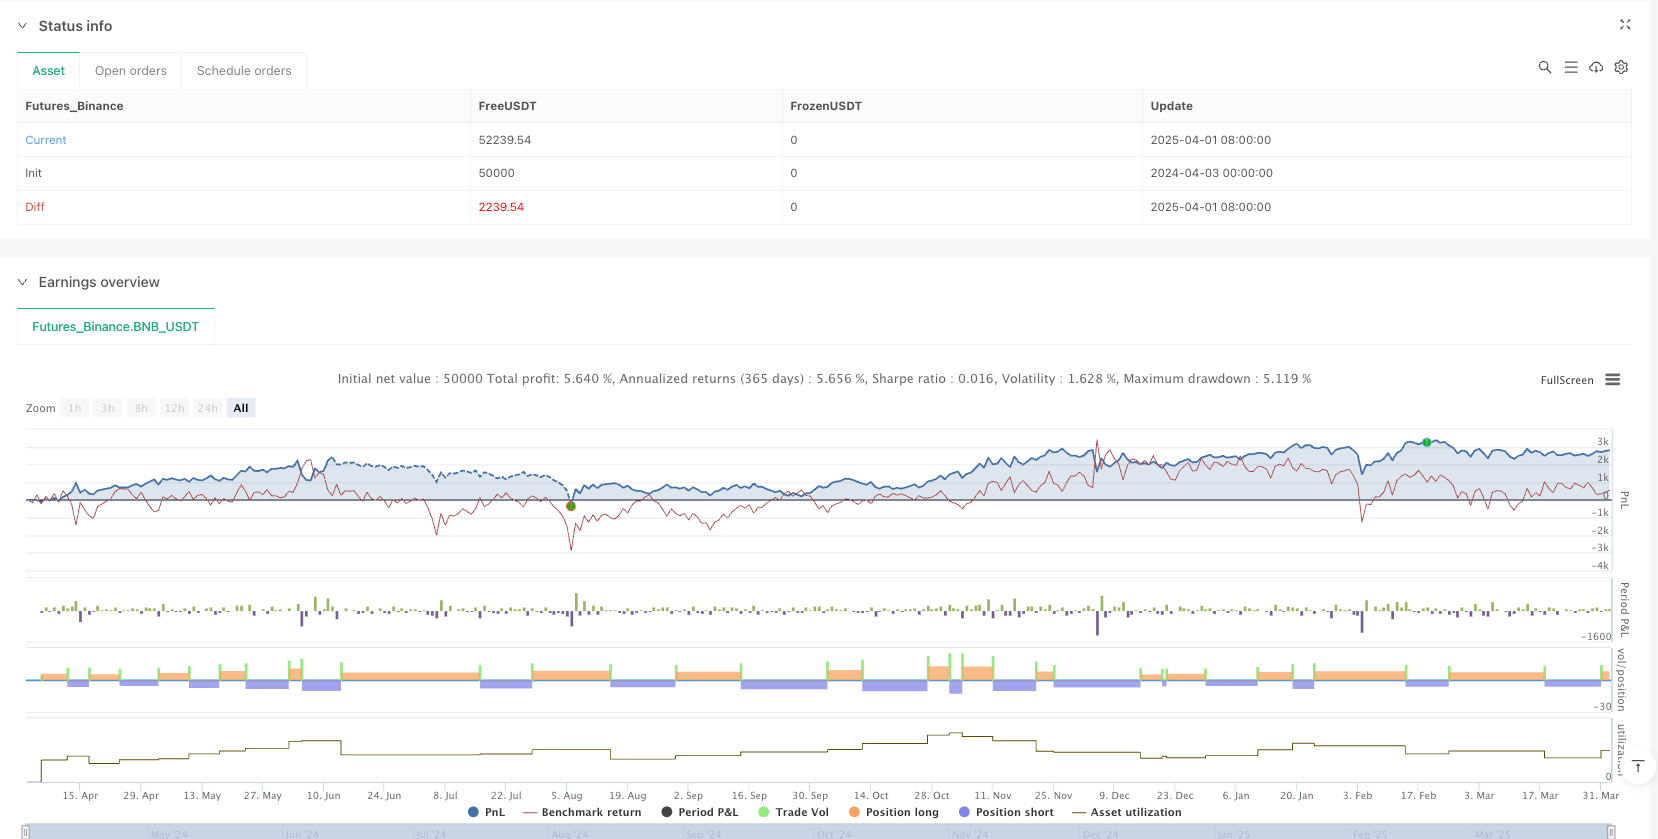
[trans]
概述
智能交易动量均线混合策略是一种结合了技术分析指标和蜡烛图形态识别的量化交易策略。该策略利用简单移动平均线(SMA)交叉信号、蜡烛图形态识别和波动率调整的止损位来确定市场入场和出场点。同时,策略还融合了风险管理和精确的仓位计算方法,通过设定每笔交易的风险百分比和风险回报比来优化交易绩效。策略在价格穿越22周期SMA时生成T和TT信号标签,为交易者提供额外的视觉确认。
策略原理
该策略的核心原理基于多重技术分析方法的组合使用,以增强交易信号的可靠性。策略主要依赖以下几个关键组件:
-
移动平均线交叉:利用13周期和5周期的简单移动平均线(SMA)交叉来触发买入和卖出信号。当快速移动平均线(较短周期)向上穿越慢速移动平均线(较长周期)时生成买入信号;当快速移动平均线向下穿越慢速移动平均线时生成卖出信号。
-
蜡烛图形态识别:策略集成了多种蜡烛图形态识别功能,包括看涨吞没形态、看跌吞没形态、锤子线、倒锤子线、看涨孕线和看跌孕线。这些形态在图表上以不同颜色显示,为交易决策提供额外确认。
-
波动率调整的止损位:使用平均真实范围(ATR)指标计算止损距离,通过乘以用户定义的ATR乘数来调整止损位置。这种方法使止损更加适应市场当前的波动性。
-
精确的仓位计算:基于初始资金、每笔交易的风险百分比和ATR计算的止损距离来精确确定仓位大小,从而实现风险的一致控制。
-
T和TT信号系统:策略还包括一个视觉信号系统,当价格穿越22周期SMA时生成T和TT标签。这些标签根据穿越方向和蜡烛收盘价与开盘价的关系呈现不同颜色,提供额外的交易确认。
策略优势
该策略具有以下显著优势:
-
多重确认机制:通过结合移动平均线交叉、蜡烛图形态和T/TT信号系统,提供多层交易确认,降低假信号风险。
-
动态风险管理:使用ATR指标调整止损位置,使策略能够根据市场波动性自动调整保护措施,在波动较大时提供更宽的止损空间,在波动较小时提供更紧的止损。
-
精确的资金管理:通过基于风险百分比的仓位计算,确保每笔交易风险一致,无论市场波动性如何,都能保持相同的风险暴露。
-
可视化交易信号:策略在图表上直观地显示蜡烛图形态和T/TT信号,使交易者能够快速识别潜在的交易机会。
-
自定义风险参数:允许交易者根据个人风险偏好调整关键参数,如每笔交易的风险百分比、风险回报比和ATR乘数,使策略适应不同的交易风格和市场条件。
策略风险
尽管该策略设计全面,但仍存在以下潜在风险:
-
均线交叉延迟:移动平均线是滞后指标,可能导致在趋势反转时入场过晚,从而错过初始的价格走势。解决方法是结合其他领先指标或减小移动平均线周期来提高响应速度。
-
快速市场波动风险:在高波动性市场条件下,价格可能跳过预设的止损位,导致实际损失超过预期。考虑使用保证止损订单或增加ATR乘数来应对这种情况。
-
过度交易风险:频繁的均线交叉可能导致过度交易,特别是在横盘市场中。可以通过添加额外的过滤器(如趋势强度指标)来减少假信号。
-
参数敏感性:策略性能对参数选择(如移动平均线周期、ATR周期和乘数)高度敏感。需要进行彻底的回测和参数优化,以找到适合特定市场的最佳设置。
-
蜡烛图形态误识别:在某些市场条件下,蜡烛图形态识别可能不够准确,导致错误信号。建议将蜡烛图形态作为辅助确认而非主要交易信号。
策略优化方向
基于代码分析,该策略可以在以下几个方向进行优化:
-
增加趋势过滤器:引入趋势强度指标(如ADX或MACD)作为额外过滤器,只在确认的趋势方向上交易,避免横盘市场中的假信号。这样可以提高交易质量和成功率。
-
整合交易量确认:将交易量分析添加到策略中,要求在信号生成时伴随交易量增加,这可以增强信号的可靠性,特别是在突破和反转模式中。
-
实现自适应参数:开发自适应机制,根据市场条件自动调整移动平均线周期和ATR乘数。例如,在波动性较高的市场中使用较长的移动平均线周期和较大的ATR乘数。
-
添加时间过滤器:实现交易时间过滤器,避开已知的低流动性或高波动性时段,如市场开盘或重要经济数据发布时间。
-
改进入场逻辑:结合价格行为模式和支撑/阻力水平来优化入场点,而不仅仅依赖均线交叉,这可以提高入场精度和减少滑点。
-
多时间框架分析:添加多时间框架确认,确保交易方向与更高时间框架的趋势一致,从而减少逆势交易并提高胜率。
-
部分利润锁定机制:实现阶梯式获利了结策略,在价格达到特定目标时锁定部分利润,同时移动止损至盈亏平衡点或小幅盈利位置,保护已获利润。
总结
智能交易动量均线混合策略是一个全面的交易系统,结合了技术分析、风险管理和精确的仓位计算。其核心优势在于多层信号确认、动态风险管理和直观的可视化交易信号。通过结合移动平均线交叉、蜡烛图形态识别和波动率调整的止损位,该策略为交易者提供了一个结构化的交易框架。尽管存在均线延迟和参数敏感性等风险,但通过实施建议的优化措施,如增加趋势过滤器、整合交易量确认和多时间框架分析,可以显著提高策略的稳健性和性能。该策略特别适合寻求系统化方法并重视风险管理的中长期交易者,通过合理的参数调整和策略优化,可以适应多种市场环境和交易品种。 ||
Overview
The Smart Trading Momentum and Moving Average Hybrid Strategy is a quantitative trading approach that combines technical indicators with candlestick pattern recognition. This strategy utilizes Simple Moving Average (SMA) crossover signals, candlestick pattern identification, and volatility-adjusted stop-loss levels to determine market entry and exit points. Additionally, the strategy incorporates risk management and precise position sizing methods by setting a risk percentage per trade and a risk-reward ratio to optimize trading performance. The strategy generates T and TT signal labels when prices cross the 22-period SMA, providing traders with additional visual confirmation.
Strategy Principles
The core principle of this strategy is based on the combined use of multiple technical analysis methods to enhance the reliability of trading signals. The strategy primarily relies on the following key components:
-
Moving Average Crossovers: Utilizes crossovers between 13-period and 5-period Simple Moving Averages (SMA) to trigger buy and sell signals. When the fast moving average (shorter period) crosses above the slow moving average (longer period), a buy signal is generated; when the fast moving average crosses below the slow moving average, a sell signal is generated.
-
Candlestick Pattern Recognition: The strategy integrates multiple candlestick pattern recognition functions, including bullish engulfing, bearish engulfing, hammer, inverted hammer, bullish harami, and bearish harami patterns. These patterns are displayed in different colors on the chart, providing additional confirmation for trading decisions.
-
Volatility-Adjusted Stop Losses: Uses the Average True Range (ATR) indicator to calculate stop-loss distances, adjusting stop-loss placement by multiplying by a user-defined ATR multiplier. This approach makes the stop-loss more adaptive to the current market volatility.
-
Precise Position Sizing: Calculates position size based on initial capital, risk percentage per trade, and ATR-calculated stop-loss distance, ensuring consistent risk control.
-
T and TT Signal System: The strategy also includes a visual signal system that generates T and TT labels when price crosses the 22-period SMA. These labels appear in different colors based on the direction of the cross and the relationship between closing and opening prices, providing additional trade confirmation.
Strategy Advantages
This strategy offers several significant advantages:
-
Multiple Confirmation Mechanisms: By combining moving average crossovers, candlestick patterns, and T/TT signal system, it provides multiple layers of trade confirmation, reducing the risk of false signals.
-
Dynamic Risk Management: Uses the ATR indicator to adjust stop-loss placement, allowing the strategy to automatically adapt protective measures based on market volatility, providing wider stops in more volatile markets and tighter stops in less volatile conditions.
-
Precise Capital Management: Through risk percentage-based position sizing, ensures consistent risk per trade, maintaining the same risk exposure regardless of market volatility.
-
Visualized Trading Signals: The strategy visually displays candlestick patterns and T/TT signals on the chart, allowing traders to quickly identify potential trading opportunities.
-
Customizable Risk Parameters: Allows traders to adjust key parameters according to personal risk preferences, such as risk percentage per trade, risk-reward ratio, and ATR multiplier, making the strategy adaptable to different trading styles and market conditions.
Strategy Risks
Despite its comprehensive design, the strategy still carries the following potential risks:
-
Moving Average Lag: Moving averages are lagging indicators and may lead to late entries during trend reversals, missing initial price movements. The solution is to combine other leading indicators or reduce the moving average periods to improve responsiveness.
-
Rapid Market Fluctuation Risk: In highly volatile market conditions, prices may gap beyond preset stop-loss levels, resulting in actual losses exceeding expectations. Consider using guaranteed stop orders or increasing the ATR multiplier to address this situation.
-
Overtrading Risk: Frequent moving average crossovers may lead to overtrading, especially in ranging markets. This can be mitigated by adding additional filters, such as trend strength indicators.
-
Parameter Sensitivity: Strategy performance is highly sensitive to parameter choices (such as moving average periods, ATR period, and multiplier). Thorough backtesting and parameter optimization are needed to find optimal settings for specific markets.
-
Candlestick Pattern Misidentification: In certain market conditions, candlestick pattern recognition may not be accurate enough, leading to false signals. It's recommended to use candlestick patterns as supplementary confirmation rather than primary trading signals.
Strategy Optimization Directions
Based on code analysis, the strategy can be optimized in the following directions:
-
Add Trend Filters: Introduce trend strength indicators (such as ADX or MACD) as additional filters, trading only in confirmed trend directions to avoid false signals in ranging markets. This can improve trade quality and success rate.
-
Integrate Volume Confirmation: Add volume analysis to the strategy, requiring volume increase when signals are generated, enhancing signal reliability, especially in breakout and reversal patterns.
-
Implement Adaptive Parameters: Develop adaptive mechanisms to automatically adjust moving average periods and ATR multipliers based on market conditions. For example, use longer moving average periods and larger ATR multipliers in more volatile markets.
-
Add Time Filters: Implement trading time filters to avoid known low-liquidity or high-volatility periods, such as market openings or important economic data release times.
-
Improve Entry Logic: Combine price action patterns and support/resistance levels to optimize entry points, rather than relying solely on moving average crossovers, improving entry precision and reducing slippage.
-
Multi-Timeframe Analysis: Add multi-timeframe confirmation to ensure trade direction aligns with higher timeframe trends, reducing counter-trend trades and improving win rates.
-
Partial Profit-Locking Mechanism: Implement a stepped profit-taking strategy, locking in partial profits when price reaches specific targets while moving stop-loss to breakeven or small profit positions, protecting gained profits.
Summary
The Smart Trading Momentum and Moving Average Hybrid Strategy is a comprehensive trading system that combines technical analysis, risk management, and precise position sizing. Its core strengths lie in multi-layered signal confirmation, dynamic risk management, and intuitive visualized trading signals. By combining moving average crossovers, candlestick pattern recognition, and volatility-adjusted stop losses, the strategy provides traders with a structured trading framework. Despite risks such as moving average lag and parameter sensitivity, by implementing the suggested optimization measures, such as adding trend filters, integrating volume confirmation, and multi-timeframe analysis, the strategy's robustness and performance can be significantly improved. This strategy is particularly suitable for medium to long-term traders who seek a systematic approach and value risk management, and through reasonable parameter adjustments and strategy optimization, it can adapt to various market environments and trading instruments.[/trans]
Source (PineScript)
/*backtest
start: 2024-04-03 00:00:00
end: 2025-04-02 00:00:00
period: 1d
basePeriod: 1d
exchanges: [{"eid":"Futures_Binance","currency":"BNB_USDT"}]
*/

//@version=5
strategy("Smart Trade By Amit Roy", overlay=true, default_qty_type=strategy.percent_of_equity, default_qty_value=100)

// Input Settings
riskPercent = input.float(3, title="Risk Percentage per Trade (%)", minval=0.1, step=0.1)
rewardRatio = input.float(3, title="Risk-Reward Ratio", minval=1.0)
capital = input.float(10000, title="Starting Capital ($)", minval=1)
atrMultiplier = input.float(1.5, title="ATR Multiplier for Stop Loss")
show_TT = input.bool(true, title = "Show T and TT")
show_sma = input.bool(true, title = "Show SMA")

// ATR Calculation for Volatility-based Stop-Loss
atrLength = input.int(14, title="ATR Length")
atrValue = ta.atr(atrLength)
stopLossDistance = atrValue * atrMultiplier
takeProfitDistance = stopLossDistance * rewardRatio

// Position Sizing Calculation
riskAmount = capital * (riskPercent / 100)
positionSize = riskAmount / stopLossDistance

// Simple Moving Averages
fastMA = ta.sma(close, 13)
slowMA = ta.sma(close, 5)

// Entry and Exit Conditions using Simple Moving Averages
longCondition = ta.crossover(fastMA, slowMA)
shortCondition = ta.crossunder(fastMA, slowMA)

// Candlestick Patterns Functions
isBullishEngulfing() => (open[1] > close[1] and close > open and close >= open[1] and close[1] >= open and close - open > open[1] - close[1])
isBearishEngulfing() => (close[1] > open[1] and open > close and open >= close[1] and open[1] >= close and open - close > close[1] - open[1])
isHammer() => (((high - low) > 3 * (open - close)) and ((close - low) / (.001 + high - low) > 0.6) and ((open - low) / (.001 + high - low) > 0.6))
isInvertedHammer() => (((high - low) > 3 * (open - close)) and ((high - close) / (.001 + high - low) > 0.6) and ((high - open) / (.001 + high - low) > 0.6))
isBullishHarami() => (open[1] > close[1] and close > open and close <= open[1] and close[1] <= open and close - open < open[1] - close[1])
isBearishHarami() => (close[1] > open[1] and open > close and open <= close[1] and open[1] <= close and open - close < close[1] - open[1])

// Color Bars for Candlestick Patterns
barcolor(isBullishEngulfing() ? color.rgb(0, 102, 255) : na)
barcolor(isHammer() ? (#1f0cef) : na)
barcolor(isBullishHarami() ? color.rgb(0, 93, 214) : na)
barcolor(isBearishEngulfing() ? color.rgb(255, 196, 0) : na)
barcolor(isBearishHarami() ? color.rgb(251, 255, 0) : na)
barcolor(isInvertedHammer() ? color.rgb(247, 0, 247) : na)

// Calculate SMA for Visualization
sma_22 = ta.sma(close, 22)
lineColor = close > sma_22 ? color.green : color.green
plot(show_sma ? sma_22 : na, color=lineColor, linewidth=1)

// Determine T and TT Labels based on Conditions
candleCrossG = ta.crossover(close, sma_22)
candleCrossR = ta.crossunder(close, sma_22)

// Plot T and TT labels
redT = candleCrossG and close < open
greenTT = candleCrossG and close > open and close > sma_22
greenT = candleCrossR and close > open
redTT = candleCrossR and close < open

plotshape(series=redT ? show_TT : na, title="Red-T", color=na, style=shape.labeldown, location=location.abovebar, size=size.small, textcolor=color.red, text="T")
plotshape(series=greenTT ? show_TT : na, title="Green-TT", color=na, style=shape.labelup, location=location.belowbar, size=size.tiny, textcolor=color.green, text="TT")
plotshape(series=greenT ? show_TT : na, title="Green-T", color=na, style=shape.labelup, location=location.belowbar, size=size.small, textcolor=color.green, text="T")
plotshape(series=redTT ? show_TT : na, title="Red-TT", color=na, style=shape.labeldown, location=location.abovebar, size=size.tiny, textcolor=color.red, text="TT")

// Place Trades Based on Conditions
if (longCondition)
    strategy.entry("उड़ाओ ", strategy.long, qty=positionSize)
    strategy.exit("Take Profit", from_entry="Long", limit=close + takeProfitDistance, stop=close - stopLossDistance)

if (shortCondition)
    strategy.entry("गिराओ", strategy.short, qty=positionSize)
    strategy.exit("Take Profit", from_entry="Short", limit=close - takeProfitDistance, stop=close + stopLossDistance)

// Plotting Stop Loss and Take Profit Levels for Visualization
plot(longCondition ? close - stopLossDistance : na, color=na, title="Stop Loss", linewidth=1, style=plot.style_line)
plot(longCondition ? close + takeProfitDistance : na, color=na, title="Take Profit", linewidth=1, style=plot.style_line)
plot(shortCondition ? close + stopLossDistance : na, color=na, title="Stop Loss (Short)", linewidth=1, style=plot.style_line)
plot(shortCondition ? close - takeProfitDistance : na, color=na, title="Take Profit (Short)", linewidth=1, style=plot.style_line)
Detail
https://www.fmz.com/strategy/489285
Last Modified
2025-04-03 10:42:22