
10 KiB
Name
星光移动平均交叉策略-Starlight-Moving-Average-Crossover-Strategy
Author
ChaoZhang
Strategy Description
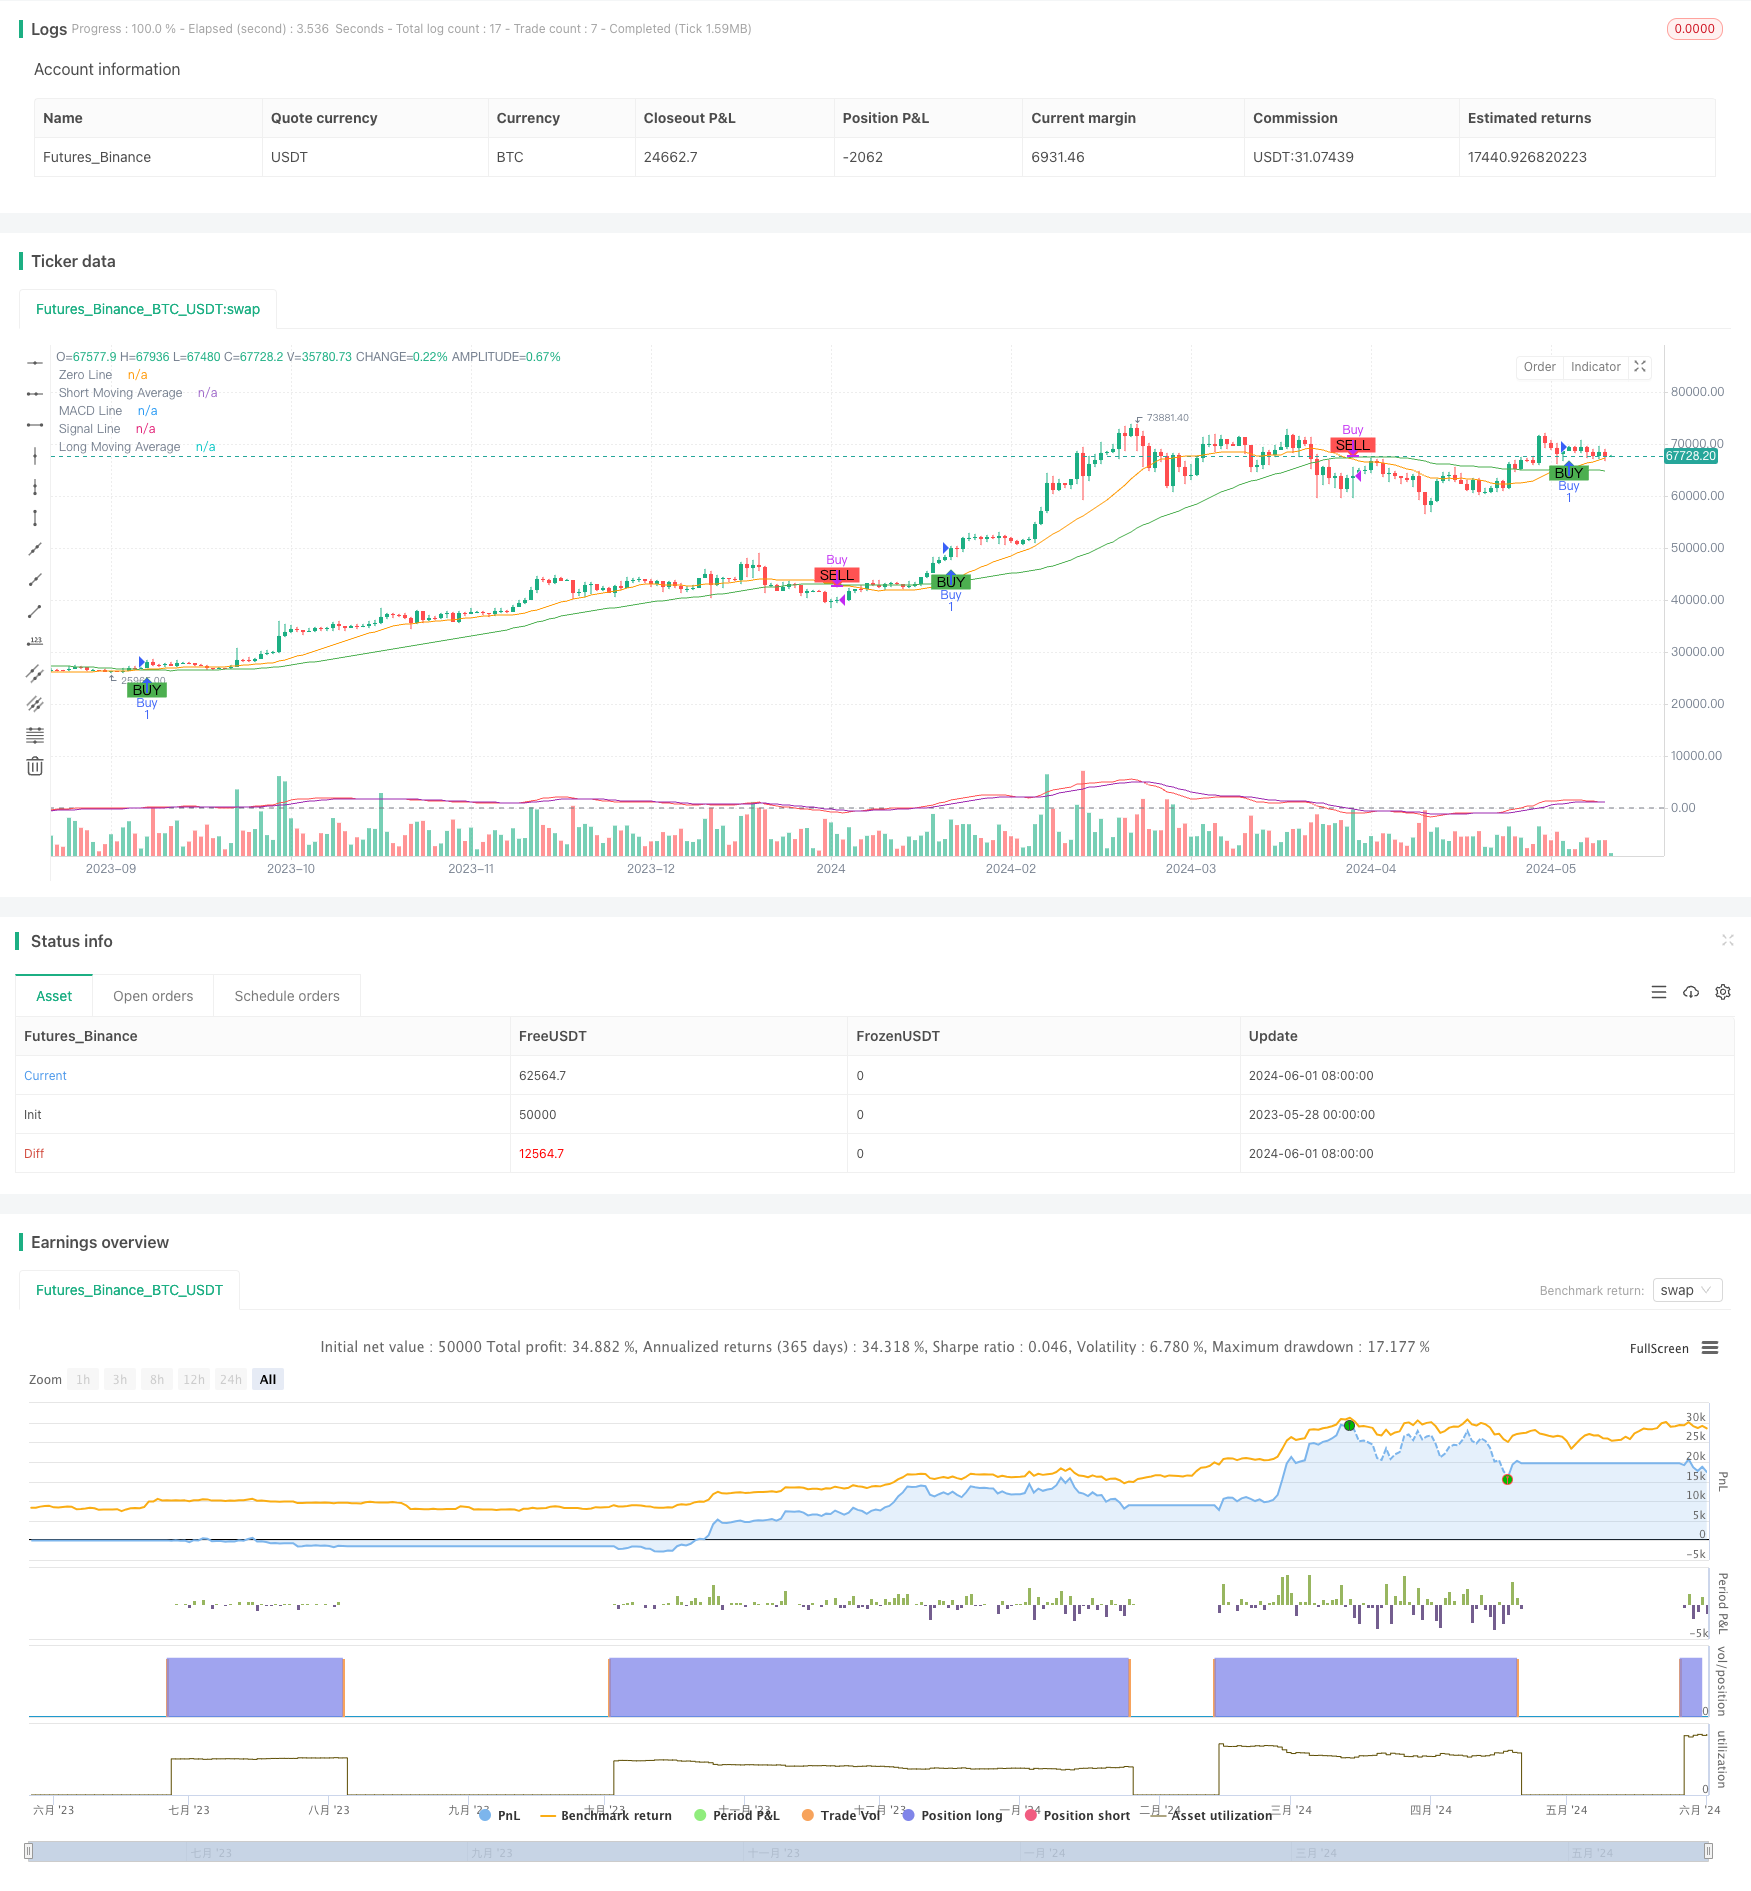 [trans]
概述
星光移动平均交叉策略是一种基于移动平均线和MACD指标的量化交易策略。该策略利用两条不同周期的简单移动平均线(SMA)的交叉信号来确定买卖时机,同时辅以MACD指标来辅助判断趋势和动量。当短期移动平均线向上突破长期移动平均线时,产生买入信号;反之,当短期移动平均线向下跌破长期移动平均线时,产生卖出信号。这种策略试图捕捉市场的中长期趋势,同时利用MACD指标来确认趋势的强度和可持续性。
策略原理
星光移动平均交叉策略的核心原理是利用不同周期移动平均线的交叉信号来判断市场趋势的变化。当短期移动平均线从下方向上突破长期移动平均线时,表明市场可能正在形成一个新的上升趋势,此时策略会产生买入信号。相反,当短期移动平均线从上方向下跌破长期移动平均线时,表明市场可能正在形成一个新的下降趋势,此时策略会产生卖出信号。
除了使用移动平均线交叉信号外,该策略还引入了MACD指标作为辅助判断工具。MACD由两条线组成:MACD线和信号线。当MACD线从下方向上突破信号线时,表明市场上升动能增强;反之,当MACD线从上方向下跌破信号线时,表明市场下降动能增强。MACD指标可以用来确认移动平均线交叉信号的有效性,提高策略的可靠性。
策略优势
- 简单易懂:星光移动平均交叉策略基于简单移动平均线和MACD指标,概念清晰,易于理解和实现。
- 趋势跟踪:通过使用不同周期的移动平均线,该策略能够有效地捕捉市场的中长期趋势,帮助投资者顺应市场的主要方向。
- 信号确认:引入MACD指标作为辅助判断工具,可以提高移动平均线交叉信号的可靠性,减少虚假信号。
- 适应性强:该策略可以通过调整移动平均线的周期和MACD指标的参数来适应不同的市场环境和投资者偏好。
策略风险
- 滞后性:移动平均线是一种滞后指标,它对市场变化的反应相对较慢,可能导致错过最佳的买卖时机。
- 振荡市场:在市场波动较大、没有明显趋势的情况下,频繁的移动平均线交叉信号可能导致过多的交易,增加交易成本和风险。
- 参数敏感:策略的表现很大程度上取决于所选择的移动平均线周期和MACD指标参数,不恰当的参数设置可能导致策略失效。
策略优化方向
- 参数优化:对移动平均线的周期和MACD指标的参数进行优化,以适应不同的市场环境和资产特征,提高策略的稳健性和盈利能力。
- 信号过滤:引入其他技术指标或市场情绪指标,对移动平均线交叉信号进行过滤,减少虚假信号和噪音干扰。
- 风险管理:结合止损和仓位管理策略,控制单笔交易的风险敞口,防止重大损失。
- 多市场测试:在不同的市场和资产上测试策略,评估其适用性和稳健性,必要时进行策略调整。
总结
星光移动平均交叉策略是一种基于趋势跟踪和动量确认的量化交易策略。它利用了不同周期移动平均线的交叉信号和MACD指标来捕捉市场的中长期趋势,具有简单易懂、趋势跟踪、信号确认和适应性强等优势。然而,该策略也存在滞后性、振荡市场和参数敏感等风险。为了进一步提升策略的表现,可以从参数优化、信号过滤、风险管理和多市场测试等方面进行优化和改进。总的来说,星光移动平均交叉策略为量化交易者提供了一个基于经典技术指标的交易框架,但在实际应用中需要结合具体市场环境和个人偏好进行调整和优化。
||
Overview
The Starlight Moving Average Crossover Strategy is a quantitative trading strategy based on moving averages and the MACD indicator. The strategy utilizes crossover signals of two simple moving averages (SMAs) with different periods to determine buying and selling opportunities, while the MACD indicator is used to assist in judging the trend and momentum. When the short-term moving average crosses above the long-term moving average, a buy signal is generated; conversely, when the short-term moving average crosses below the long-term moving average, a sell signal is generated. This strategy aims to capture medium to long-term market trends while using the MACD indicator to confirm the strength and sustainability of the trend.
Strategy Principle
The core principle of the Starlight Moving Average Crossover Strategy is to use crossover signals of moving averages with different periods to identify changes in market trends. When the short-term moving average crosses above the long-term moving average from below, it indicates that a new uptrend may be forming, and the strategy generates a buy signal. Conversely, when the short-term moving average crosses below the long-term moving average from above, it indicates that a new downtrend may be forming, and the strategy generates a sell signal.
In addition to using moving average crossover signals, the strategy also incorporates the MACD indicator as an auxiliary judgment tool. The MACD consists of two lines: the MACD line and the signal line. When the MACD line crosses above the signal line from below, it indicates increasing upward momentum in the market; conversely, when the MACD line crosses below the signal line from above, it indicates increasing downward momentum in the market. The MACD indicator can be used to confirm the validity of moving average crossover signals and improve the reliability of the strategy.
Strategy Advantages
- Simplicity: The Starlight Moving Average Crossover Strategy is based on simple moving averages and the MACD indicator, making it clear, easy to understand, and implement.
- Trend following: By using moving averages with different periods, the strategy can effectively capture medium to long-term market trends, helping investors align with the primary market direction.
- Signal confirmation: Incorporating the MACD indicator as an auxiliary judgment tool can improve the reliability of moving average crossover signals and reduce false signals.
- Adaptability: The strategy can be adapted to different market environments and investor preferences by adjusting the periods of moving averages and the parameters of the MACD indicator.
Strategy Risks
- Lag: Moving averages are lagging indicators, and they react relatively slowly to market changes, which may lead to missing the best buying and selling opportunities.
- Oscillating markets: In highly volatile markets without clear trends, frequent moving average crossover signals may lead to excessive trading, increasing transaction costs and risks.
- Parameter sensitivity: The performance of the strategy largely depends on the selected periods of moving averages and the parameters of the MACD indicator. Inappropriate parameter settings may render the strategy ineffective.
Strategy Optimization Directions
- Parameter optimization: Optimize the periods of moving averages and the parameters of the MACD indicator to adapt to different market environments and asset characteristics, improving the robustness and profitability of the strategy.
- Signal filtering: Introduce other technical indicators or market sentiment indicators to filter moving average crossover signals, reducing false signals and noise interference.
- Risk management: Combine stop-loss and position sizing strategies to control the risk exposure of individual trades and prevent significant losses.
- Multi-market testing: Test the strategy on different markets and assets to assess its applicability and robustness, making necessary adjustments to the strategy.
Summary
The Starlight Moving Average Crossover Strategy is a quantitative trading strategy based on trend following and momentum confirmation. It utilizes crossover signals of moving averages with different periods and the MACD indicator to capture medium to long-term market trends. The strategy has advantages such as simplicity, trend following, signal confirmation, and adaptability. However, it also has risks such as lag, oscillating markets, and parameter sensitivity. To further enhance the performance of the strategy, optimizations and improvements can be made in aspects such as parameter optimization, signal filtering, risk management, and multi-market testing. Overall, the Starlight Moving Average Crossover Strategy provides quantitative traders with a trading framework based on classic technical indicators, but it requires adjustments and optimizations based on specific market conditions and personal preferences in practical applications. [/trans]
Source (PineScript)
/*backtest
start: 2023-05-28 00:00:00
end: 2024-06-02 00:00:00
period: 1d
basePeriod: 1h
exchanges: [{"eid":"Futures_Binance","currency":"BTC_USDT"}]
*/

//@version=5
strategy("Starlight Strategy", overlay=true)

// Define the inputs for the moving averages
shortLength = input.int(20, title="Short Moving Average Length")
longLength = input.int(50, title="Long Moving Average Length")

// Calculate the moving averages
shortMA = ta.sma(close, shortLength)
longMA = ta.sma(close, longLength)

// Calculate MACD
[macdLine, signalLine, _] = ta.macd(close, 12, 26, 9)

// Plot the moving averages
plot(shortMA, color=color.orange, title="Short Moving Average")
plot(longMA, color=color.green, title="Long Moving Average")

// Plot MACD on a separate chart
hline(0, "Zero Line", color=color.gray)
plot(macdLine, color=color.red, title="MACD Line")
plot(signalLine, color=color.purple, title="Signal Line")

// Generate buy and sell signals
buySignal = ta.crossover(shortMA, longMA)
sellSignal = ta.crossunder(shortMA, longMA)

// Plot buy and sell signals
plotshape(series=buySignal, title="Buy Signal", location=location.belowbar, color=color.green, style=shape.labelup, text="BUY")
plotshape(series=sellSignal, title="Sell Signal", location=location.abovebar, color=color.red, style=shape.labeldown, text="SELL")

// Strategy execution
if (buySignal)
    strategy.entry("Buy", strategy.long)
if (sellSignal)
    strategy.close("Buy")
Detail
https://www.fmz.com/strategy/453277
Last Modified
2024-06-03 16:45:08