
20 KiB
Name
早盘区间突破量化交易策略-Early-Morning-Range-Breakout-Quantitative-Trading-Strategy
Author
ianzeng123
Strategy Description

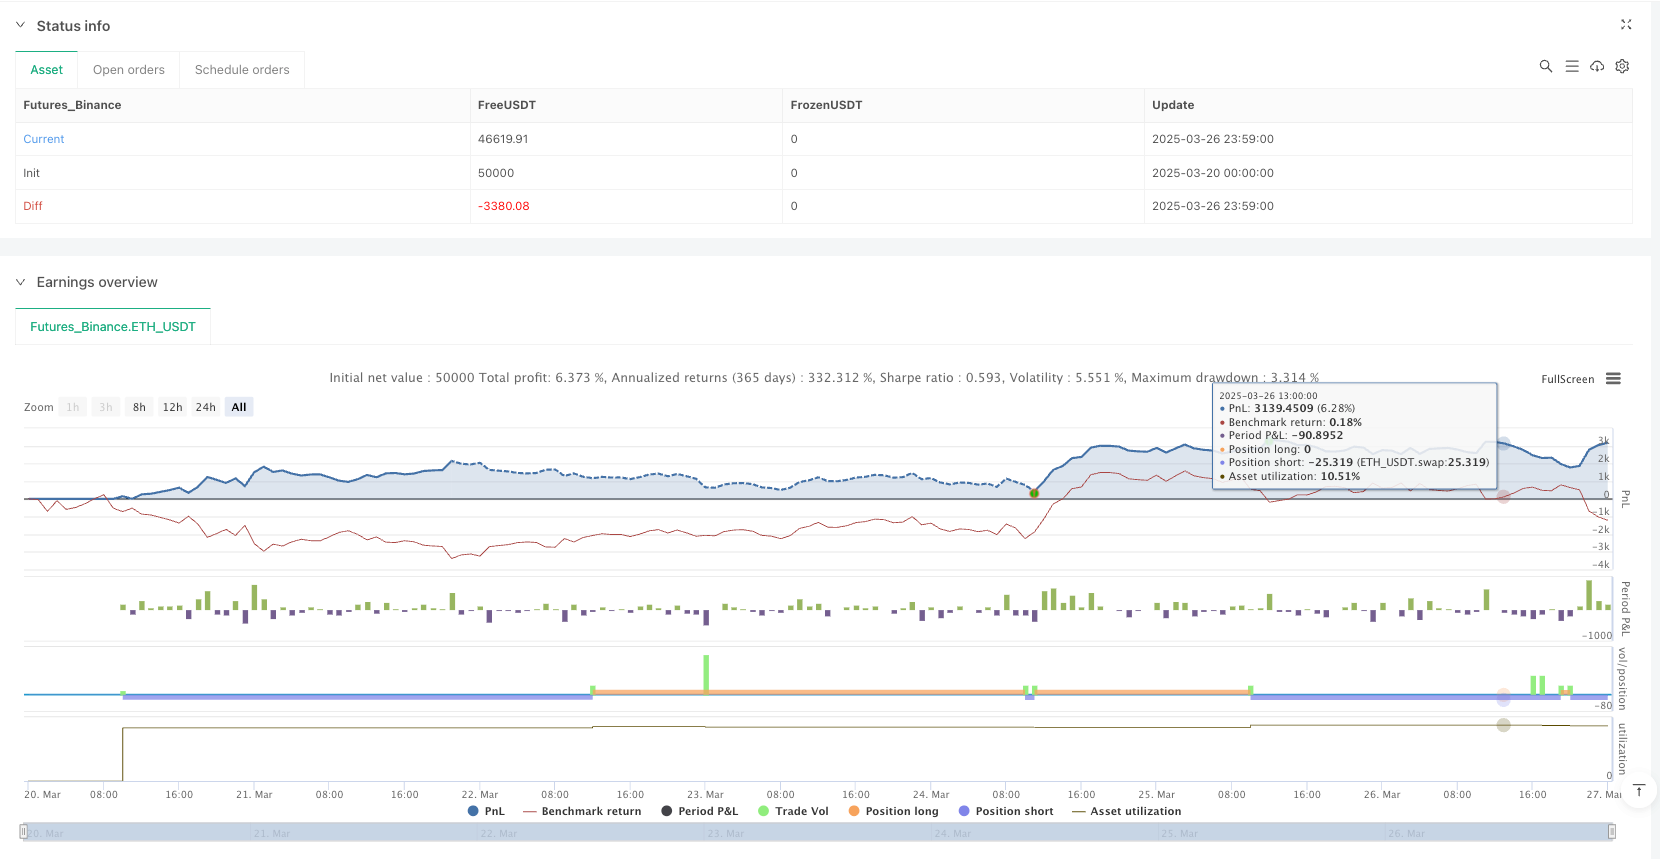
[trans]
早盘区间突破量化交易策略
概述
早盘区间突破量化交易策略是一种基于价格区间突破原理的日内交易系统。该策略核心思想是捕捉市场开盘后前五分钟(9:15-9:19)形成的价格区间,并在价格突破该区间时产生交易信号。策略设计充分利用了市场早盘时段通常会形成的短期价格波动区间,并以此作为后续价格走势的参考基准。通过在区间突破时进场,策略旨在捕捉日内可能发生的趋势性行情。
策略原理
该策略的工作原理基于以下几个关键步骤:
- 数据收集阶段:策略精确记录早盘9:15至9:19分钟的每一分钟K线高点和低点。
- 区间计算阶段:在9:20时,系统自动计算前五分钟K线形成的最高价和最低价,从而确立价格波动区间。
- 信号生成阶段:当价格向上突破区间最高点时,系统产生做多信号;当价格向下突破区间最低点时,系统产生做空信号。
- 执行交易阶段:根据生成的信号,系统自动执行相应的买入或卖出操作。
- 日终重置阶段:每个交易日结束后,系统重置所有变量,为下一个交易日做准备。
策略在技术实现上采用了精确的时间控制逻辑,确保只在特定时段内收集数据并生成交易信号。同时,通过条件判断和变量记录,策略能够准确识别价格突破行为并触发相应的交易操作。
策略优势
早盘区间突破量化交易策略具有以下显著优势:
- 明确的交易规则:策略基于清晰的价格区间突破规则,交易标准客观,决策过程不受主观因素影响。
- 捕捉短期趋势:通过识别早盘价格区间的突破,策略能够及时捕捉可能形成的日内短期趋势。
- 适应市场结构:策略特别适合具有明显开盘区间和随后趋势性发展的市场结构。
- 自动化执行:完全自动化的交易逻辑减少了人为干预,避免了情绪化交易可能带来的负面影响。
- 灵活性高:通过调整参数(如是否启用策略执行、调试模式等),可以根据不同市场环境灵活应对。
- 视觉反馈清晰:策略提供了直观的图形界面,包括区间线、交易信号标记和调试信息,便于交易者监控策略执行情况。
策略风险
尽管早盘区间突破量化交易策略具有诸多优势,但仍然存在以下潜在风险:
- 假突破风险:市场可能出现短暂突破后迅速回撤的情况,导致错误信号和不必要的交易损失。
- 区间质量风险:如果早盘形成的价格区间过窄,可能导致频繁的突破信号和过度交易。
- 数据缺失风险:策略严重依赖于前五分钟的价格数据,如果存在数据缺失,可能影响区间的准确计算。
- 市场开盘特性风险:某些市场在开盘时可能存在剧烈波动或流动性不足的情况,影响区间的代表性。
- 单一因子风险:策略仅依赖价格突破这一单一因子,缺乏其他技术指标或基本面因素的辅助判断。
针对这些风险,可以考虑以下解决方案:
- 增加确认机制,如要求突破价格需要维持一定时间或幅度才触发交易
- 设置动态区间宽度阈值,避免在过窄区间产生交易信号
- 加入数据验证机制,确保区间计算使用的数据完整可靠
- 引入其他技术指标作为辅助过滤条件,提高信号质量
策略优化方向
基于对策略代码的分析,可以从以下几个方向对策略进行优化:
- 增加动态止损机制:目前策略缺乏明确的止损设置,可以增加基于区间宽度或ATR的动态止损,以控制单笔交易风险。
- 引入趋势过滤器:结合移动平均线或其他趋势指标,在大趋势方向上进行交易,避免在震荡市场中频繁交易。
- 优化区间计算逻辑:考虑使用VWAP或其他成交量加权方法确定更具代表性的价格区间,而不仅仅是简单的最高价和最低价。
- 增加时间过滤:设置交易窗口,避免在市场波动性较低或不确定性较高的时段进行交易。
- 加入波动率调整:根据市场波动率动态调整区间突破的触发阈值,在高波动环境下要求更大的突破幅度。
- 增强回测功能:增加更详细的性能统计和风险评估指标,以便更全面地评估策略表现。
- 优化代码结构:当前代码中存在重复逻辑和冗长的条件判断,可以通过使用数组和循环结构简化代码,提高代码可读性和维护性。
这些优化方向之所以重要,是因为它们能够显著提高策略的稳健性和适应性。例如,动态止损和趋势过滤能够降低假突破风险和改善风险收益比;区间计算优化则能够提高区间代表性,减少无效交易;时间过滤和波动率调整则有助于策略适应不同的市场环境。
总结
早盘区间突破量化交易策略是一种简洁而有效的日内交易系统,专注于捕捉市场开盘后形成的价格区间突破。策略通过精确记录早盘前五分钟的价格波动,建立参考区间,并在价格突破该区间时产生交易信号。其核心优势在于明确的交易规则、客观的决策过程以及自动化的执行机制。
然而,策略也面临假突破、区间质量不佳和单一因子依赖等潜在风险。通过增加止损机制、引入趋势过滤、优化区间计算逻辑和加入动态参数调整等优化手段,可以显著提升策略的稳健性和适应性。
对于有意使用该策略的交易者而言,建议首先在不同市场环境下进行充分的回测,了解策略在各种情况下的表现特性,并据此调整参数设置和风险控制机制。同时,将该策略作为更全面交易系统的一部分,结合其他技术分析工具和风险管理原则,才能充分发挥其效用。 ||
Early Morning Range Breakout Quantitative Trading Strategy
Overview
The Early Morning Range Breakout Quantitative Trading Strategy is an intraday trading system based on price range breakout principles. The core concept of this strategy is to capture the price range formed during the first five minutes after market opening (9:15-9:19) and generate trading signals when the price breaks through this range. The strategy design takes full advantage of the short-term price fluctuation range that typically forms during the early market session and uses it as a reference benchmark for subsequent price movements. By entering positions at range breakouts, the strategy aims to capture potential intraday trend movements.
Strategy Principle
The working principle of this strategy is based on the following key steps:
- Data Collection Phase: The strategy precisely records the high and low points of each one-minute candle from 9:15 to 9:19.
- Range Calculation Phase: At 9:20, the system automatically calculates the highest high and lowest low formed by the previous five-minute candles, thus establishing the price fluctuation range.
- Signal Generation Phase: When the price breaks above the highest point of the range, the system generates a long signal; when the price breaks below the lowest point, the system generates a short signal.
- Trade Execution Phase: Based on the generated signals, the system automatically executes the corresponding buy or sell operations.
- End-of-Day Reset Phase: At the end of each trading day, the system resets all variables to prepare for the next trading day.
In terms of technical implementation, the strategy employs precise time control logic to ensure data is collected and trading signals are generated only within specific time periods. Through conditional judgments and variable recording, the strategy can accurately identify price breakout behaviors and trigger corresponding trading operations.
Strategy Advantages
The Early Morning Range Breakout Quantitative Trading Strategy has the following significant advantages:
- Clear Trading Rules: The strategy is based on objective price range breakout rules, making trading standards objective and the decision-making process free from subjective influence.
- Capturing Short-term Trends: By identifying breakouts of the early morning price range, the strategy can promptly capture potential intraday short-term trends.
- Adaptation to Market Structure: The strategy is particularly suitable for markets with distinct opening ranges followed by trending developments.
- Automated Execution: Fully automated trading logic reduces human intervention, avoiding the negative impacts of emotional trading.
- High Flexibility: Through parameter adjustments (such as enabling/disabling strategy execution, debug mode, etc.), the strategy can flexibly respond to different market environments.
- Clear Visual Feedback: The strategy provides an intuitive graphical interface, including range lines, trade signal markers, and debug information, facilitating strategy execution monitoring.
Strategy Risks
Despite its many advantages, the Early Morning Range Breakout Quantitative Trading Strategy still has the following potential risks:
- False Breakout Risk: The market may exhibit brief breakouts followed by quick retracements, leading to incorrect signals and unnecessary trading losses.
- Range Quality Risk: If the early morning price range is too narrow, it may lead to frequent breakout signals and excessive trading.
- Data Missing Risk: The strategy heavily relies on price data from the first five minutes; missing data may affect the accurate calculation of the range.
- Market Opening Characteristics Risk: Some markets may experience violent fluctuations or insufficient liquidity during opening, affecting the representativeness of the range.
- Single Factor Risk: The strategy relies solely on price breakouts as a single factor, lacking auxiliary judgment from other technical indicators or fundamental factors.
To address these risks, consider the following solutions:
- Add confirmation mechanisms, such as requiring breakout prices to maintain for a certain time or magnitude before triggering trades
- Set dynamic range width thresholds to avoid generating trading signals in overly narrow ranges
- Incorporate data validation mechanisms to ensure complete and reliable data for range calculations
- Introduce other technical indicators as auxiliary filtering conditions to improve signal quality
Strategy Optimization Directions
Based on the analysis of the strategy code, optimization can be pursued in the following directions:
- Add Dynamic Stop-Loss Mechanism: The current strategy lacks explicit stop-loss settings. Adding dynamic stop-loss based on range width or ATR can control single trade risk.
- Introduce Trend Filters: Combine moving averages or other trend indicators to trade in the direction of the major trend, avoiding frequent trading in oscillating markets.
- Optimize Range Calculation Logic: Consider using VWAP or other volume-weighted methods to determine more representative price ranges, rather than simply using the highest and lowest prices.
- Add Time Filtering: Set trading windows to avoid trading during periods of low market volatility or high uncertainty.
- Incorporate Volatility Adjustment: Dynamically adjust the range breakout trigger thresholds based on market volatility, requiring larger breakout magnitudes in high-volatility environments.
- Enhance Backtesting Capabilities: Add more detailed performance statistics and risk assessment metrics for more comprehensive strategy performance evaluation.
- Optimize Code Structure: The current code contains repetitive logic and lengthy conditional judgments. Using arrays and loop structures can simplify the code and improve readability and maintainability.
These optimization directions are important because they can significantly improve the strategy's robustness and adaptability. For example, dynamic stop-loss and trend filtering can reduce false breakout risk and improve risk-reward ratios; range calculation optimization can increase range representativeness and reduce ineffective trades; time filtering and volatility adjustment help the strategy adapt to different market environments.
Summary
The Early Morning Range Breakout Quantitative Trading Strategy is a concise and effective intraday trading system focused on capturing price range breakouts formed after market opening. The strategy precisely records price fluctuations during the first five minutes of the early market session, establishes a reference range, and generates trading signals when prices break through this range. Its core advantages lie in clear trading rules, objective decision-making processes, and automated execution mechanisms.
However, the strategy also faces potential risks such as false breakouts, poor range quality, and dependency on a single factor. By adding stop-loss mechanisms, introducing trend filters, optimizing range calculation logic, and incorporating dynamic parameter adjustments, the robustness and adaptability of the strategy can be significantly enhanced.
For traders interested in using this strategy, it is recommended to first conduct thorough backtesting in different market environments to understand the strategy's performance characteristics in various situations and adjust parameter settings and risk control mechanisms accordingly. Additionally, using this strategy as part of a more comprehensive trading system, combined with other technical analysis tools and risk management principles, will help maximize its effectiveness.[/trans]
Source (PineScript)
/*backtest
start: 2025-03-20 00:00:00
end: 2025-03-27 00:00:00
period: 1m
basePeriod: 1m
exchanges: [{"eid":"Futures_Binance","currency":"ETH_USDT"}]
*/

//@version=5
strategy("Morning Range Breakout Strategy", overlay=true, default_qty_type=strategy.percent_of_equity, default_qty_value=100)

// Input parameters
var useStrategy = input.bool(true, title="Enable Strategy Execution")
var debugMode = input.bool(true, title="Debug Mode")

// Variables to store specific candle data
var float high915 = na
var float low915 = na
var float high916 = na
var float low916 = na
var float high917 = na
var float low917 = na
var float high918 = na
var float low918 = na
var float high919 = na
var float low919 = na

// Final range variables
var float highestHigh = na
var float lowestLow = na
var bool rangeEstablished = false

// Get current bar time components
t = time("1", "0930-1600:1234567")
timeHour = hour(t)
timeMinute = minute(t)

// Debug variables
var string timeString = na
var int barNum = 0
barNum := barNum + 1

// Record exact timestamp for debugging
timeString := str.tostring(timeHour) + ":" + str.tostring(timeMinute)

// Capture each specific minute's high and low
if timeHour == 9 and timeMinute == 15
    high915 := high
    low915 := low
    if debugMode
        label.new(bar_index, high, "9:15 H:" + str.tostring(high, "#.##") + " L:" + str.tostring(low, "#.##"),
                 color=color.new(color.blue, 50), style=label.style_label_down, textcolor=color.white)

if timeHour == 9 and timeMinute == 16
    high916 := high
    low916 := low

if timeHour == 9 and timeMinute == 17
    high917 := high
    low917 := low

if timeHour == 9 and timeMinute == 18
    high918 := high
    low918 := low

if timeHour == 9 and timeMinute == 19
    high919 := high
    low919 := low

// At 9:20, calculate the highest high and lowest low from all values
if timeHour == 9 and timeMinute == 20 and not rangeEstablished
    // Initialize with first non-NA value
    if not na(high915)
        highestHigh := high915
    else if not na(high916)
        highestHigh := high916
    else if not na(high917)
        highestHigh := high917
    else if not na(high918)
        highestHigh := high918
    else if not na(high919)
        highestHigh := high919

    if not na(low915)
        lowestLow := low915
    else if not na(low916)
        lowestLow := low916
    else if not na(low917)
        lowestLow := low917
    else if not na(low918)
        lowestLow := low918
    else if not na(low919)
        lowestLow := low919

    // Now find the highest high and lowest low across all minutes
    if not na(high915) and high915 > highestHigh
        highestHigh := high915
    if not na(high916) and high916 > highestHigh
        highestHigh := high916
    if not na(high917) and high917 > highestHigh
        highestHigh := high917
    if not na(high918) and high918 > highestHigh
        highestHigh := high918
    if not na(high919) and high919 > highestHigh
        highestHigh := high919

    if not na(low915) and low915 < lowestLow
        lowestLow := low915
    if not na(low916) and low916 < lowestLow
        lowestLow := low916
    if not na(low917) and low917 < lowestLow
        lowestLow := low917
    if not na(low918) and low918 < lowestLow
        lowestLow := low918
    if not na(low919) and low919 < lowestLow
        lowestLow := low919

    rangeEstablished := true

    if debugMode
        label.new(bar_index, high, "Range Set\nHigh:" + str.tostring(highestHigh, "#.##") +
                 "\nLow:" + str.tostring(lowestLow, "#.##") +
                 "\n9:15 values included: " + str.tostring(not na(high915)),
                 color=color.new(color.purple, 0), style=label.style_label_down, textcolor=color.white)

// Reset values for the next day
if dayofweek != dayofweek[1]
    high915 := na
    low915 := na
    high916 := na
    low916 := na
    high917 := na
    low917 := na
    high918 := na
    low918 := na
    high919 := na
    low919 := na
    highestHigh := na
    lowestLow := na
    rangeEstablished := false

// Generate buy/sell signals
longCondition = rangeEstablished and ta.crossover(close, highestHigh)
shortCondition = rangeEstablished and ta.crossunder(close, lowestLow)

// Execute strategy if enabled
if useStrategy and rangeEstablished
    if longCondition
        strategy.entry("Long", strategy.long)
    if shortCondition
        strategy.entry("Short", strategy.short)

// Plotting
plot(rangeEstablished ? highestHigh : na, color=color.green, linewidth=2, title="Highest High")
plot(rangeEstablished ? lowestLow : na, color=color.red, linewidth=2, title="Lowest Low")

// Plot buy/sell signals
plotshape(longCondition, title="Buy Signal", location=location.belowbar, color=color.green, style=shape.triangleup, size=size.small)
plotshape(shortCondition, title="Sell Signal", location=location.abovebar, color=color.red, style=shape.triangledown, size=size.small)

// Display range information
if barstate.islast and rangeEstablished
    label.new(bar_index, highestHigh, text="High: " + str.tostring(highestHigh, "#.##") + " (9:15-9:19)", color=color.green, textcolor=color.white, style=label.style_label_down)
    label.new(bar_index, lowestLow, text="Low: " + str.tostring(lowestLow, "#.##") + " (9:15-9:19)", color=color.red, textcolor=color.white, style=label.style_label_up)

// Debug information
if debugMode and barstate.islast
    label.new(bar_index, high + (high * 0.05),
              "9:15 recorded: " + str.tostring(not na(high915)) +
              "\n9:15 High: " + str.tostring(high915, "#.##") +
              "\n9:15 Low: " + str.tostring(low915, "#.##") +
              "\nTime seen: " + timeString,
              color=color.blue, textcolor=color.white, style=label.style_label_down)
Detail
https://www.fmz.com/strategy/488513
Last Modified
2025-03-28 14:55:19