
8.6 KiB
Name
日内交易关键点策略Intraday-Pivot-Points-Trading-Strategy
Author
ChaoZhang
Strategy Description
 [trans]
概述
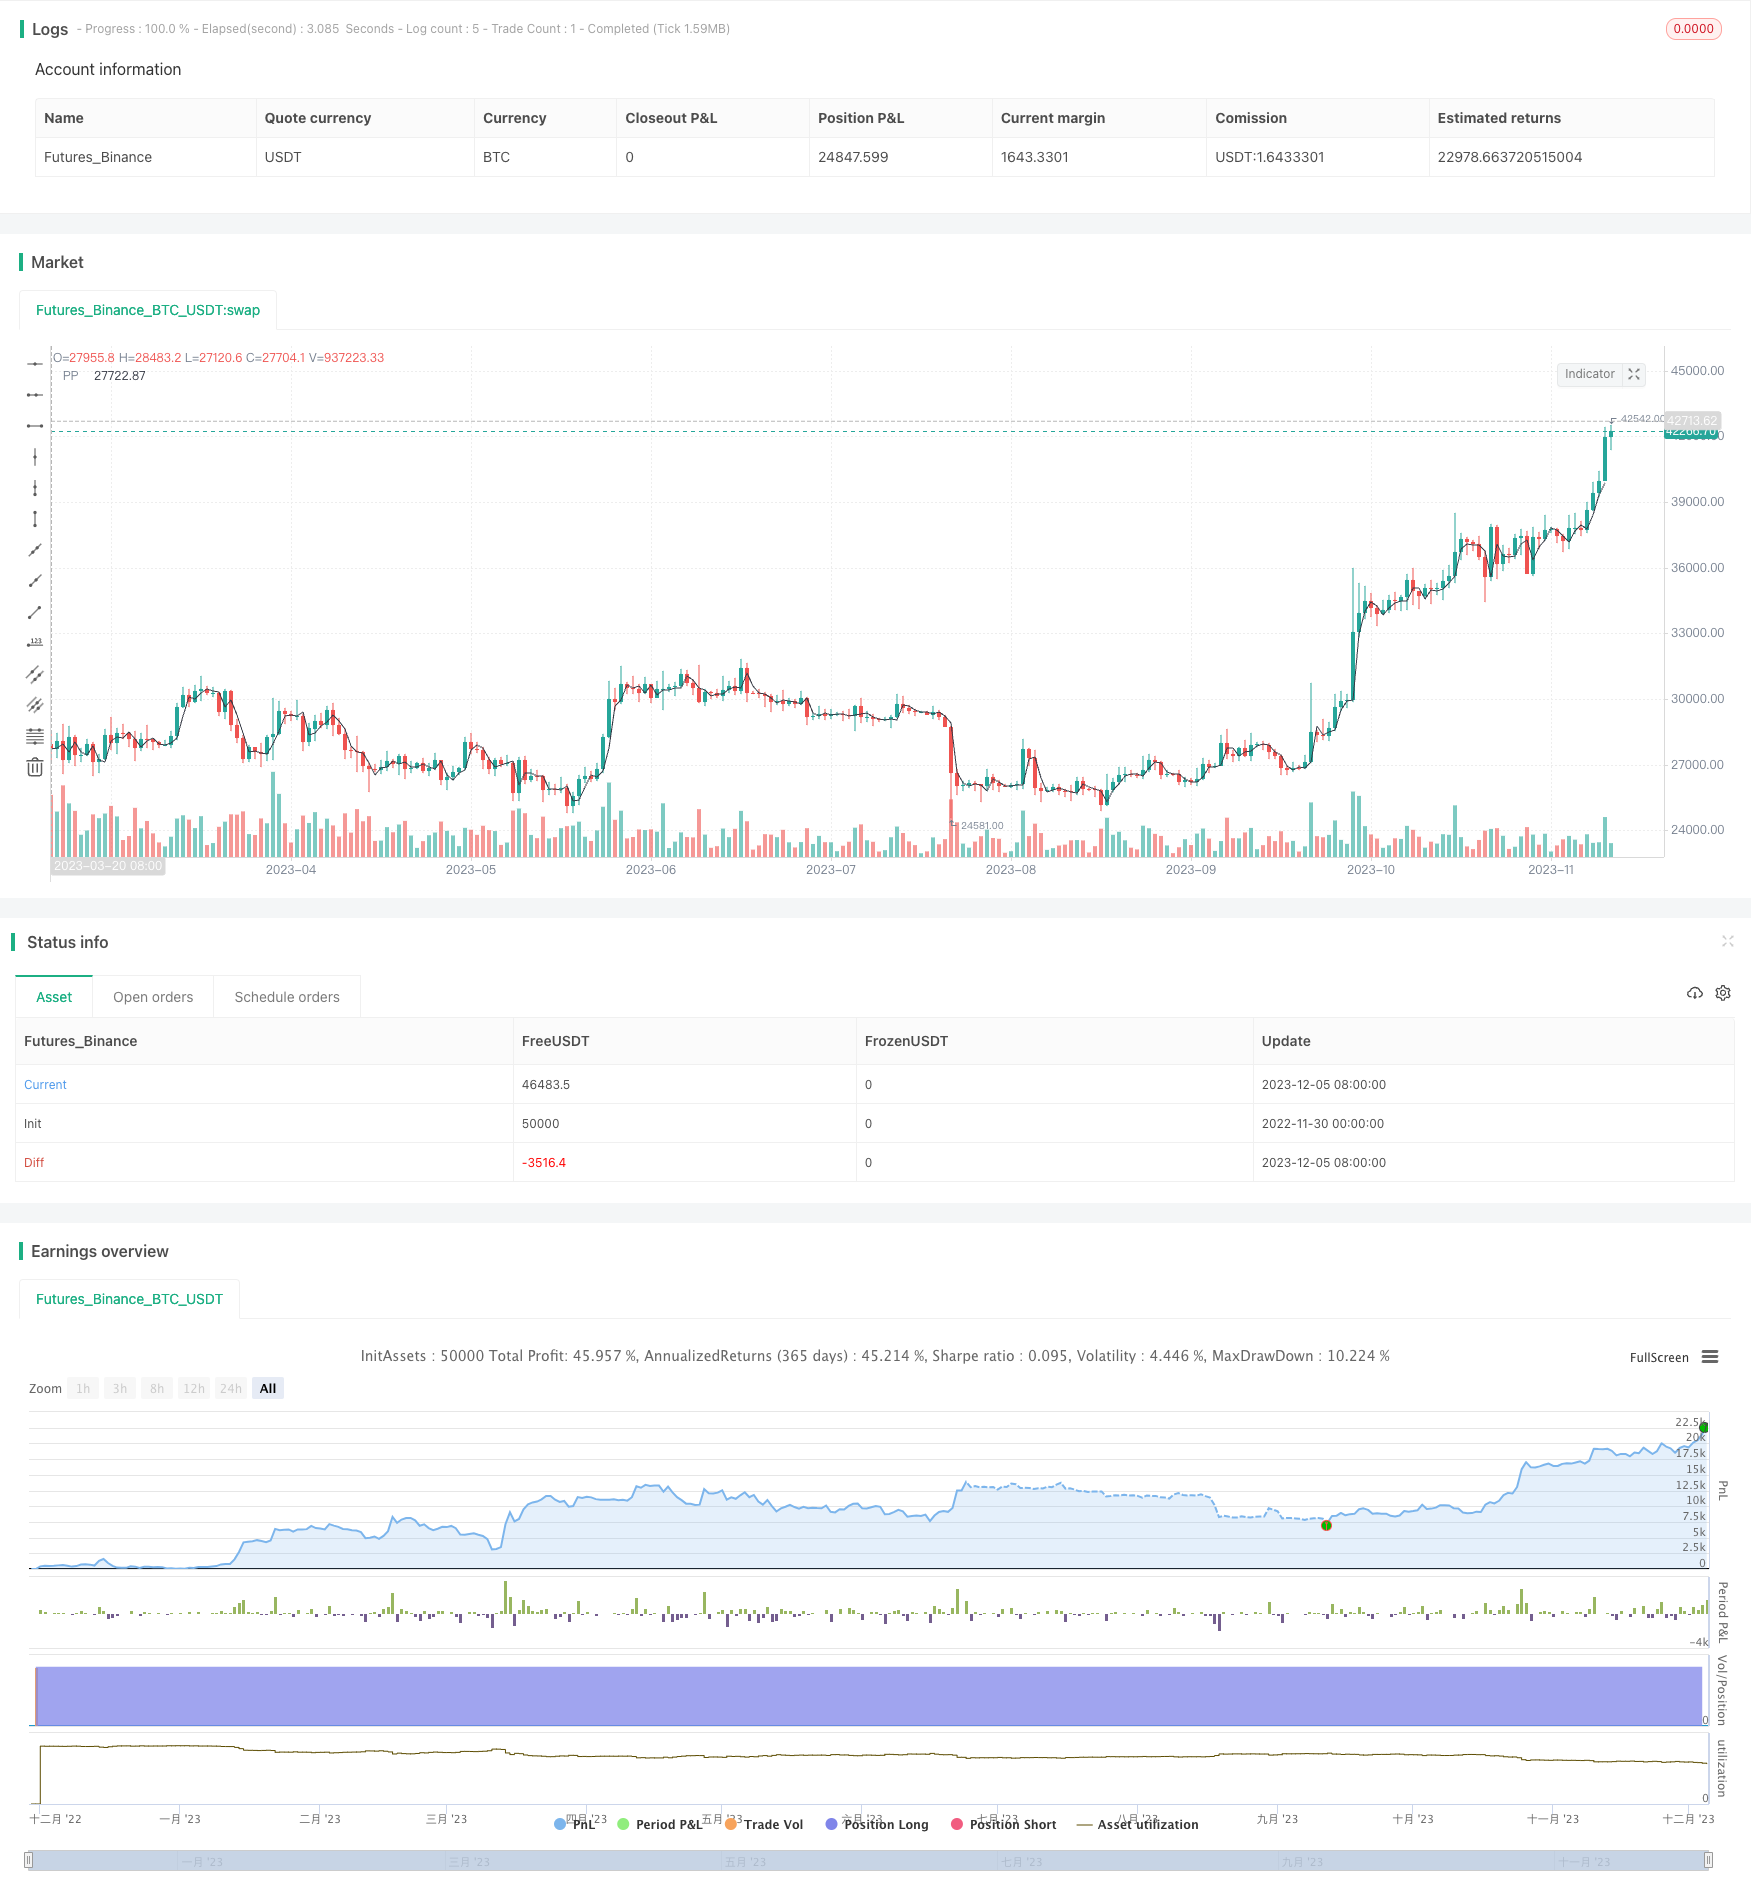
这是一个印度日内交易的关键点策略,主要利用开盘价、最高价、最低价和收盘价计算出关键的支撑和阻力点,在这些点发生价格突破时进行交易。
策略原理
- 计算前一交易日的最高价、最低价和收盘价
- 根据公式计算出主要的支撑点S1、阻力点R1和关键点PP
- 当价格突破这些关键点时进入做多或做空头寸
- 设置止损退出机制
主要关键点计算公式如下:
PP = (最高价+最低价+收盘价)/3
R1 = 2*PP - 最低价
S1 = 2*PP - 最高价
优势分析
- 利用关键点提供高概率的突破口,增大盈利机会
- 关键点易于确定,交易规则清晰
- 停损点容易设定,有效控制风险
风险分析
- 关键点可能出现假突破,造成亏损
- 关键点的有效性需要验证,不一定每次都有效
- 停损点设置不当可能扩大损失
风险解决方法:
- combining with other indicators to filter false breakouts
- backtesting to validate strategy over long timeframes
- optimize stop loss placement
优化方向
- 结合其他技术指标过滤假突破信号
- 针对不同品种参数优化
- 动态调整止损点
总结
该策略整体较为简单直接,通过历史数据容易验证有效性。作为日内交易策略,它利用关键点提供高概率突破口,可以获得不错的效果。但由于依赖关键点,也存在一定的假突破风险,这需要进一步优化来减少。总的来说,这是一个易于实现、风险可控的日内交易策略。
||
Overview
This is an intraday trading strategy for Indian market focusing on key support and resistance levels calculated from open, high, low and close prices of the previous trading day. Trades are taken when price breaks through these key levels.
Strategy Logic
- Calculate previous day's high, low and close prices
- Calculate key support level S1, resistance level R1 and pivot point PP using formulas
- Take long or short trades when price breaks through these levels
- Use stop loss exits
Key point formulas:
PP = (High + Low + Close) /3
R1 = 2*PP - Low
S1 = 2*PP - High
Advantage Analysis
- Key points provide high probability breakout opportunities resulting in greater profit potential
- Easy to identify key points, clear trading rules
- Easy to set stop loss, effectively control risks
Risk Analysis
- Possible false breakouts at key points causing losses
- Validity of key points needs verification, may not always work
- Improper stop loss can increase losses
Risk Mitigations:
- Combine with other indicators to filter false breakouts
- Backtest over long timeframes to validate strategy
- Optimize stop loss placement
Improvement Opportunities
- Combine other technical indicators to filter false signals
- Parameter tuning for different products
- Dynamic stop loss adjustment
Conclusion
Overall this is a simple and straightforward strategy which can be easily validated with historical data. As an intraday strategy, it provides high probability breakout opportunities at key levels resulting in good performance. But there are some false breakout risks relying on pivot points that need further optimization. In summary, this is an easy to implement, controllable risk intraday trading strategy.
[/trans]
Strategy Arguments
| Argument | Default | Description |
|---|---|---|
| v_input_1 | false | Show previous day's High & Low(PDH/PDL) |
| v_input_2 | true | Show Pivot Point(PP) |
| v_input_3 | false | Show Pivot Point Resistance (R1) |
| v_input_4 | false | Show Pivot Point Support (S1) |
| v_input_5 | true | Trade on Long Entry |
| v_input_6 | false | Trade on Short Entry |
| v_input_7 | 0.5 | Max Loss on one Trade |
| v_input_8 | 0 | Trade base Level: PP |
| v_input_9 | 0915-1530 | Session time |
Source (PineScript)
/*backtest
start: 2022-11-30 00:00:00
end: 2023-12-06 00:00:00
period: 1d
basePeriod: 1h
exchanges: [{"eid":"Futures_Binance","currency":"BTC_USDT"}]
*/

// This source code is subject to the terms of the Mozilla Public License 2.0 at https://mozilla.org/MPL/2.0/
// © arameshraju
//Reference credit goes to All


//@version=4
strategy("ARR-Pivote-India-Stategy",shorttitle="ARR-PP-Ind", overlay=true)

// This source code is subject to the terms of the Mozilla Public License 2.0 at https://mozilla.org/MPL/2.0/
// © arameshraju
//User Input
showPrevDayHighLow = input(false, title="Show previous day's High & Low(PDH/PDL)", type=input.bool)
showPivoteLine = input(true, title="Show Pivot Point(PP)", type=input.bool)
showPivoteR1Line = input(false, title="Show Pivot Point Resistance (R1)", type=input.bool)
showPivoteS1Line = input(false, title="Show Pivot Point Support (S1)", type=input.bool)
tradeLong = input(true, title="Trade on Long Entry", type=input.bool)
tradeShort = input(false, title="Trade on Short Entry", type=input.bool)
maxLoss = input(0.5, title="Max Loss on one Trade", type=input.float)
tradeOn=input(title="Trade base Level", type=input.string,
     options=["PP", "PDH", "PDL","R1","S1"], defval="PP")

sessSpec = input("0915-1530", title="Session time", type=input.session)

// Defaults
// Colors
cColor = color.black
rColor = color.red
sColor = color.green

// Line style & Transparency
lStyle = plot.style_line
lTransp = 35

// Get High & Low
getSeries(_e, _timeFrame) => security(syminfo.tickerid, _timeFrame, _e, lookahead=barmerge.lookahead_on)

is_newbar(res, sess) =>
    t = time(res, sess)
    na(t[1]) and not na(t) or t[1] < t

newbar = is_newbar("375", sessSpec)
// Today's Session Start timestamp
y = year(timenow)
m = month(timenow)
d = dayofmonth(timenow)

// Start & End time for Today
start = timestamp(y, m, d, 09, 15)
end = start + 86400000


PrevDayHigh = getSeries(high[1], 'D')
PrevDayLow = getSeries(low[1], 'D')
PrevDayClose = getSeries(close[1], 'D')

PivoteLine=(PrevDayHigh+PrevDayLow+PrevDayClose) /3
PivoteR1=(PivoteLine*2) -PrevDayLow

PivoteS1=(PivoteLine*2) -PrevDayHigh

orbPrevDayOpen = getSeries(open[1], 'D')
orbPrevDayClose = getSeries(close[1], 'D')

// //Preview Day High line
// _pdh = line.new(start, PrevDayHigh, end, PrevDayHigh, xloc.bar_time, color=color.red, style=line.style_solid, width=2)
// line.delete(_pdh[1])
// _pdl = line.new(start, PrevDayLow, end, PrevDayLow, xloc.bar_time, color=color.green, style=line.style_solid, width=2)
// line.delete(_pdl[1])
// _Pp = line.new(start, PrevDayLow, end, PrevDayLow, xloc.bar_time, color=color.green, style=line.style_dashed, width=2)
// line.delete(_Pp[1])


// //Previous Day Low Line
// l_pdh = label.new(start, PrevDayHigh, text="PD", xloc=xloc.bar_time, textcolor=rColor, style=label.style_none)
// label.delete(l_pdh[1])
// l_pdl = label.new(start, PrevDayLow, text="PD", xloc=xloc.bar_time, textcolor=sColor, style=label.style_none)
// label.delete(l_pdl[1])

// //Pivote Line

// l_pp = label.new(start, PivoteLine, text="PP", xloc=xloc.bar_time, textcolor=color.black, style=label.style_none)
// label.delete(l_pp[1])
// l_R1 = label.new(start, PivoteR1, text="R1", xloc=xloc.bar_time, textcolor=color.fuchsia, style=label.style_none)
// label.delete(l_pp[1])
// l_SR = label.new(start, PivoteS1, text="S2", xloc=xloc.bar_time, textcolor=color.navy, style=label.style_none)
// label.delete(l_pp[1])


plot(showPrevDayHighLow?PrevDayHigh:na , title=' PDH', color=rColor)
plot(showPrevDayHighLow?PrevDayLow:na, title=' PDL', color=sColor)
plot(showPivoteLine?PivoteLine:na, title=' PP', color=color.black)
plot(showPivoteR1Line?PivoteR1:na, title=' R1', color=color.fuchsia)
plot(showPivoteS1Line?PivoteS1:na, title=' S1', color=color.navy)

// Today's Session Start timestamp
// Start & End time for Today
//endTime = timestamp(t, m, d, 15, 00)

tradeEventPrice= if string("PDH")==tradeOn
    PrevDayHigh
else if string("PDL")==tradeOn
    PrevDayLow
else if string("R1")==tradeOn
    PivoteR1
else if string("S1")==tradeOn
    PivoteS1
else
    PivoteLine


//tradeEventPrice=PrevDayHigh

if (open < tradeEventPrice) and ( close >tradeEventPrice ) and ( hour < 13 ) and tradeLong
	strategy.entry("buy", strategy.long, 1, when=strategy.position_size <= 0)

if (open > tradeEventPrice) and ( close <tradeEventPrice ) and ( hour < 13 ) and  tradeShort
	strategy.entry("Sell", strategy.short, 1, when=strategy.position_size <= 0)

mxloss=orbPrevDayClose*maxLoss

strategy.exit("exit", "buy",  loss = mxloss)
strategy.exit("exit", "Sell",  loss = mxloss)


strategy.close_all(when =   hour == 15   , comment = "close all entries")
Detail
https://www.fmz.com/strategy/434581
Last Modified
2023-12-07 16:43:17