
13 KiB
Name
斐波那契黄金和谐突破策略-Fibonacci-Golden-Harmony-Breakout-Strategy
Author
ChaoZhang
Strategy Description
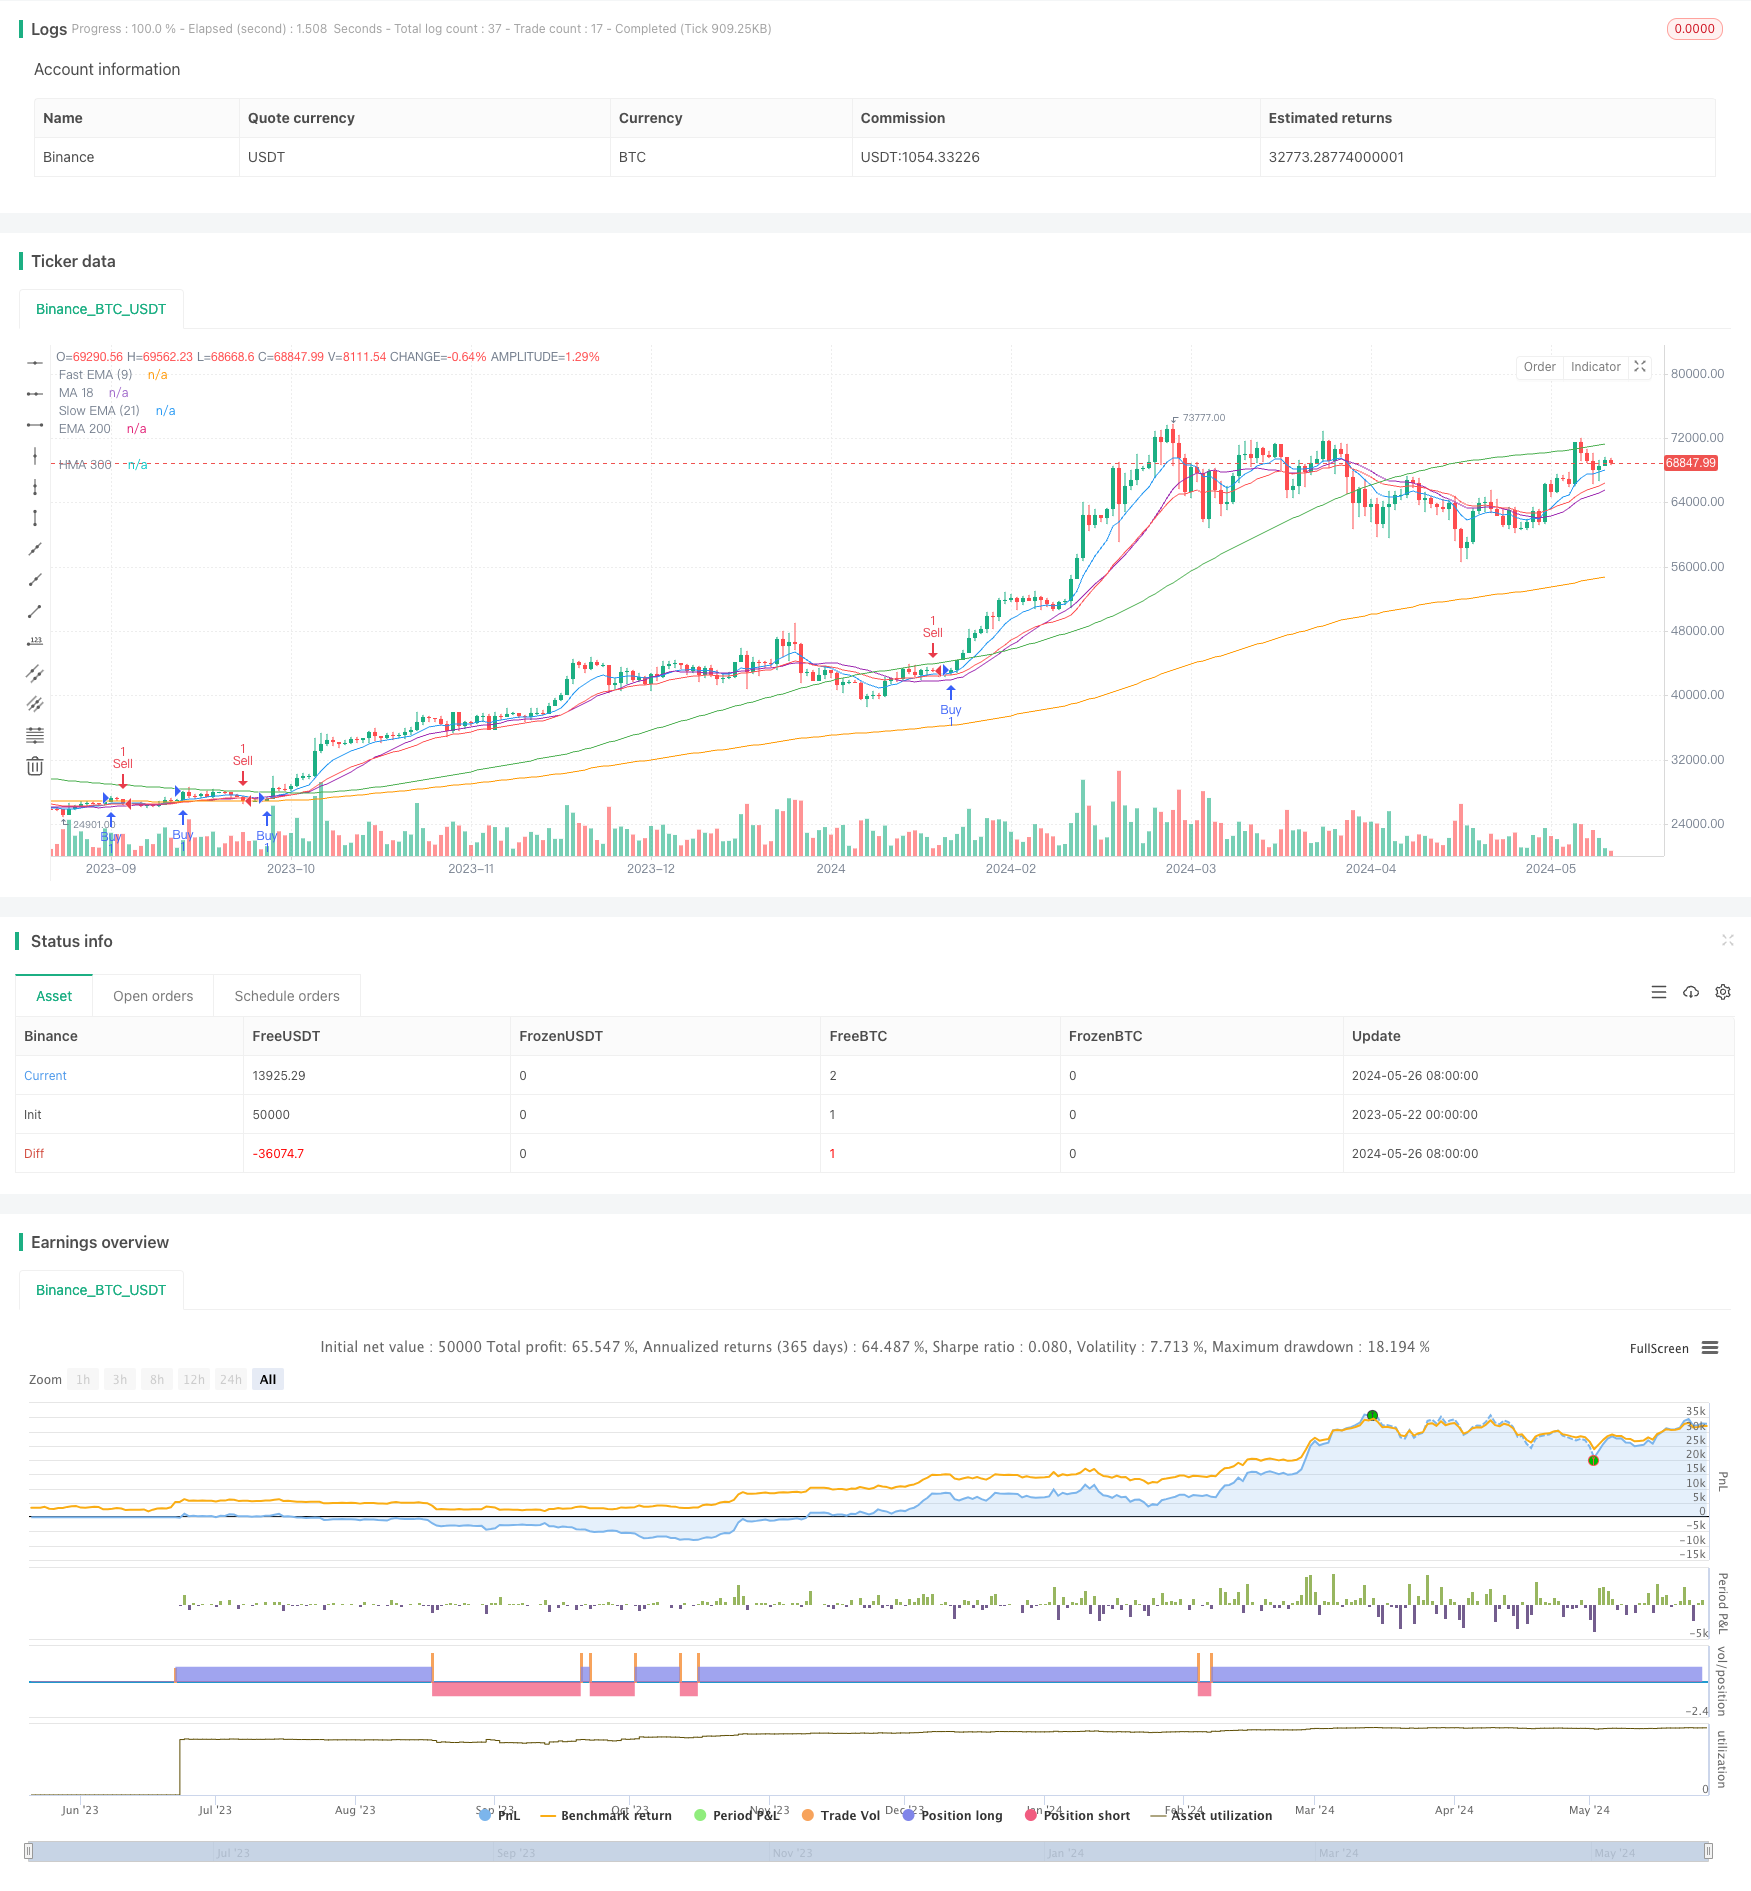 [trans]
概述
该策略通过结合趋势线、斐波那契回撤水平和移动平均线,旨在捕捉突破交易机会。策略首先识别快速和慢速EMA之间的交叉,表明潜在的趋势线突破。然后,使用斐波那契黄金口袋(61.8%和65%回撤水平)进行确认。最后,200日EMA和300日HMA提供了进一步的趋势方向确认。当价格突破黄金口袋水平并被移动平均线交叉确认时,策略执行买入或卖出操作。
策略原理
- 识别趋势线突破:观察快速(9周期)和慢速(21周期)EMA之间的交叉和交叉下穿,这表明潜在的趋势线突破,预示着市场情绪的转变。
- 用斐波那契水平确认:一旦确定了突破,就寻找黄金口袋的出现,即61.8%和65%的斐波那契回撤水平。这些水平通常充当重要的支撑或阻力区域,为突破提供额外的确认。
- 使用移动平均线进行确认:200日EMA和300日HMA提供了进一步的趋势方向确认。价格在这些移动平均线之上出现看涨交叉可以强化买入信号,而看跌交叉则可以强化卖出信号。
- 执行交易:当价格突破黄金口袋水平并被移动平均线交叉确认时,考虑进行多头或空头交易。
- 管理风险:设置止损单来限制潜在损失,设置获利单来锁定利润。考虑使用追踪止损来锁定趋势发展过程中的收益。
- 监控交易:随着交易的进行,密切关注交易。根据市场状况和价格走势调整止损和获利水平。
策略优势
- 多重确认:该策略结合了趋势线分析、斐波那契水平和移动平均线,提供了可靠的突破交易信号。这种多重确认方法有助于过滤假突破信号,提高交易成功率。
- 趋势跟踪:通过使用移动平均线确认趋势方向,该策略能够顺应主要趋势交易。这有助于交易者在强劲的趋势中留在市场,最大限度地提高利润潜力。
- 风险管理:该策略纳入了止损单和获利单,以管理风险和保护利润。这有助于将潜在损失降至最低,同时让利润奔跑。使用追踪止损进一步优化了风险回报比。
策略风险
- 假突破:尽管该策略采用了多重确认方法,但仍有可能出现假突破信号。这可能导致亏损交易和资本损失。为了减轻这种风险,交易者可以考虑增加确认因素或调整参数以提高信号质量。
- 滞后信号:由于该策略依赖于移动平均线和斐波那契水平等滞后指标,因此在快速变化的市场条件下,信号可能会滞后。这可能导致进场延迟或错过有利可图的交易机会。为了解决这个问题,交易者可以结合其他领先指标或价格行为模式。
- 突发事件:意外的市场事件或消息可能导致价格突然波动,引发止损单被触发或导致重大损失。为了降低这种风险,交易者可以使用更宽松的止损位置,或者在重大事件前暂时退出市场。
策略优化方向
- 参数优化:该策略的关键参数,如EMA周期、斐波那契水平和止损位置,都可以通过回溯测试和优化来改进。通过系统地测试不同的参数组合,交易者可以确定最适合他们市场和交易风格的设置。
- 结合其他指标:为了提高信号质量和确认,可以将其他技术指标纳入该策略,如相对强弱指数(RSI)、平均真实范围(ATR)或波动率指标。这些额外的过滤器可以帮助区分高概率设置和假突破。
- 动态止损:使用动态或自适应止损方法,如基于ATR或价格行为的止损,可以更好地应对不同的市场状况。这可以通过在趋势发展时提供更多的回撤空间,同时在区间市场中收紧风险来改善风险调整后的回报。
- 多时间框架分析:通过跨多个时间框架分析突破信号,可以获得更全面的市场视角。交易者可以寻找更高时间框架的确认,如日线图上的突破,然后在较低时间框架上进行交易执行,如4小时图。这有助于将短期噪音与长期趋势分开。
总结
黄金和谐突破策略提供了一种系统的方法来捕捉趋势线突破交易机会。通过结合多个技术指标,如EMA、斐波那契水平和移动平均线,该策略旨在产生高概率的交易信号。尽管该策略具有多重确认和趋势跟踪的优势,但交易者仍必须警惕假突破、滞后信号和意外事件的风险。通过优化关键参数、纳入其他指标、采用动态止损和利用多时间框架分析,可以进一步提高该策略的性能。总的来说,黄金和谐突破策略为希望利用突破交易机会的交易者提供了一个强大的框架。
||
Overview
The Golden Harmony Breakout strategy aims to capture breakout trading opportunities by combining trendline analysis, Fibonacci retracement levels, and moving averages. The strategy first identifies crossovers and crossunders between the fast (9-period) and slow (21-period) EMAs, indicating potential trendline breakouts. Confirmation is then sought using the Fibonacci Golden Pocket, defined by the 61.8% and 65% retracement levels. Finally, the 200-day EMA and 300-day HMA provide further confirmation of the trend direction. When the price breaks through the Golden Pocket level and is confirmed by moving average crossovers, the strategy executes buy or sell trades.
Strategy Principles
- Identify Trendline Breakouts: Watch for crossovers and crossunders between the fast (9-period) and slow (21-period) EMAs, indicating potential trendline breakouts and shifts in market sentiment.
- Confirm with Fibonacci Levels: Once a breakout is identified, look for the appearance of the Golden Pocket, defined by the 61.8% and 65% Fibonacci retracement levels. These levels often act as significant support or resistance areas, providing additional confirmation of the breakout.
- Use Moving Averages for Confirmation: The 200-day EMA and 300-day HMA provide further confirmation of the trend direction. A bullish crossover of the price above these moving averages can strengthen the buy signal, while a bearish crossover can strengthen the sell signal.
- Execute Trades: When the price breaks through the Golden Pocket level and is confirmed by moving average crossovers, consider entering a long or short position.
- Manage Risk: Set stop-loss orders to limit potential losses and take-profit orders to secure profits. Consider using trailing stops to lock in gains as the trend progresses.
- Monitor Trade: Keep an eye on the trade as it progresses. Adjust stop-loss and take-profit levels based on market conditions and price action.
Strategy Advantages
- Multiple Confirmations: The strategy combines trendline analysis, Fibonacci levels, and moving averages to provide reliable signals for breakout trades. This multi-confirmation approach helps filter out false breakouts and improves the success rate of trades.
- Trend Following: By using moving averages to confirm the trend direction, the strategy allows traders to trade in line with the prevailing trend. This helps traders stay in the market during strong trends, maximizing profit potential.
- Risk Management: The strategy incorporates stop-loss and take-profit orders to manage risk and protect profits. This helps minimize potential losses while allowing profits to run. The use of trailing stops further optimizes the risk-reward ratio.
Strategy Risks
- False Breakouts: Despite the multi-confirmation approach, false breakout signals may still occur. This can lead to losing trades and capital losses. To mitigate this risk, traders can consider adding more confirmation factors or adjusting parameters to improve signal quality.
- Lagging Signals: As the strategy relies on lagging indicators such as moving averages and Fibonacci levels, signals may lag in fast-moving market conditions. This can result in delayed entries or missed profitable trading opportunities. To address this, traders can incorporate other leading indicators or price action patterns.
- Unexpected Events: Unforeseen market events or news can cause sudden price spikes, triggering stop-loss orders or leading to significant losses. To mitigate this risk, traders can use wider stop-loss placements or temporarily exit the market before major events.
Strategy Optimization Directions
- Parameter Optimization: The key parameters of the strategy, such as EMA periods, Fibonacci levels, and stop-loss placements, can be improved through backtesting and optimization. By systematically testing different parameter combinations, traders can determine the settings that best suit their market and trading style.
- Incorporating Additional Indicators: To enhance signal quality and confirmation, additional technical indicators can be incorporated into the strategy, such as the Relative Strength Index (RSI), Average True Range (ATR), or volatility indicators. These extra filters can help distinguish high-probability setups from false breakouts.
- Dynamic Stop-Loss: Implementing dynamic or adaptive stop-loss methods, such as ATR-based or price action-based stops, can better adapt to different market conditions. This can improve risk-adjusted returns by providing more breathing room during trending phases while tightening risk during range-bound markets.
- Multi-Timeframe Analysis: Analyzing breakout signals across multiple timeframes can provide a more comprehensive view of the market. Traders can look for confirmations on higher timeframes, such as daily breakouts, and then execute trades on lower timeframes, such as the 4-hour chart. This helps separate short-term noise from long-term trends.
Conclusion
The Golden Harmony Breakout strategy offers a systematic approach to capturing trendline breakout trading opportunities. By combining multiple technical indicators, such as EMAs, Fibonacci levels, and moving averages, the strategy aims to generate high-probability trading signals. While the strategy has advantages in terms of multiple confirmations and trend-following, traders must still be aware of the risks of false breakouts, lagging signals, and unexpected events. By optimizing key parameters, incorporating additional indicators, employing dynamic stop-losses, and utilizing multi-timeframe analysis, the performance of the strategy can be further enhanced. Overall, the Golden Harmony Breakout strategy provides a robust framework for traders looking to capitalize on breakout trading opportunities. [/trans]
Source (PineScript)
/*backtest
start: 2023-05-22 00:00:00
end: 2024-05-27 00:00:00
period: 1d
basePeriod: 1h
exchanges: [{"eid":"Binance","currency":"BTC_USDT"}]
*/

// This Pine Script™ code is subject to the terms of the Mozilla Public License 2.0 at https://mozilla.org/MPL/2.0/
// © spikeroy123

//@version=5
strategy("Golden Pocket Trendline Breakout Strategy", overlay=true, max_bars_back=500, max_lines_count=500)

// Core settings
int Period = input.int(10, title='Period')
bool Trendtype = input.string(title="Type", defval='Wicks', options=['Wicks', 'Body']) == 'Wicks'
string Extensions = input.string(title='Extend', defval='25', options=['25', '50', '75'])
color LineCol1 = input.color(color.rgb(109, 111, 111, 19), title="Line Color")
bool ShowTargets = input.bool(true, title="Show Targets")

// Fibonacci settings
bool ShowFib = input.bool(true, title="Show Golden Pocket")
color gp_color_618 = input.color(color.new(color.yellow, 0), title="0.618 Level Color")
color gp_color_65 = input.color(color.new(color.orange, 0), title="0.65 Level Color")

// Calculate EMAs and HMA
fast_ema = ta.ema(close, 9)
slow_ema = ta.ema(close, 21)
ema_200 = ta.ema(close, 200)
hma_300 = ta.hma(close, 300)
ma_18 = ta.sma(close, 18)

// Plot EMAs and HMA
plot(fast_ema, color=color.blue, title="Fast EMA (9)")
plot(slow_ema, color=color.red, title="Slow EMA (21)")
plot(ema_200, color=color.orange, title="EMA 200")
plot(hma_300, color=color.green, title="HMA 300")
plot(ma_18, color=color.purple, title="MA 18") // Plot 18-day moving average

// Calculate and plot Golden Pocket
var float low = na
var float high = na
var float fib_618 = na
var float fib_65 = na

if (ta.crossover(fast_ema, slow_ema))  // Example condition to reset high and low
    low := na(low) ? close : math.min(low, close)
    high := na(high) ? close : math.max(high, close)
else if (ta.crossunder(fast_ema, slow_ema))  // Example condition to plot the golden pocket
    low := na
    high := na

if (ShowFib and not na(low) and not na(high))
    fib_618 := high - (high - low) * 0.618
    fib_65 := high - (high - low) * 0.65


if (ShowFib and not na(fib_618) and close > fib_618 and ta.crossover(close, fib_618))
    strategy.entry("Buy", strategy.long)

if (ShowFib and not na(fib_618) and close < fib_618 and ta.crossunder(close, fib_618))
    strategy.entry("Sell", strategy.short)
Detail
https://www.fmz.com/strategy/452713
Last Modified
2024-05-28 13:56:59