
17 KiB
Name
斐波那契布林带与相对强弱指数组合动态止盈策略-Fibonacci-Bollinger-Bands-with-RSI-Dynamic-Take-Profit-Strategy
Author
ianzeng123
Strategy Description
[trans]
概述
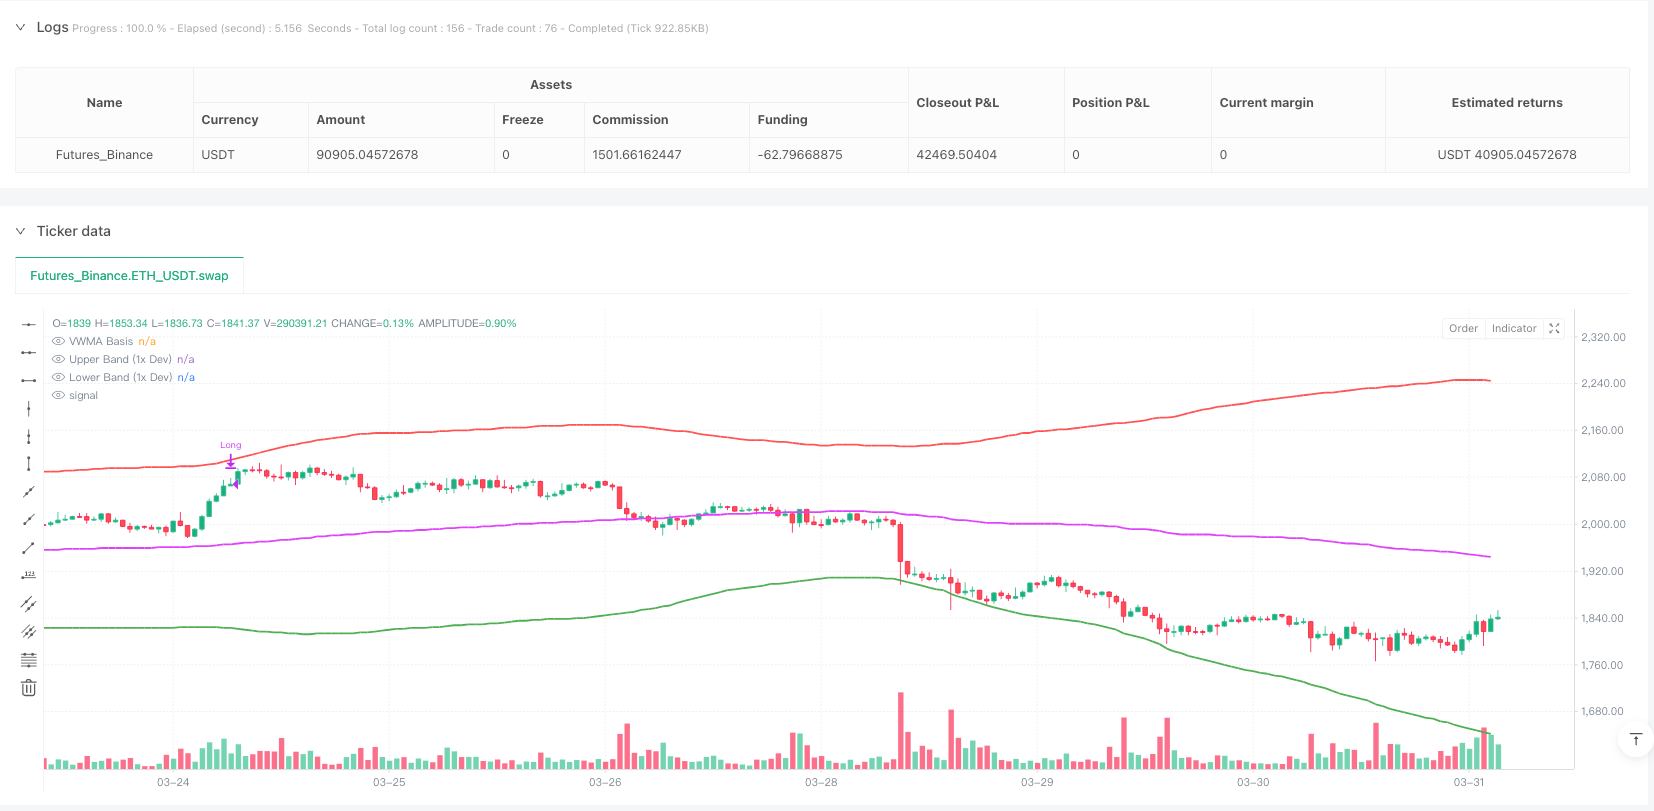
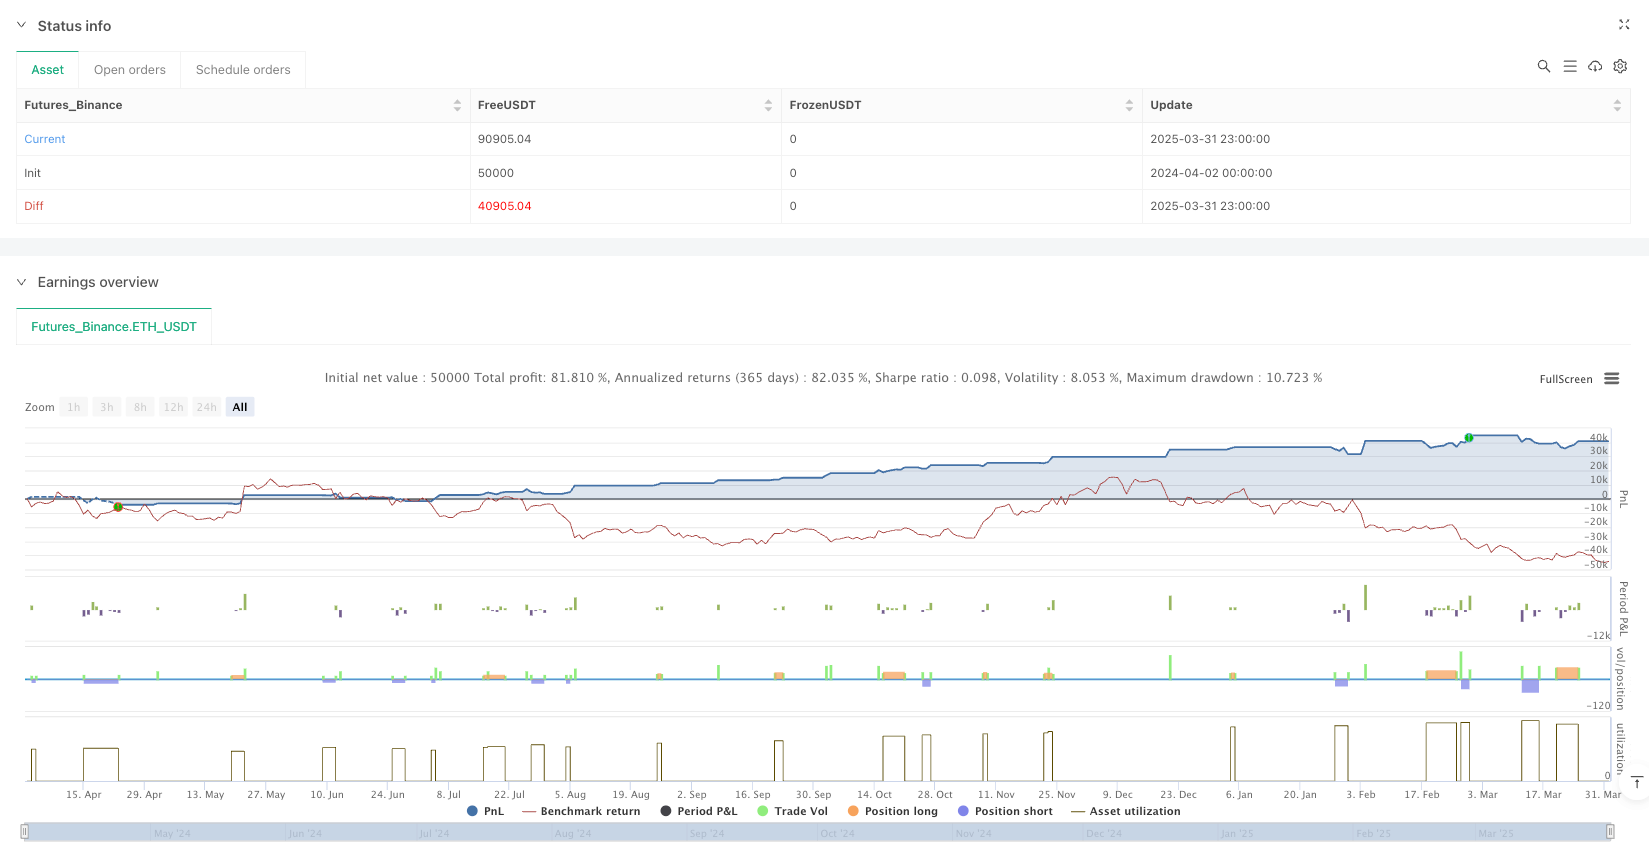
斐波那契布林带与相对强弱指数组合动态止盈策略是一种综合性的技术分析策略,它巧妙地将斐波那契布林带(FBB)、相对强弱指数(RSI)和固定百分比止盈机制相结合,创建了一个既能捕捉强势价格突破又能智能管理退出点位的交易系统。该策略基于成交量加权移动平均线(VWMA)构建了一个自定义的布林带系统,并以标准差的全1.0斐波那契水平作为关键触发点。策略采用双重退出机制,包括2%的固定止盈目标和基于RSI超买/超卖条件的动态退出信号,使交易者能够在价格达到预期目标或市场动量减弱时及时锁定利润。
策略原理
策略的核心逻辑建立在以下几个技术组件上:
-
VWMA基准线:采用200周期的成交量加权移动平均线作为布林带的中轴线,该指标相比简单移动平均线能更好地反映活跃交易市场中的真实趋势方向,因为它考虑了交易量因素。
-
斐波那契布林带:
- 上轨(红线):VWMA + (1 × 标准差)
- 下轨(绿线):VWMA - (1 × 标准差)
这些轨道代表价格的潜在支撑和阻力区域,当价格突破这些轨道时,被视为强势动量信号。
-
RSI指标:采用14周期的相对强弱指数来识别潜在的超买/超卖状态:
- RSI < 30:超卖状态,可能是做多头寸的退出信号
- RSI > 70:超买状态,可能是做空头寸的退出信号
-
入场逻辑:
- 多头入场:收盘价向上突破上轨(红线)时触发
- 空头入场:收盘价向下突破下轨(绿线)时触发
-
退出逻辑:采用双重退出机制:
- 固定止盈(2%):多头位置上涨2%或空头位置下跌2%时退出
- RSI基础退出:多头位置RSI < 30或空头位置RSI > 70时退出
该策略通过结合价格突破信号与动量指标,既能捕捉强劲的趋势运动,又能在市场动量减弱时及时退出,实现了入场与出场的平衡管理。
策略优势
-
动态价格水平:策略使用VWMA作为基准,相比传统的简单移动平均线更能适应不同交易量环境下的市场波动,提供更准确的支撑和阻力水平。
-
明确的入场信号:通过价格对布林带上下轨的突破作为入场触发点,信号清晰明确,减少了交易犹豫和主观判断。
-
双重退出保护:结合固定百分比止盈和RSI动量反转信号,创建了一个全面的退出机制,在锁定利润的同时也能避免过早退出强势趋势。
-
风险控制优先:通过设定2%的固定止盈目标,策略确保了每笔交易的风险回报比例是可预测的,有助于长期资金管理。
-
适应性强:核心参数如VWMA长度、标准差乘数、RSI周期和止盈百分比都可以根据不同市场条件和交易者风险偏好进行调整。
-
多市场应用:策略设计适用于多种时间周期,可以应用于日内短线交易和中长期摇摆交易,增强了策略的实用性。
策略风险
-
假突破风险:在波动性低的横盘市场中,价格可能会频繁穿越布林带边界而没有形成真正的趋势,导致假突破信号增多和交易成本上升。解决方法是增加额外的过滤条件,如交易量确认或更长的价格确认周期。
-
参数敏感性:策略的表现高度依赖于VWMA长度和标准差乘数等关键参数的设置。不同市场环境可能需要不同的参数组合,错误的参数设置可能导致过度交易或错过重要机会。建议通过历史回测来优化不同市场环境下的参数。
-
固定止盈的局限性:2%的固定止盈点可能在高波动性市场中太保守,而在低波动性市场中又可能太激进。可以考虑使用ATR(平均真实范围)来动态调整止盈目标,使其适应当前市场波动性。
-
RSI信号滞后:RSI作为动量指标存在一定的滞后性,可能导致在极端市场条件下的退出时机不理想。可以通过组合多个时间周期的RSI信号或添加其他领先指标来减轻这一风险。
-
趋势反转识别不足:策略主要依靠RSI来识别潜在的趋势反转,但缺乏其他趋势强度确认工具。可以考虑增加诸如ADX(平均方向指数)等趋势强度指标来改进反转识别能力。
策略优化方向
-
动态标准差调整:目前策略使用固定的标准差乘数,可以考虑基于当前市场波动性动态调整这一参数。例如,在低波动性市场中减小乘数,在高波动性市场中增大乘数,以适应不同的市场条件。
-
多时间框架分析:引入多时间框架分析可以显著提高策略的稳健性。例如,只有当较长时间框架的趋势方向与当前时间框架一致时才执行交易,这可以减少逆势交易和假突破的风险。
-
智能止损机制:除了固定止盈外,加入基于近期波动性的智能止损机制,如使用ATR的倍数作为止损点位,可以更好地控制每笔交易的风险敞口。
-
交易量确认:将交易量作为入场确认条件,要求价格突破布林带的同时伴随显著的交易量增加,可以减少假突破的概率和提高信号质量。
-
自适应RSI阈值:目前RSI使用固定的30/70作为超买/超卖阈值,可以考虑基于历史数据动态调整这些阈值,以适应不同市场的波动特性。
-
交易频率优化:增加冷却期或信号确认机制,避免在短时间内频繁交易同一方向,可以减少交易成本并提高整体策略效率。
总结
斐波那契布林带与相对强弱指数组合动态止盈策略是一个融合了多种技术分析元素的系统化交易方法。它通过VWMA基础的布林带突破提供入场信号,并利用固定止盈和RSI反转信号构建智能退出机制,为交易者提供了一个平衡风险和回报的完整框架。
该策略的主要优势在于信号明确、风险可控和参数可调整,使其适用于不同市场环境和交易风格。然而,策略也面临假突破识别、参数敏感性和固定止盈局限性等挑战。
通过引入动态参数调整、多时间框架分析、智能止损机制、交易量确认和自适应指标阈值等优化措施,策略的稳健性和适应性可以得到进一步提升。最终,该策略为技术交易者提供了一个结构化的方法来捕捉市场趋势,同时保持风险管理的纪律性,符合现代量化交易的核心原则。 ||
Overview
The Fibonacci Bollinger Bands with RSI Dynamic Take-Profit Strategy is a comprehensive technical analysis strategy that cleverly combines Fibonacci Bollinger Bands (FBB), Relative Strength Index (RSI), and a fixed percentage take-profit mechanism to create a trading system that both captures strong price breakouts and intelligently manages exit points. The strategy builds a custom Bollinger Band system based on the Volume Weighted Moving Average (VWMA) and uses the full 1.0 Fibonacci level of standard deviation as key trigger points. The strategy employs a dual exit mechanism, including a 2% fixed take-profit target and dynamic exit signals based on RSI overbought/oversold conditions, allowing traders to secure profits when price reaches the expected target or when market momentum weakens.
Strategy Principles
The core logic of the strategy is built on the following technical components:
-
VWMA Baseline: Uses a 200-period Volume Weighted Moving Average as the center axis of the Bollinger Bands. This indicator better reflects the true trend direction in actively traded markets compared to simple moving averages because it considers volume factors.
-
Fibonacci Bollinger Bands:
- Upper Band (Red): VWMA + (1 × standard deviation)
- Lower Band (Green): VWMA - (1 × standard deviation)
These bands represent potential support and resistance areas for price, and when price breaks through these bands, it is viewed as a strong momentum signal.
-
RSI Indicator: Uses a 14-period Relative Strength Index to identify potential overbought/oversold conditions:
- RSI < 30: Oversold condition, potentially an exit signal for long positions
- RSI > 70: Overbought condition, potentially an exit signal for short positions
-
Entry Logic:
- Long Entry: Triggered when closing price breaks above the Upper Band (red)
- Short Entry: Triggered when closing price breaks below the Lower Band (green)
-
Exit Logic: Employs a dual exit mechanism:
- Fixed Take-Profit (2%): Exit when long position rises 2% or short position falls 2%
- RSI-Based Exit: Exit long position when RSI < 30 or short position when RSI > 70
This strategy combines price breakout signals with momentum indicators to both capture strong trend movements and exit in a timely manner when market momentum weakens, achieving balanced management of entries and exits.
Strategy Advantages
-
Dynamic Price Levels: The strategy uses VWMA as a baseline, which adapts better to market fluctuations in different volume environments compared to traditional simple moving averages, providing more accurate support and resistance levels.
-
Clear Entry Signals: Using price breakouts of Bollinger Bands' upper and lower boundaries as entry trigger points provides clear and definitive signals, reducing trading hesitation and subjective judgment.
-
Dual Exit Protection: Combining fixed percentage take-profit and RSI momentum reversal signals creates a comprehensive exit mechanism that secures profits while avoiding premature exits from strong trends.
-
Risk Control Priority: By setting a 2% fixed take-profit target, the strategy ensures that the risk-reward ratio for each trade is predictable, aiding in long-term capital management.
-
High Adaptability: Core parameters such as VWMA length, standard deviation multiplier, RSI period, and take-profit percentage can all be adjusted according to different market conditions and trader risk preferences.
-
Multi-Market Application: The strategy design is applicable to multiple time periods and can be applied to intraday short-term trading and medium to long-term swing trading, enhancing its practicality.
Strategy Risks
-
False Breakout Risk: In low-volatility, sideways markets, prices may frequently cross Bollinger Band boundaries without forming a real trend, leading to increased false breakout signals and trading costs. The solution is to add additional filtering conditions, such as volume confirmation or longer price confirmation periods.
-
Parameter Sensitivity: The strategy's performance is highly dependent on key parameter settings such as VWMA length and standard deviation multiplier. Different market environments may require different parameter combinations, and incorrect parameter settings may lead to over-trading or missing important opportunities. Historical backtesting is recommended to optimize parameters for different market environments.
-
Limitations of Fixed Take-Profit: The 2% fixed take-profit point may be too conservative in high-volatility markets and too aggressive in low-volatility markets. Consider using ATR (Average True Range) to dynamically adjust take-profit targets to adapt to current market volatility.
-
RSI Signal Lag: As a momentum indicator, RSI has a certain lag, which may lead to suboptimal exit timing in extreme market conditions. This risk can be mitigated by combining RSI signals from multiple time periods or adding other leading indicators.
-
Insufficient Trend Reversal Identification: The strategy mainly relies on RSI to identify potential trend reversals but lacks other trend strength confirmation tools. Consider adding trend strength indicators such as ADX (Average Directional Index) to improve reversal identification capabilities.
Strategy Optimization Directions
-
Dynamic Standard Deviation Adjustment: The current strategy uses a fixed standard deviation multiplier. Consider dynamically adjusting this parameter based on current market volatility. For example, decrease the multiplier in low-volatility markets and increase it in high-volatility markets to adapt to different market conditions.
-
Multi-Timeframe Analysis: Introducing multi-timeframe analysis can significantly enhance the strategy's robustness. For example, only execute trades when the trend direction of a longer timeframe aligns with the current timeframe, which can reduce the risk of counter-trend trading and false breakouts.
-
Intelligent Stop-Loss Mechanism: In addition to fixed take-profit, adding an intelligent stop-loss mechanism based on recent volatility, such as using multiples of ATR as stop-loss points, can better control risk exposure for each trade.
-
Volume Confirmation: Using volume as an entry confirmation condition, requiring significant volume increase accompanying price breakouts of Bollinger Bands, can reduce the probability of false breakouts and improve signal quality.
-
Adaptive RSI Thresholds: Currently, RSI uses fixed 30/70 as overbought/oversold thresholds. Consider dynamically adjusting these thresholds based on historical data to adapt to the volatility characteristics of different markets.
-
Trading Frequency Optimization: Adding cooling periods or signal confirmation mechanisms to avoid frequent trading in the same direction within a short time can reduce trading costs and improve overall strategy efficiency.
Summary
The Fibonacci Bollinger Bands with RSI Dynamic Take-Profit Strategy is a systematic trading approach that integrates multiple elements of technical analysis. It provides entry signals through VWMA-based Bollinger Band breakouts and builds intelligent exit mechanisms using fixed take-profit and RSI reversal signals, offering traders a complete framework that balances risk and reward.
The main advantages of this strategy lie in clear signals, controllable risk, and adjustable parameters, making it applicable to different market environments and trading styles. However, the strategy also faces challenges such as false breakout identification, parameter sensitivity, and limitations of fixed take-profit.
By introducing dynamic parameter adjustments, multi-timeframe analysis, intelligent stop-loss mechanisms, volume confirmation, and adaptive indicator thresholds, the robustness and adaptability of the strategy can be further enhanced. Ultimately, this strategy provides technical traders with a structured method to capture market trends while maintaining disciplined risk management, aligning with the core principles of modern quantitative trading.[/trans]
Source (PineScript)
/*backtest
start: 2024-04-02 00:00:00
end: 2025-04-01 00:00:00
period: 1h
basePeriod: 1h
exchanges: [{"eid":"Futures_Binance","currency":"ETH_USDT"}]
*/

//@version=5
strategy("Fibonacci BB Strategy with RSI + 2% Exit", overlay=true, default_qty_type=strategy.percent_of_equity, default_qty_value=100)

// === INPUTS ===
length = input(200, title="VWMA Length")
src = input(hlc3, title="Source")
mult = input(3.0, title="Deviation Multiplier")
rsiLength = input.int(14, title="RSI Length")
profitTargetPercent = input.float(2.0, title="Profit Target (%)")

// === FBB CALCULATIONS ===
basis = ta.vwma(src, length)
dev = mult * ta.stdev(src, length)
upper_6 = basis + (1 * dev)  // RED line
lower_6 = basis - (1 * dev)  // GREEN line

// === RSI ===
rsi = ta.rsi(close, rsiLength)

// === SIGNAL CONDITIONS ===
buySignal = ta.crossover(close, upper_6)
sellSignal = ta.crossunder(close, lower_6)

// === STRATEGY ENTRIES ===
if buySignal
    strategy.entry("Long", strategy.long)

if sellSignal
    strategy.entry("Short", strategy.short)

// === STRATEGY EXITS ===
// 2% profit in points
longTakeProfit = strategy.position_avg_price * (1 + profitTargetPercent / 100)
shortTakeProfit = strategy.position_avg_price * (1 - profitTargetPercent / 100)

// Long Exit: RSI < 30 or price >= TP
if strategy.position_size > 0
    if close >= longTakeProfit or rsi < 30
        strategy.close("Long")

// Short Exit: RSI > 70 or price <= TP
if strategy.position_size < 0
    if close <= shortTakeProfit or rsi > 70
        strategy.close("Short")

// === PLOTS ===
plot(basis, color=color.fuchsia, linewidth=2, title="VWMA Basis")
plot(upper_6, color=color.red, linewidth=2, title="Upper Band (1x Dev)")
plot(lower_6, color=color.green, linewidth=2, title="Lower Band (1x Dev)")
Detail
https://www.fmz.com/strategy/489134
Last Modified
2025-04-02 09:37:00