
9.4 KiB
Name
改进型多空转换K线形态突破策略Improved-Swing-High-Low-Breakout-Strategy-with-Bullish-and-Bearish-Engulfing-Patterns
Author
ChaoZhang
Strategy Description
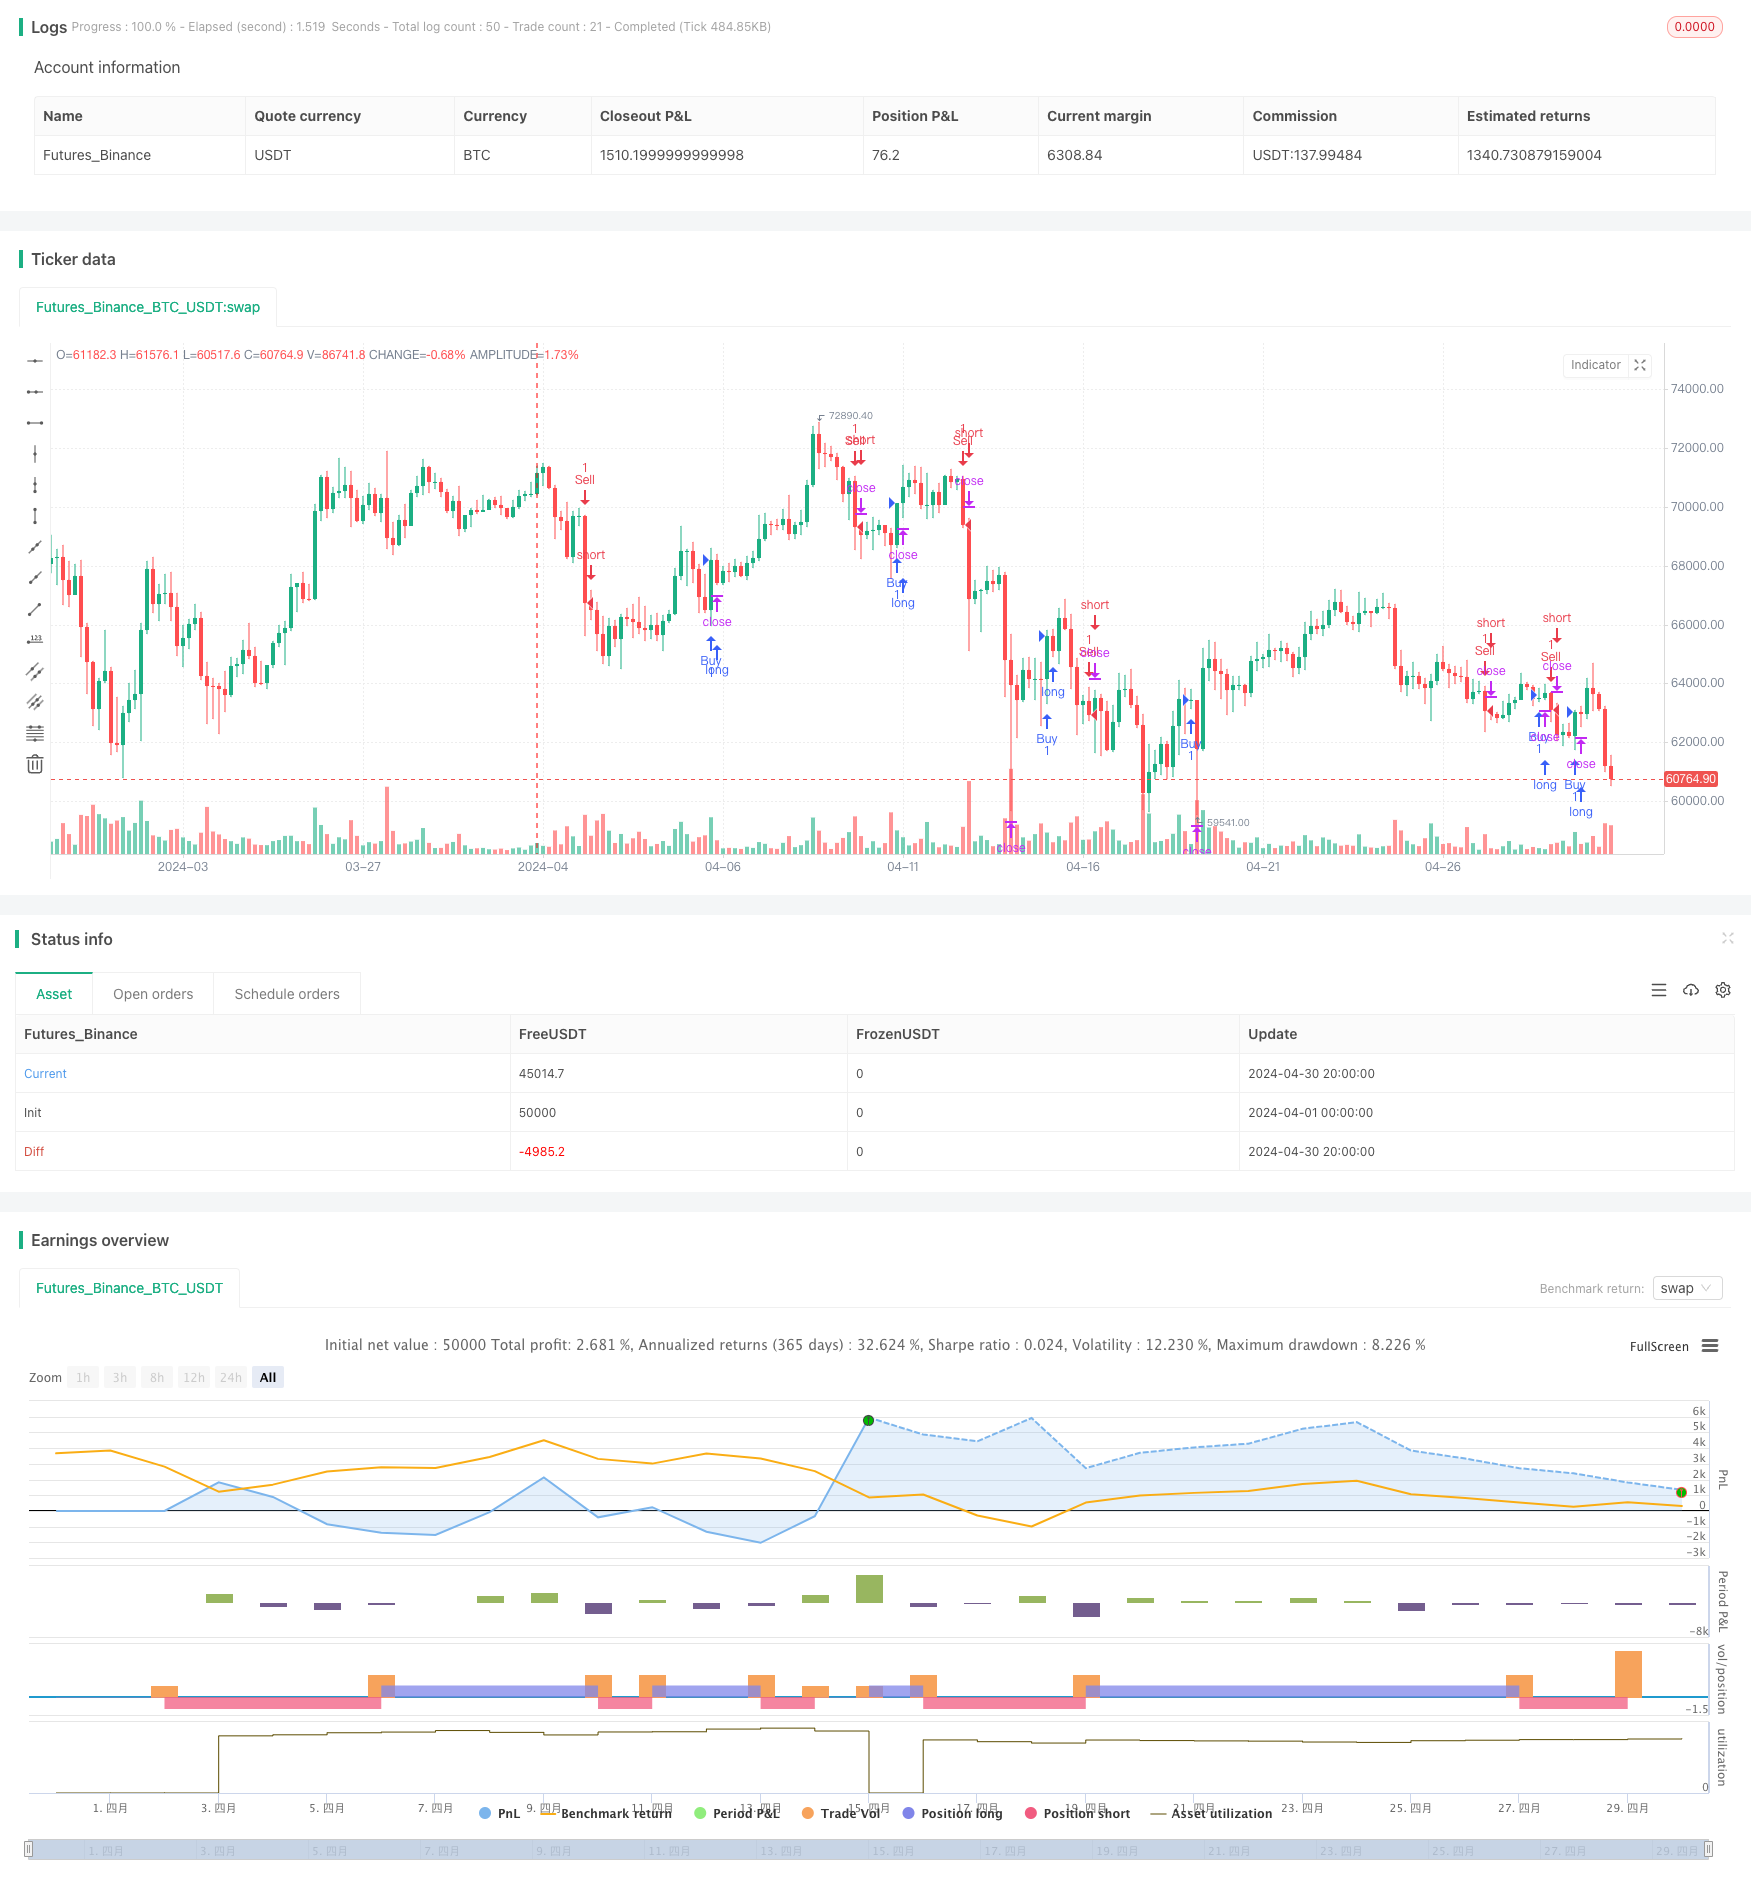
[trans]
概述
该策略是一种改进型的多空转换突破策略,旨在利用看涨和看跌吞没形态K线组合来捕捉潜在的趋势反转信号。策略通过识别swing高点和低点,并在价格突破这些关键水平时产生交易信号。同时,该策略采用了预定义的风险回报比来设置止盈和止损水平,以更好地管理交易风险。
策略原理
- 计算swing高点和低点:通过比较当前高点和低点与前两个周期的高低点,判断是否形成了新的swing高点或低点。
- 识别看涨和看跌吞没形态:当收盘价高于前一周期的开盘价,且当前K线为阳线,前一周期为阴线时,判断为看涨吞没形态;反之,当收盘价低于前一周期的开盘价,且当前K线为阴线,前一周期为阳线时,判断为看跌吞没形态。
- 生成交易信号:当看涨吞没形态出现,并且价格突破swing高点时,产生做多信号;当看跌吞没形态出现,并且价格突破swing低点时,产生做空信号。
- 设置止盈止损:根据预定义的风险回报比计算止盈和止损水平,并在交易执行时设置相应的止盈止损单。
优势分析
- 结合价格行为和K线形态:该策略不仅考虑了价格突破关键水平,还结合了看涨和看跌吞没形态,提高了交易信号的可靠性。
- 风险管理:通过预定义风险回报比设置止盈止损,有助于控制单次交易的风险敞口,提高整体风险管理效果。
- 适应不同市场状况:策略同时考虑多空方向,可以在不同的市场趋势中寻找交易机会。
风险分析
- 假信号风险:在某些情况下,价格突破和K线形态可能产生假信号,导致交易进入错误方向。可以通过添加其他确认指标或过滤条件来减少假信号。
- 市场波动风险:在剧烈波动的市场中,价格可能快速突破关键水平并触发止损,导致连续亏损。可以通过调整止损水平或采用动态止损策略来应对。
- 交易频率和成本:频繁的交易可能增加手续费成本,影响策略的整体表现。可以通过优化入场条件或适当调整参数来控制交易频率。
优化方向
- 引入趋势确认指标:结合移动平均线或其他趋势指标,以验证价格突破的有效性,提高交易信号质量。
- 动态调整止损:根据市场波动性或价格变化动态调整止损水平,以更好地应对不同市场状况。
- 优化参数:通过对不同参数组合进行回测和优化,找出最佳的参数设置,提高策略的稳定性和盈利能力。
总结
改进型多空转换K线形态突破策略通过结合价格突破和K线形态,在捕捉趋势反转机会的同时,注重风险管理。策略的优势在于综合考虑了价格行为和市场情绪,适应不同的市场环境。然而,策略也面临假信号、市场波动和交易成本等风险,需要通过引入趋势确认指标、动态调整止损和优化参数等方法来进一步改进。总的来说,该策略为捕捉潜在的趋势反转机会提供了一种思路,但在实际应用中需要根据具体市场特点和交易需求进行适当调整和优化。
||
Overview
This strategy is an improved variation of a swing high/low breakout strategy that aims to capitalize on potential trend reversals signaled by bullish and bearish engulfing candlestick patterns. The strategy identifies swing highs and lows and generates trading signals when prices break through these key levels. Additionally, the strategy employs a predefined risk-reward ratio to set take-profit and stop-loss levels for better risk management.
Strategy Principles
- Calculating swing highs and lows: By comparing the current high and low with the highs and lows of the previous two periods, the strategy determines whether a new swing high or low has formed.
- Identifying bullish and bearish engulfing patterns: A bullish engulfing pattern is recognized when the closing price is higher than the previous period's opening price, and the current candle is a bullish candle, while the previous period is a bearish candle. Conversely, a bearish engulfing pattern is identified when the closing price is lower than the previous period's opening price, and the current candle is a bearish candle, while the previous period is a bullish candle.
- Generating trading signals: When a bullish engulfing pattern occurs, and the price breaks above the swing high, a long signal is generated. When a bearish engulfing pattern occurs, and the price breaks below the swing low, a short signal is generated.
- Setting take-profit and stop-loss: The take-profit and stop-loss levels are calculated based on the predefined risk-reward ratio and are set when executing trades.
Advantage Analysis
- Combining price action and candlestick patterns: The strategy not only considers price breakouts at key levels but also incorporates bullish and bearish engulfing patterns, enhancing the reliability of trading signals.
- Risk management: By setting take-profit and stop-loss levels based on a predefined risk-reward ratio, the strategy helps control the risk exposure of individual trades and improves overall risk management.
- Adaptability to different market conditions: The strategy considers both long and short directions, allowing it to find trading opportunities in various market trends.
Risk Analysis
- False signal risk: In some cases, price breakouts and candlestick patterns may generate false signals, leading to trades in the wrong direction. This risk can be mitigated by adding additional confirmation indicators or filtering conditions.
- Market volatility risk: In highly volatile markets, prices may quickly break through key levels and trigger stop-losses, leading to consecutive losses. Adjusting stop-loss levels or employing dynamic stop-loss strategies can help address this risk.
- Trading frequency and costs: Frequent trading may increase transaction costs, affecting the overall performance of the strategy. Optimizing entry conditions or appropriately adjusting parameters can help control trading frequency.
Optimization Directions
- Introducing trend confirmation indicators: Combining moving averages or other trend indicators to validate the effectiveness of price breakouts can improve the quality of trading signals.
- Dynamic stop-loss adjustment: Dynamically adjusting stop-loss levels based on market volatility or price changes can help better adapt to different market conditions.
- Parameter optimization: By backtesting and optimizing different parameter combinations, the optimal parameter settings can be found to improve the stability and profitability of the strategy.
Summary
The improved swing high/low breakout strategy with bullish and bearish engulfing patterns combines price breakouts and candlestick patterns to capture potential trend reversal opportunities while emphasizing risk management. The strategy's advantages lie in its consideration of both price action and market sentiment, adapting to different market environments. However, the strategy also faces risks such as false signals, market volatility, and trading costs, which need to be addressed through the introduction of trend confirmation indicators, dynamic stop-loss adjustment, and parameter optimization. Overall, this strategy provides an approach to capturing potential trend reversal opportunities, but it requires appropriate adjustments and optimizations based on specific market characteristics and trading requirements when applied in practice. [/trans]
Source (PineScript)
/*backtest
start: 2024-04-01 00:00:00
end: 2024-04-30 23:59:59
period: 4h
basePeriod: 15m
exchanges: [{"eid":"Futures_Binance","currency":"BTC_USDT"}]
*/

// This Pine Script™ code is subject to the terms of the Mozilla Public License 2.0 at https://mozilla.org/MPL/2.0/
// © Markoline007

//@version=5
strategy("Improved Swing High/Low Breakout Strategy", overlay=true)

// Define input variables
length = input(14, title="Swing Length")
multiplier = input(3, title="Multiplier")
risk_reward_ratio = input(1.6, title="Risk-Reward Ratio")
target_multiplier = input(2, title="Target Multiplier")

// Calculate swing highs and swing lows
var float lastHigh = na
var float lastLow = na
var bool isHigh = na
var bool isLow = na

if high[1] < high and high[2] < high[1]
    lastHigh := high[1]
    isHigh := true
    isLow := false
else if low[1] > low and low[2] > low[1]
    lastLow := low[1]
    isLow := true
    isHigh := false
else
    isHigh := false
    isLow := false

// Define buy and sell conditions
buySignal = close > lastHigh and close > open and close[1] < open[1] // Bullish engulfing
sellSignal = close < lastLow and close < open and close[1] > open[1] // Bearish engulfing

// Calculate stop and target levels
stopLevel = close
targetLevel = close + (close - stopLevel) * risk_reward_ratio

// Execute buy and sell trades
if buySignal
    strategy.entry("Buy", strategy.long)
    strategy.exit("TP/SL", "Buy", profit=targetLevel, loss=stopLevel)
if sellSignal
    strategy.entry("Sell", strategy.short)
    strategy.exit("TP/SL", "Sell", profit=targetLevel, loss=stopLevel)
Detail
https://www.fmz.com/strategy/451724
Last Modified
2024-05-17 15:05:29